Min Hou*![]() | Yongpeng Tang
| Yongpeng Tang![]()
© 2023 IIETA. This article is published by IIETA and is licensed under the CC BY 4.0 license (http://creativecommons.org/licenses/by/4.0/).
OPEN ACCESS
With the rise in online shopping, the role of product images in shaping consumer purchase decisions has been accentuated. Despite burgeoning research in this domain, there remains a lacuna in comprehensively understanding the relationship between specific visual attributes, such as color and target shape, in product images and the consequent sales volume. To bridge this gap, the relationship between product image colors and sales volume on online platforms was examined, and color attributes from these images were systematically extracted. Furthermore, an exploration was undertaken into the association between the target shape of product images and sales volume. Deep Learning Super Sampling (DLSS) features from these images were distilled, aiming to furnish a more precise market analysis. Through leveraging advanced machine learning techniques, this study not only augments the academic comprehension of consumer behavior but also proffers strategic insights for online retail practitioners. The methodological approach ensures a targeted marketing direction and facilitates informed product design strategies.
online shopping, product images, sales volume, visual feature extraction, color analysis, target shape, DLSS features, machine learning
In the wake of the Internet's rapid evolution, online shopping has seamlessly woven itself into the fabric of daily life, establishing itself as a pivotal facet of contemporary consumption [1-4]. Within this milieu, the role of product images has transcended mere informational conveyance, evolving to become a determinative element in consumer purchasing decisions. It has been observed that visual attributes of these images, encompassing elements like color, shape, and texture, exert a significant influence on consumer psychology, from emphasizing product features to galvanizing purchasing intent [5-8].
Yet, the intricate relationship between product images and sales volume, especially the potential to leverage visual attributes to enhance sales, remains an enigma. An exploration into this interplay not only straddles the realms of marketing and consumer behavior but also bears significant socio-economic implications [9, 10]. Through rigorous scrutiny of the nexus between image attributes and sales, invaluable insights into consumer predilections and purchasing patterns can be gleaned, furnishing a robust foundation to refine marketing strategies and render product designs more enticing [11-14]. This discourse further stimulates technological and theoretical advancements in corollary domains like visual marketing and artificial intelligence [15, 16].
Regrettably, despite burgeoning interest from both academia and industry, current research methodologies exhibit palpable limitations. A predominant swath of conventional analyses is observed to hover on a descriptive veneer, often sidelining granular feature scrutiny within images such as nuanced color juxtapositions, target shape differentials, among others [17, 18]. Moreover, extant methodologies are predominantly anchored in quantitative statistical paradigms, manifestly deficient in their capacity to process and discern visual data, thus obscuring subtle yet pivotal visual nuances [19-22].
This research endeavor seeks to illuminate the multifaceted relationship between product images and sales volume. The investigative focus bifurcates into two key strands: The initial segment underscores the correlation between product image color on online shopping platforms and sales volume, with endeavors being made to extrapolate color features through avant-garde machine learning techniques. Subsequent emphasis is channeled toward discerning the interrelationship between the target shape of product images and sales volume, culminating in the meticulous extraction of the DLSS features from these images. Through this prism, this study not only furnishes a novel theoretical framework but is also poised to unlock substantial pragmatic applications. Such insights stand poised to equip online retailers with the acumen to intuitively resonate with and invigorate consumer purchasing propensities while concurrently seeding fertile grounds for scholarly and practical pursuits in allied domains.
Distinct colors have been observed to elicit varied emotional responses. Recognized as a primary conduit for visual information assimilation, color often emerges as a paramount factor commanding consumer attention. The deployment of vibrant hues or color palettes, aptly tailored for a specific target demographic, can captivate consumer attention, potentially elevating product engagement and amplifying purchase inclination. Moreover, it has been noted that seasonal variations and prevailing trends may shape the color schema of product images. Illustratively, a surge in sales is often associated with products aligning with a season's trending colors, underscoring the dynamic and indirect relationship between color and sales. Consequently, the nexus between product image color on online shopping platforms and sales volume can be characterized as multi-tiered and multi-dimensional. While the direct relationship predominantly gravitates towards the color's immediate influence on consumer psychology and behavior, the indirect relationship casts a broader net, encompassing socio-cultural and visual considerations.
Through the extraction of color features, quantifiable and analyzable data is derived from the color information inherent in product images. Simultaneously, by examining which hues or color combinations resonate most potently in sales and discerning correlations between color attributes and sales metrics, latent consumer needs and psychological inclinations are unveiled. Such insights hold the potential to delineate which color attributes might be pivotal in bolstering sales. Furthermore, they can offer a reflection of evolving market trends and seasonality, bearing significant implications for informed product design and strategic marketing initiatives.
2.1 Preprocessing of product images
In the realm of online shopping platforms, the veracity and consistency of product images are frequently compromised due to variables like shooting environment, lighting conditions, and camera parameters. Such variables can induce a color cast in images, thereby diminishing their representational fidelity. Furthermore, highlights present in these images can skew color distribution and texture information, posing challenges to subsequent feature extraction. Noise, which may be introduced through factors such as suboptimal shooting quality or compression errors, can further impede the effective extraction of color features. To navigate these challenges, a rigorous preprocessing regimen must be applied to these images. Essential steps in this regimen include color cast correction, highlight mitigation, and denoising, which collectively fortify the authenticity, consistency, and precision of image quality. This, in turn, paves the way for more rigorous color feature extraction and subsequent sales volume analysis.
Color casts in product images, regrettably, are a pervasive phenomenon. Such color deviations can arise from a plethora of sources. Different light sources, ranging from sunlight to incandescent lamps, can engender varying color temperatures and light intensities, which are implicated in the onset of color casts. Additionally, discrepancies stemming from divergent camera brands, models, shooting modes, or white balance settings can lead to color inconsistencies. Image manipulation processes, such as color adjustment and compression, may further exacerbate these issues, producing distortions like supersaturation or diminished contrast. Such color casts not only potentially breed mistrust in consumers due to disparities between product images and their real-world counterparts but also can amplify refund rates, thereby escalating operational costs for merchants.
In this study, color casts in product images were rectified utilizing a principle rooted in color constancy. Specifically, calibration was performed using established reference objects or color cards, thus ensuring the precision of color restoration.
The correction formula for the R channel is delineated as follows:
$U_e(z, t)=i U_e^2(z, t)+c U_e^2(z, t)$ (1)
For the Gray World hypothesis to hold true, the ensuing formula must be met:
$\sum_{z=1}^L \sum_{t=1}^B \bar{U}_e(z, t)=\sum_{z=1}^L \sum_{t=1}^B U_h(z, t)$ (2)
Subsequently,
$\omega \sum_{z=1}^L \sum_{t=1}^B U_e^2(z, t)+c \sum_{z=1}^L \sum_{t=1}^B U_e(z, t)=\sum_{z=1}^L \sum_{t=1}^B U_h(z, t)$ (3)
Eqs. (2)-(3) were transposed into a matrix format, taking into account variables ω and c. With the preservation of the G channel's integrity, a pixel-by-pixel color correction was meticulously executed in the R and B channels of the product images as illustrated:
$\begin{aligned} & \omega \operatorname{MAX}_{z, t}\left\{U_e^2(z, t)\right\}+c MAX_{z, t}\left\{U_e(z, t)\right\} =MAX_{z, t}\left\{\left\{U_h(z, t)\right\}\right.\end{aligned}$ (4)
Another pervasive complication encountered within product images on digital commerce platforms is the presence of multiple highlights. Such manifestations can be attributed to excessively potent light sources, suboptimal angles, or the employment of multiple lighting fixtures. Additionally, certain product materials, notably metal, glass, or glossy plastics, inherently facilitate the formation of light reflections, consequently producing highlights. The presence of excessive highlights can potentially obfuscate and convolute product images, detracting from the consumers' focus and comprehension of product intricacies. Moreover, these highlights might mask or distort pivotal product data and nuances, rendering the product evaluation process challenging for potential buyers.
In this research, highlight elimination within product images was approached through an area reconstruction method. The crux of this procedure revolved around the precise determination of the highlighted area's central point. Initially, a color image underwent a conversion process to its grayscale counterpart, thereby streamlining subsequent computations. A judicious threshold was subsequently instituted, segmenting the image into highlighted and non-highlighted sectors. The highlighted regions were demarcated, and each contiguous highlight block was discerned. For each of these blocks, the geometric center or center of gravity—essentially the central point of the highlights—was meticulously calculated. Designating r as the central highlight point and using [s n v f r d h g u] to represent grayscale pixel values, s-r-u, v-r-h, d-r-f and n-r-g were delineated as four linear trajectories intersecting at the point r. These lines bifurcated the image domain into dichotomous sections. The ensuing formula was employed to compute the absolute value delineating the discrepancy between average values of the dual sub-regions associated with each line:
$\begin{aligned} & f 1=|(s+n+v) / 3-(g+u+h) / 3| \\ & f 2=|(s+n+h) / 3-(v+d+u) / 3| \\ & f 3=|(s+n+f) / 3-(u+f+g) / 3| \\ & f 4=|(n+v+d) / 3-(f+g+h) / 3|\end{aligned}$ (5)
In further endeavors to refine image quality, both opening and closing operations—fundamental processes in morphological filtering—were executed. These operations aimed at diminishing or tempering the highlighted areas. By amalgamating center point positioning with the opening and closing procedures, the method predicated on area reconstruction demonstrated efficacy in attenuating, if not eradicating, multifarious highlights in product images. Such methodologies not only preserved salient image features and minutiae but also subdued or nullified the perturbing highlighted domains. Consequently, a palpable enhancement in the authenticity and quality of product images on e-commerce platforms was observed. Designating ○ and ● as symbols for the opening and closing operations respectively, the following algorithmic approach was adopted:
Firstly, an area opening reconstruction for the product image, denoted as dp, was undertaken with ho=d○N acting as the marker diagram, resulting in an output image labeled dp. Subsequently, the product image dp underwent an area closing reconstruction, where hov=dp○N served as the marker, leading to the output image dpv.
Noise—another prevalent impediment in product images on digital commerce platforms—could wield significant influence over sales metrics. Factors such as low-light shooting conditions or the deployment of subpar camera hardware might culminate in a disproportionate balance between image signals and noise signals. Furthermore, image compression, a tactic employed to economize on storage and expedite loading times, when taken to extremes, has been identified as a precursor to information attrition and palpable noise manifestation. Not only does this noise compromise the visual finesse of the image, making it appear coarse or out-of-focus, but it also skews colors, contours, and intricate details of the merchandise, potentially leading to consumer misjudgement of the product.
Representing the image by d(z,t), the noise by b(z,t), and the output subsequent to image perturbation by h(z,t), the additive noise expression for product images was characterized as:
$h(z, t)=d(z, t)+b(z, t)$ (6)
For noise attenuation, judicious selection of denoising filters, encompassing mean filtering, median filtering, or Wiener filtering, was undertaken. The efficacy of the noise reduction was either visually assessed or gauged using quality indices such as the Peak Signal-to-Noise Ratio (PSNR), thereby confirming that the images' denoised state met stipulated criteria.
2.2 Color feature extraction in product images
In the realm of visual psychology, the color red has frequently been linked with a plethora of emotions, encompassing vitality, passion, and desire, to name a few. By delving into the prevalence of the red component within product imagery, potential emotional triggers elicited in consumers can be discerned. Concurrently, the extraction of this red component becomes instrumental in elucidating certain visual attributes of products, exemplified by the vibrant hues observed in ripened fruits. Assessing both the distribution and intensity of the red element within images facilitates a critical evaluation of the efficacy with which product images accentuate these attributes.
In this investigation, the relative red component information from product images available on digital commerce platforms was meticulously extracted in the RGB domain. The ensuing formula delineates the computation process for the relative red component information for a given image:
$R L=\frac{R E D_{M E}-G R E Y_{M E}}{G R E Y_{M E}}$ (7)
Hue, revered as a fundamental facet of color, succinctly conveys the primary color tone of an entity. A rigorous analysis of hue ensures an authentic representation of a product's color traits, thereby proffering consumers with a more genuine and precise depiction. It is worthy of note that disparate hues can invoke varied psychological responses and, in turn, influence purchasing inclinations. For instance, the resonance of warmth and solace is commonly attributed to warm colors, while their cooler counterparts tend to evoke sentiments of professionalism and serenity. A systematic exploration into the nexus between hue and sales metrics yields insights into consumer purchasing proclivities.
Figure 1. Illustrative portrayal of products encapsulating diverse hues
Subsequently, hue characteristics were diligently extracted from the Hue Saturation Brightness (HSV) color spectrum of product images present on online retail interfaces, as depicted in Figure 1. The underlying algorithm for this extraction is as follows:
$\begin{aligned} g(V)= \left\{\begin{array}{l}360-\operatorname{COS}^1 \frac{0.5[(R-G)+(R-B)]}{\sqrt{(R-G)^2+(R-B)(G-B)}} \\ B>G \\ \operatorname{COS}^{-1} \frac{0.5[(R-G)+(R-B)]}{\sqrt{(R-G)^2+(R-B)(G-B)}} \\ B \leq G\end{array}\right.\end{aligned}$ (8)
In the intricate landscape of digital commerce, the correlation between the target shape of product images and sales volumes has been observed. First impressions of consumers are often swayed by the shape of product images, with distinctive and captivating forms garnering heightened attention, which potentially augments viewership and purchase intent. In certain scenarios, the morphology of products inherently conveys their functionality. For instance, the form of items like furniture, tableware, or tools can be posited to mirror their practical usability and ergonomic comfort. It is surmised that consumers might gauge a product's appropriateness for their requirements, pivoting largely on its shape. Through meticulous analysis of these relationships, product images can be more accurately tailored, enabling more efficacious communication of product specifics. This not only enhances the potential for sales conversions but also fortifies brand image and market positioning.
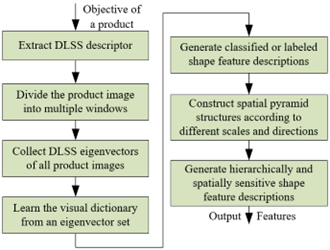
Figure 2. The procedural representation of DLSS descriptor generation
While DLSS is predominantly associated with augmenting resolution and quality in image rendering, within the context of this study, DLSS is perceived as a distinctive target shape feature, drawing upon deep learning technologies for the extraction and analysis of product imagery. Employing DLSS feature extraction allows for precise identification of target shapes amidst multifarious product images, even when confronted with multiple perturbing factors. This facilitates a robust analytical foundation, elucidating the nexus between shape and sales metrics. Notably, DLSS does not singularly focus on shape feature analysis but amalgamates other visual aspects like color and texture. A holistic understanding of how product imagery steers consumer behavior and purchasing decisions can thus be achieved through this comprehensive lens, as delineated in Figure 2.
The DLSS algorithm's implementation was systematically outlined in the following manner:
Initially, optimal window sizes and sub-window sizes were identified, catering to the analysis of local shape features within the image. A sub-window, denoted by Uo, was centered around the pixel o, with UE serving as the corresponding search image domain. Within both UE and Uo, the sum of squared grayscale value discrepancies among all pixels was determined, thereby encapsulating the local texture and shape data of the image. Here, UE was demarcated by the red boundary; Uo was represented by the blue square region; and Uq was specified as the 5×5 window within UE. With ouk and quk as the pixels in Uo and Uq respectively, the formula to compute the sum of squared grayscale discrepancies for every pixel in Uo and Uq was articulated as:
$A A F_{o q}=\sum_{u=1}^5 \sum_{k=1}^5\left(o_{u k}-q_{u k}\right)^2, u, k \in[1,5]$ (9)
Subsequently, the aforecalculated sum of squared grayscale discrepancies underwent normalization, constraining its value domain within a pre-defined range, like [0,1]. This step was instrumental in negating absolute grayscale divergences across images and set the stage for the ensuing analytical phase. Given cseNO as the grayscale deviation resultant from noise and lighting interference and cseAU(o) symbolizing the structure of image blocks in proximity to the pixel o (denoting the maximum sum of grayscale discrepancies squared for surrounding regions equivalent in magnitude to Uo), the subsequent formula emerged:
$A_o=\exp \left(-\frac{A A F_o}{M A X\left(\operatorname{cse}_{N O}, \operatorname{cse}_{A U}(o)\right)}\right)$ (10)
In the third phase, the normalized sum of squared grayscale variations was transposed to the polar coordinate domain, describing the local shape via the polar coordinates' angle and radius. Regions in this polar coordinate sphere were demarcated based on predetermined angle and radius parameters. Post this delineation, the eigenvalue for each region, derived from the image blocks, was computed. The culmination of this step witnessed the amalgamation of eigenvalues from all sectors into an eigenvector, epitomizing the image's local shape attributes.
To conclude the DLSS procedure, potential grayscale fluctuations were obviated by normalizing the eigenvector Dm, ensuring uniform comparability across disparate images and regions. Upon completion of these steps, the DLSS descriptor extraction reached its fruition.
Figure 3. DLSS feature extraction flowchart
To delve deeper into the precise extraction of global discriminative attributes from product images, integration of the DLSS feature extraction mechanism with the Spatial Pyramid Matching (SPM) algorithm was undertaken, the nuances of which are illustrated in Figure 3.
In the initial step, a series of product images were chosen and subjected to the DLSS algorithm to garner local shape features. From these images, DLSS features were aggregated, culminating in comprehensive DLSS descriptors. This amalgamation facilitated a more holistic representation of the image shape. Assuming YF×YF represents the size of each sliding window and MF denotes the gap between consecutive sliding windows, a series of Ff sliding windows were derived from each image as delineated by:
$F_f=\left(\left\lfloor\left(B_m-Y_F\right) / M_F\right\rfloor+1\right)^2, B_m=56$ (11)
In the subsequent phase, the product image underwent segmentation into several windows. The coordinates of each sliding window's top-left corner were designated as (1,1) while its lower right corner was represented by (YF,YF). Within a square boundary demarcated by coordinates (4,4), (YF-4,4), (YF-4,YD-4), and (4,YF -4), DLSS descriptors were harvested from points at an interval of 4. After collating the DLSS descriptors of M points, a comprehensive set of DLSS features for corresponding sliding windows was produced. The eigenvector's length was ascertained as:
$\begin{aligned} & M_c=\left(Y_F / 4-1\right)^2 \\ & M_r=M_c \times 18\end{aligned}$ (12)
Consequently, the u-th product image yielded a DLSS eigenvector matrix, denoted as $F_u \in E^{F f \times M r}$, where $u \in[{1, b}]$. An overarching eigenvector set, F={F1,F2,...,Fb}, was established, encapsulating features from the entirety of the product images.
In the third step, DLSS eigenvectors from all product images were aggregated. The eigenvector set, F, served as the foundation to distill a visual dictionary. This dictionary, represented by $C \in E^{B f \times M r}$, epitomized salient and quintessential image shape attributes.
The fourth phase witnessed the nearest neighbor matching algorithm's deployment. Each DLSS eigenvector underwent juxtaposition with the visual dictionary's nucleus to pinpoint the closest category. Concurrently, DLSS features were channelled into their pertinent classes, engendering categorized shape feature annotations.
The fifth step was marked by the construction of a spatial pyramid architecture, discerned by varying scales and orientations. With Lo symbolizing the pyramid's layer count, LF sub-domains were established, as described by:
$L_F=\sum_{j=1}^{L_o} 2^{2(j-1)}$ (13)
Lastly, within each pyramid stratum, prior DLSS features and the visual dictionary were employed to curate layered and spatially-tuned shape feature depictions. These layers' culmination led to the inception of global discriminative features for product images, denominated as $H_u \in E^{1 \times B v}$, with parameters $u \in[1, b]$ and Bv=Bf×LF.
Figure 4. Red component analysis of product images in RGB color space
Figure 5. Hue distribution of different product images
As elucidated by Figure 4, the red component of product images in the RGB space is observed to range between 0.125 and 0.28. This component serves as an indicator of the intensity and luminosity of the red hue within the image. Historically, red has been linked with attributes such as warmth, vigor, and allure. Product images characterized by elevated red components, notably in Samples 5, 6, and 7, impart a heightened impression of warmth and vigor, potentially augmenting their ability to seize consumer interest. Additionally, the red hue often correlates with notions of luxury, sophistication, and romanticism. For instance, products exemplified by Sample 7 are perceived by consumers as being more upscale or apt for exclusive events. Within the dataset, fluctuations in the red component are found to be relatively modest, devoid of any pronounced highs or lows. Such uniformity suggests a coherent color palette across product images, fortifying the brand's consistent image. Hence, the red component in product visuals reveals a spectrum of emotional and visual qualities, influencing both consumer perception and purchasing inclinations. Through an intricate examination of the red component metrics, commercial entities can discern the visual impact of their product imagery, paving the way for refined market positioning and strategic campaign design.
The hue distribution for three distinct product categories—men's apparel, cosmetics, and children's playthings—is depicted in Figure 5, sampled at various points. It is inferred from the data that the hue spectrum for men's attire spans from 0.072 to 0.079. The restricted range implies a more consistent hue profile for this product type. A relatively subdued average hue is discerned, mirroring the predilection for muted, understated shades in men's fashion. The absence of discernable anomalies or extremes bolsters the notion of a consistent brand persona.
In contrast, cosmetics exhibit a hue range of 0.08 to 0.089, suggesting a more variegated color palette in cosmetic imagery. An elevated average hue, potentially linked to the utilization of vibrant shades to captivate a female audience, is identified. Certain data points, notably Points 5 and 6, are characterized by marginally augmented hue values, possibly indicative of specific promotional campaigns or seasonal offerings.
Lastly, children's toys manifest the broadest hue spectrum, ranging from 0.085 to 0.097. This expansive range signifies the incorporation of diverse, vivacious colors, a strategy employed to engage youthful audiences. The predominant hue for such products leans toward the higher end, aligning with the trend of leveraging vivid hues to capture children's fascination. Variations in hue within this category might be attributed to inherent color disparities between subcategories, such as educational versus recreational toys.
Figure 6. Relationship between product image hue and product color temperature
Figure 6 delineates the average hues and their affiliated image color temperatures for three distinct product categories: men's attire, cosmetics, and children's playthings.
For men's clothing, a hue range of 0.072 to 0.079 and a color temperature spectrum of 0.6 to 1.68 were identified. An overt linear relationship between hue and color temperature for this product category was not observed. Interestingly, a hue peak of 0.078 was found to correspond with the nadir of the color temperature, a value of 0.6. This suggests that particular hues might correlate with color temperatures in men's apparel to impart specific emotional or stylistic undertones.
In the domain of cosmetics, the hue extends between 0.079 and 0.0845, with the color temperature ranging from 4.5 to 6.2. Although a straightforward linear correlation between the two parameters remains elusive, an intriguing pattern was discerned. Cosmetic images with diminished hues were consistently associated with lower color temperatures, whereas those with enhanced hues corresponded to elevated temperatures. Such a relationship could underline the practice of utilizing color temperatures in cosmetic visuals to accentuate product texture and aesthetic.
Lastly, children's toys exhibited a hue span from 0.0845 to 0.0965 and a color temperature range of 5.8 to 8.8. In this sector, a positive correlation was perceived; as hue values ascended, color temperatures followed suit. This relationship could resonate with the industry's proclivity to employ augmented hues and color temperatures in children’s toys, aiming to engender a vivacious and captivating visual appeal.
Table 1. Impact of sliding window step size on DLSS feature extraction performance
|
Step Size of Sliding Window |
Indexes |
|||
|
Detection Rate |
False Alarm Rate |
Overall Accuracy |
AUC |
|
|
2 |
0.9512 |
0.7312 |
0.7951 |
0.7649 |
|
4 |
0.9546 |
0.6821 |
0.7826 |
0.7892 |
|
8 |
0.9528 |
0.6759 |
0.7862 |
0.7813 |
|
12 |
0.9713 |
0.7924 |
0.7763 |
0.7239 |
Table 1 offers an in-depth examination of the repercussions of varying sliding window step sizes on DLSS feature extraction performance across product images. Parameters considered include detection rate, false alarm rate, overall accuracy, and Area Under Curve (AUC) value.
An initial mild augmentation in the detection rate was noted as the step size increased, culminating in a pronounced surge at a step size of 12. This trend suggests that expansive step sizes might be adept at encapsulating global features, thus enhancing detection proficiency. In parallel, the false alarm rate was observed to decrease progressively from step sizes 2 to 8. However, an uptick was recorded at a step size of 12, indicating potential oversaturation of background noise. Concerning overall accuracy, a marginal variation was perceived from step sizes 2 to 8, with a slight decline at a step size of 12. This behavior intimates that while moderate step sizes negligibly affect overall accuracy, an excessively large size could be detrimental. The AUC value exhibited an increase between step sizes 2 and 4, a minor dip at 8, and a descent at 12. This pattern underscores the assertion that diminutive step sizes might be deficient in capturing comprehensive product attributes, whereas larger sizes risk integrating excessive background details.
Given the observed trends, a step size of 8 is postulated to be optimal, harmonizing detection and false alarm rates while preserving high overall accuracy and AUC value. The choice of an apt step size emerges as a pivotal determinant in DLSS feature extraction and merits meticulous calibration based on the nature of product images and the desired application context.
Table 2. Impact of sliding window edge length on DLSS feature extraction performance
|
Edge Length of Sliding Window |
Indexes |
|||
|
Detection Rate |
False Alarm Rate |
Overall Accuracy |
AUC |
|
|
8 |
0.9635 |
0.7785 |
0.7745 |
0.7415 |
|
12 |
0.9562 |
0.5961 |
0.7316 |
0.7366 |
|
16 |
0.9588 |
0.6741 |
0.7862 |
0.7854 |
|
20 |
0.9533 |
0.5623 |
0.7316 |
0.8312 |
|
24 |
0.9521 |
0.6782 |
0.7819 |
0.7789 |
|
28 |
0.9536 |
0.6615 |
0.8122 |
0.7815 |
|
32 |
0.9587 |
0.7416 |
0.7995 |
0.7526 |
|
36 |
0.9521 |
0.6783 |
0.7842 |
0.7892 |
Table 2 dissects the ramifications of diverse sliding window edge lengths on the DLSS feature extraction efficiency within product imagery. Throughout the surveyed range, the detection rate was found to exhibit minor fluctuations, underscoring a broad stability and suggesting that edge length might not critically determine feature capture capability. On the other hand, the false alarm rate showed a decrease from edge lengths 8 to 20. A subsequent phase of fluctuation was noted from 20 to 32, after which an upswing was detected. This pattern indicates that modest edge lengths might engender false alarms, with the nadir reached at an edge length of 20. Of significance is the overall accuracy, which peaked at an edge length of 28, hinting at an optimal edge length that balances feature capture and noise introduction. The AUC value, too, was seen to ascend, reaching its zenith at an edge length of 20, and then tracing a descent with further elongation, inferring that an edge length in this vicinity most effectively optimizes classifier performance.
Drawing from these observations, edge lengths of 20 and 28 are postulated to be paramount in this scenario—the former excelling in AUC and the latter in overall accuracy. Minimal edge lengths seemingly limit feature extraction, spiking the false alarm rate, whereas overly expansive lengths might incorporate extraneous data, curtailing accuracy.
Table 3. Impact of number of dictionary centers on DLSS feature extraction performance
|
Number of Centers |
Indexes |
|||
|
Detection Rate |
False Alarm Rate |
Overall Accuracy |
AUC |
|
|
500 |
0.9615 |
0.6519 |
0.8145 |
0.8169 |
|
750 |
0.9548 |
0.5862 |
0.8219 |
0.8269 |
|
1,000 |
0.9562 |
0.5963 |
0.8344 |
0.8314 |
|
1,250 |
0.9542 |
0.5846 |
0.8269 |
0.8379 |
|
1,500 |
0.9423 |
0.5846 |
0.8231 |
0.8451 |
|
1,750 |
0.9481 |
0.5961 |
0.8297 |
0.8216 |
|
2,000 |
0.9567 |
0.6155 |
0.8156 |
0.8177 |
Table 3 elucidates the implications of varying dictionary center counts on DLSS feature extraction efficiency in product illustrations. As the center count was augmented from 500 to 1,000, the detection rate was observed to maintain relative stability. An ensuing decline was recorded at 1,500 centers, followed by a marginal recovery. This suggests that detection rate augmentation reaches a saturation point within a specific center count range, and excessive centers might impede performance. The false alarm rate, upon analysis, appeared to oscillate with center count increase, but without manifesting a discernible trend, leading to the conclusion that center count might not be a pivotal determinant of this metric. A noteworthy observation pertains to overall accuracy, which culminated at a center count of 1,000, post which a decline was recorded. The AUC value exhibited a trend of ascent, peaking at 1,500 centers, followed by a subtle decline, hinting at classifier performance optimization within this range but with potential overfitting beyond.
Interpreting this data suggests a balancing act: a center count neither too sparse nor too dense optimizes feature extraction. Within this dataset, the equilibrium seems to lie between 1,000 and 1,500 centers. An inadequate center count might overlook critical data, while an overabundance might incorporate noise, adversely affecting performance.
The number of pyramid layers, integral to image processing and feature extraction, delineates the hierarchical structure of the spatial pyramid. Within the purview of DLSS feature extraction, the performance impact of these layers was rigorously assessed. From the insights derived from the Table 4, it was observed that the detection rate was augmented for pyramid layers numbered at 1 and 4. However, a decline was registered at three layers. Such a trend suggests that feature discriminability can be amplified when layer count escalates within certain bounds, but surfeit layers might infuse redundant data.
Table 4. Impact of number of pyramid layers on DLSS feature extraction performance
|
Number of Pyramid Layers |
Indexes |
|||
|
Detection Rate |
False Alarm Rate |
Overall Accuracy |
AUC |
|
|
1 |
0.9615 |
0.7789 |
0.7746 |
0.7218 |
|
2 |
0.9566 |
0.6651 |
0.8125 |
0.7895 |
|
3 |
0.9314 |
0.5896 |
0.8239 |
0.8452 |
|
4 |
0.9568 |
0.5523 |
0.8319 |
0.8426 |
It was further noted that the false alarm rate showed a general decline with an upswing in layer count. Such a pattern implies an enhancement in feature accuracy with additional layers, thus mitigating false positives. A distinct observation was the overall accuracy metric, which escalated with increasing layers and peaked at four layers. This phenomenon indicates that a multi-layer spatial pyramid potentially harnesses a richer spectrum of spatial data, refining classification accuracy. Concomitantly, the AUC value displayed a similar upward trajectory with layer augmentation, corroborating that classifier performance was potentiated by an expanded layer framework. This further reinforces the assertion that layer incrementation amplifies the delineation potential of features.
Drawing upon these inferences, it becomes palpable that pyramid layering profoundly impacts DLSS feature extraction efficacy. Typically, feature discriminability and precision are bolstered by layer augmentation. Yet, a judicious layer count selection remains imperative, as excessiveness can sow complexities and superfluous data, potentially undermining performance.
The experimental outcomes elucidated herein attest to the multifaceted influences on DLSS feature extraction in product imagery, encompassing parameters such as sliding window step size, edge length, dictionary center count, and pyramid layering. Optimization of these parameters is contingent on task specificity and dataset characteristics, often necessitating a careful balance between accuracy, computational speed, complexity, and overfitting susceptibility. For nuanced product imagery and distinct commercial contexts, targeted experimentation and validation might be indispensable, given the improbable existence of a universally optimal setting. Through meticulous parameter tuning, DLSS feature extraction techniques might emerge as pivotal tools in product image analysis, potentially amplifying the efficacy of product recommendations and categorizations.
The relationship between the chromatic properties of product images on digital commerce platforms and their consequent sales volumes served as the focal point of the present investigation. Advanced machine learning techniques were employed to distill color attributes from these images. Concurrently, the study shed light on target shape attributes within product images on e-commerce platforms. This was achieved by integrating the DLSS feature extraction algorithm with the SPM algorithm. Evaluations on the influence of varied parameters on the efficacy of feature extraction were systematically undertaken through a series of experiments.
In the RGB color space, the red component of the product images was meticulously analyzed. The hue distributions of three distinct product types at specific sample points were depicted, elucidating the mean hues and affiliated image color temperatures. A comprehensive analysis was then undertaken.
It was discerned that the DLSS feature extraction's performance in product imagery is modulated by a constellation of factors. These encompass the sliding window's step size and edge length, the tally of dictionary centers, and the depth of pyramid layers. A notable inverse relationship was identified between step size and the false alarm rate, yet its influence on detection rate and holistic accuracy presented complexities. Edge length determination, pivotal for discerning objects of varied magnitudes, demands bespoke tailoring for unique tasks. Amplifying the dictionary center count typically augments accuracy, but the perils of overfitting were underscored. The stratification of pyramid layers emerged as a tool to bolster feature discriminability; however, surfeit layers might inject redundancy.
The methodology delineated in this research avails a robust instrument for the extraction and comprehension of product image features. However, the selection of apt parameters necessitates a delicate equilibrium between intricacy and efficiency. The particularities of product imagery and commercial contexts might dictate tailored parameter fine-tuning. Through judicious parameter adjustments and optimizations, the technology elucidated herein holds promise for pragmatic applications, potentially enhancing product recommendation, categorization, and analytical pursuits.
[1] Kubal, R., Vernekar, S., Cabral, F., Leitao, F., Fernandes, S., Padiyar, P. (2021). Augmented reality based online shopping. In 2021 IEEE Bombay Section Signature Conference, IBSSC 2021. Gwalior, India. https://doi.org/10.1109/IBSSC53889.2021.9673423
[2] Wang, M., Li, X., Chau, P.Y. (2021). Leveraging image-processing techniques for empirical research: Feasibility and reliability in online shopping context. Information Systems Frontiers, 23: 607-626. https://doi.org/10.1007/s10796-020-09981-8
[3] Kangeswaran, V., Vasandarai, D., Eliyas, C., Munsil, M.M.M., Kodagoda, N., Suriyawansa, K. (2021). A bilingual audio based online shopping mobile application for visually impaired and the elderly people. In TENCON 2021-2021 IEEE Region 10 Conference (TENCON), Auckland, New Zealand, pp. 658-663. https://doi.org/10.1109/TENCON54134.2021.9707245
[4] Mousavi, R., Hazarika, B., Chen, K., Razi, M. (2021). The effect of online q & as and product reviews on product performance metrics: Amazon. com as a case study. Journal of Information & Knowledge Management, 20(01): 2150005. https://doi.org/10.1142/S0219649221500052
[5] Baltescu, P., Chen, H., Pancha, N., Zhai, A., Leskovec, J., Rosenberg, C. (2022). ItemSage: Learning product embeddings for shopping recommendations at pinterest. In Proceedings of the 28th ACM SIGKDD Conference on Knowledge Discovery and Data Mining, Washington DC USA, pp. 2703-2711. https://doi.org/10.1145/3534678.3539170
[6] Wang, R., Chen, Z., Zhang, M.R., Li, Z., Liu, Z., Dang, Z., Chen, X.A. (2021). Revamp: Enhancing accessible information seeking experience of online shopping for blind or low vision users. In Proceedings of the 2021 CHI Conference on Human Factors in Computing Systems, Yokohama Japan, pp. 1-14. https://doi.org/10.1145/3411764.3445547
[7] Lodkaew, T., Supsohmboon, W., Pasupa, K., Loo, C.K. (2018). Fashion finder: A system for locating online stores on instagram from product images. In 2018 10th International Conference on Information Technology and Electrical Engineering (ICITEE), Bali, Indonesia, pp. 500-505. https://doi.org/10.1109/ICITEED.2018.8534871
[8] Ryu, S., Ryu, S. (2021). Feeling excited and fluent: How consumers respond to the visual appeals of products in an online shopping environment. Behaviour & Information Technology, 40(11): 1219-1233. https://doi.org/10.1080/0144929X.2021.1942989
[9] Zhang, Y., Wei, Z. (2022). An image classification and retrieval algorithm for product display in E-commerce transactions. Traitement du Signal, 39(5): 1865-1871. https://doi.org/10.18280/ts.390547
[10] Kato, T. (2021). Factors of loyalty across corporate brand images, products, dealers, sales staff, and after-sales services in the automotive industry. Procedia Computer Science, 192: 1411-1421. https://doi.org/10.1016/j.procs.2021.08.144
[11] Agost, M.J., Vergara, M., Bayarri, V. (2021). The use of new presentation technologies in electronic sales environments and their influence on product perception. In International Conference on Human-Computer Interaction, pp. 3-15. https://doi.org/10.1007/978-3-030-78321-1_1
[12] Sharma, S., Ahemad, F. (2022). Unposed: Unsupervised pose estimation based product image recommendations. In Proceedings of the Second International Conference on AI-ML Systems pp. 1-8. https://doi.org/10.1145/3564121.3564126
[13] Zhang, M., Wu, Y., Zhou, X. (2022). Analysis of the influencing factors of urban sports brand sales volume based on AHP. Mathematical Problems in Engineering. 2022: Article ID 9625049, https://doi.org/10.1155/2022/9625049
[14] Naeeni, H.S., Sahin, F., Robinson Jr, E.P. (2023). Socially responsible product-positioning: Impact of halo/horns spillover on product image. European Journal of Operational Research, 308(2): 852-863. https://doi.org/10.1016/j.ejor.2022.11.045
[15] Steeneck, D., Eng-Larsson, F., Jauffred, F. (2022). Estimating lost sales for substitutable products with uncertain on-shelf availability. Manufacturing & Service Operations Management, 24(3): 1578-1594. https://doi.org/10.1287/msom.2021.1015
[16] Ekambaram, V., Manglik, K., Mukherjee, S., Sajja, S.S.K., Dwivedi, S., Raykar, V. (2020). Attention based multi-modal new product sales time-series forecasting. In Proceedings of the 26th ACM SIGKDD International Conference on Knowledge Discovery & Data Mining, USA, pp. 3110-3118. https://doi.org/10.1145/3394486.3403362
[17] Tan, C.H., Lee, V.C., Nghiem, J., Laxman, P. (2023). Compliance analyses of Australia’s online household appliances. In Proceedings of the Sixteenth ACM International Conference on Web Search and Data Mining, Singapore, pp. 1285-1286. https://doi.org/10.1145/3539597.3575788
[18] Sreedhar, R., Tan, N., Zhang, J., Jin, K., Gregson, S., Moreta-Feliz, E., Sadalgi, S. (2022). AIDE: Automatic and accessible image descriptions for review imagery in online retail. In Proceedings of the 19th International Web for All Conference, Lyon France, pp. 1-8. https://doi.org/10.1145/3493612.3520453
[19] Wang, M., Li, X., Chau, P.Y. (2016). The impact of photo aesthetics on online consumer shopping behavior: An image processing-enabled empirical study. In 37th International Conference on Information Systems (ICIS 2016) Proceedings. Association for Information Systems, Atlanta, USA, pp. 1005-1016.
[20] Kamollimsakul, S. (2018). Effect of product presentation formats on thai online consumers' performance, preference, and predicted product price. In Proceedings of the 2nd International Conference on Business and Information Management, Barcelona, Spain, pp. 57-63. https://doi.org/10.1145/3278252.3278274
[21] Wang, Q., Yang, L., Wang, J., Krishnan, J., Dai, B., Wang, S., Ma, H. (2022). SMARTAVE: Structured multimodal transformer for product attribute value extraction. In Findings of the Association for Computational Linguistics: EMNLP 2022, pp. 263-276. https://doi.org/10.18653/v1/2022.findings-emnlp.20
[22] Salman, I.B.R., Varaprasad, G. (2023). Product recommendation system using deep learning techniques: CNN and NLP. In International Conference on Data Management, Analytics & Innovation, pp. 331-343. https://doi.org/10.1007/978-981-99-1414-2_25