Ahmed A. Fadhel*![]() | Hamid M. Hasan
| Hamid M. Hasan![]()
© 2023 IIETA. This article is published by IIETA and is licensed under the CC BY 4.0 license (http://creativecommons.org/licenses/by/4.0/).
OPEN ACCESS
The automatic classification of ECG signals, also known as computer-based classification, has become critically important in the diagnostic landscape of E-health. This study presents an innovative approach that employs Gaussian Modeling to enhance the accuracy of Beat signal approximation prior to training and classification. Previous methodologies largely relied on Artificial Intelligence (AI) and were contingent on the quality of collected field data sets, which often contained numerous artifacts and noise. This study demonstrates that addressing and eliminating these issues before training can significantly improve classification outcomes. The performance of the proposed approach was rigorously evaluated through several classifiers, including Support Vector Machine (SVM), Decision Trees (DT), K-Nearest Neighbours (KNN), Random Forest (RF), Naive Bayes (NB), Quadratic Discriminant Analysis (QDL), and Convolutional Neural Networks (CNN). These classifiers were applied to the MIT-BIH arrhythmia database, revealing a significant enhancement in results compared to conventional methods. Our findings underscore the efficacy of the Gaussian function in modeling ECG signals, improving the accuracy of various classifiers. Remarkable levels of accuracy, sensitivity, and specificity were achieved across classifiers, with some reaching an accuracy rate of 100%. Notably, the CNN classifier exhibited exceptional performance, demonstrating an accuracy rate of 99.65%, sensitivity of 99.64%, and specificity of 99.88%. This study contributes to the ongoing efforts in the E-health domain to improve diagnostic procedures through AI, offering a significant advancement in ECG signal classification.
ECG classification, healthcare system, ECG modeling, Gaussian function, arrhythmia, computer aided detection, deep learning, machine learning
1.1 Motivation
The significance of early detection of cardiac conditions via electrocardiogram (ECG) readings is paramount in mitigating the risk of sudden cardiac death [1]. The burgeoning field of computer-aided diagnostics, particularly in bioinformatics and healthcare, holds significant promise for the classification of heart conditions. ECGs, which visually represent the electrical impulses generated by the heart, serve as crucial indicators of potential heart abnormalities [2]. The non-invasive and cost-effective nature of ECGs, combined with their ability to detect a vast array of cardiovascular diseases (CVDs) - inclusive of arrhythmias and heart attacks - renders them an indispensable tool in cardiac diagnostics [3].
However, the inherent complexity, noise, and rapid variability of ECG signals pose substantial challenges to disease identification and arrhythmia detection. The measured electric potential can be influenced by individual variability and electrode positioning, which may further complicate the interpretation process. Moreover, human error and subjective uncertainty can inadvertently creep into signal interpretation, which necessitates expertise. The accuracy and efficiency of ECG analysis can be notably improved through computer-aided analysis. Traditional intelligent algorithms for ECG interpretation typically involve a three-step process encompassing data preprocessing, feature extraction, and classification. The ultimate goal is to develop algorithms that are robust, efficient, and highly accurate, thereby reducing the burden on healthcare providers and aiding in the prevention of cardiac death [4].
1.2 Related works
The application of Artificial Intelligence-Neural Networks algorithms in ECG analysis and the classification of its various abnormalities have been a subject of extensive research [5, 6]. The use of wavelet packet decomposition (WPD) to analyze ECG signals was demonstrated by Li and Zhou [6], wherein the decomposition coefficients were utilised to calculate entropy, serving as representative features for model development using a Random Forests (RF) classifier. Discrete Wavelet Transform (DWT) was employed for feature extraction, followed by the use of a Support Vector Machines (SVM) classifier for arrhythmia beat categorization, as discussed in study [7]. Sahay et al. [8] used the Pan Tompkins (PT) algorithm for feature extraction and a feed-forward Neural Network (FFNN) with Particle Swarm Optimization (PSO) for classifier optimization. Linear Discriminant Analysis (LDA) on DWT coefficients was suggested as an ECG classifier by Martis et al. [9]. Seera et al. [10] proposed a Decision Trees (DT), Naive Bayes (NB), and RF as ECG classifiers after preprocessing the signal. Four techniques were employed to analyze the features extracted from ECG signals presented by authors [11], these included an Ensemble Support Vector Machine (ESVM) Classifier, RF Classifier, the K-Nearest Neighbors (KNN) Classifier, and a Long Short Term Memory (LSTM) network.
Deep learning, a computer-assisted technique known for its exceptional feature extraction abilities, has been found to classify ECG signals with remarkable precision [12]. ECG signals, being one-dimensional, can be directly input into a one-dimensional convolutional neural network (1D-CNN) [13] or transformed into an image for analysis through a two-dimensional CNN. Moreover, ECG signals are often analysed as time-series signals via a Recurrent neural network (RNN). This deep learning-ECG signal correlation illuminates the potential for advanced analysis and accurate results in cardiac diagnostics [12]. A 1D-CNN-based classification method for classifying ECG arrhythmias post ECG signal preprocessing through DWT was presented by Slama et al. [14]. Yıldırım et al. [15] presented a CNN-based approach to ECG arrhythmia classification, and then employed it to enhance classification accuracy by combining SVM.
Liu et al. [16] employed a CNN to classify arrhythmias for 10-second ECG signal segments. In study of Acharya et al. [17], a 9-layer deep CNN was used to accurately identify various types of arrhythmias in ECG signals through automated detection. Asgharzadeh-Bonab et al. [18] proposed that a two-directional two-dimensional principal component analysis (2D2PCA) can be used to reduce the dimensionality of the extracted features. After this reduction, a convolutional neural network can be used to classify the ECG beat signals into different arrhythmias. An automatic ECG classification approach based on Continuous Wavelet Transform (CWT) and Convolutional Neural Network was proposed in study of Wang et al. [19]. Wang et al. [20] suggested a method for automatically classifying ECG heartbeats that consists of a 33-layer CNN architecture followed by a non-local convolutional block attention module (NCBAM). Convolutional neural networks and long short-term memories (LSTM) are combined in studies [21, 22] to offer an automated approach for classifying various arrhythmia types. To represent the ECG signal clearly and accurately classify it, a model was developed. Billah et al. [23] demonstrated in their research that 16 Gaussian functions were used to represent the ECG beat. In contrast, Awal et al. [24] created a simplified ECG model that accurately simulates the ECG shape in different cardiac dysrhythmias using minimal parameters. They recommended using 7 Gaussian functions to model an ECG beat. In this study, after pre-processing, the proposed method employs 5 Gaussian functions to model the ECG signal, removing noise and artifacts, resulting in smoother signals and enabling more precise classification. The approach was evaluated using various classifiers with the MIT-BIH arrhythmia database.
1.3 Contribution
Identifying diseases and arrhythmias from ECG signals is a challenging task due to the complexity and noise present in the signals. This challenge is amplified when using wearable devices to measure ECGs because it becomes more challenging to separate the ECG signal from muscle noise and other artifacts that have similar frequency spectra. Consequently, accurately analysing ECG recordings obtained through mobile devices, poses a significant challenge [4]. To address this issue, this study aimed to improve ECG signal classification by modeling the signal using Gaussian function. This approach effectively removes noise, sharp changes, and other artifacts in the ECG signals, resulting in a smoother signal that can be classified with higher accuracy [25]. The use of the Gaussian Modeling method provided a more accurate representation of the ECG signals and effectively reduced the impact of noise and artifacts on the classification process. the accuracy of ECG signal classification is significantly increased, making the process of identifying diseases and arrhythmias more efficient.
In this study, the performance of the proposed method was evaluated using five arrhythmias from the MIT-BIT dataset, which is widely used for testing ECG beat classification methods [4]. The results showed that the proposed method achieved better separation between different types of ECG signals and outperformed recent methods in ECG beat classification.
2.1 Overview
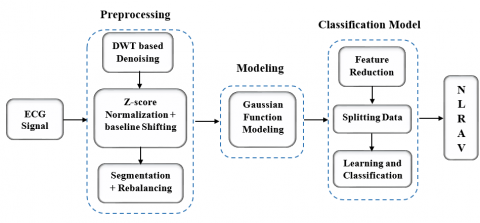
A specific process and methodology must be followed for each classification system. Figure 1 displays the framework and key steps for the proposed method for categorizing the five distinct heart rhythm disorders. The operations were conducted using the Python programming language on a computer with a 2.9GHz Intel(R) Core i7 processor, 16GB of RAM, and a 4GB GPU. The first stage is the preprocessing stage, which consists of three procedures: de-noising, Z-score normalization, and base line shifting. The purpose of this stage is to clean and standardize the ECG signal. The second stage is the segmentation process, which involves dividing the ECG signal into periodic beats. This allows for individual analysis of each beat. The third stage is Modeling the ECG beats using a Gaussian function. This provides a mathematical representation of the shape of each beat. The fourth stage is featuring reduction and data separation. In this stage, the relevant features are selected and the data is split into two sets, a training set and a testing set. Finally, a model for classification is built using the training set.
Figure 1. The proposed method’s workflow
2.2 Data collection
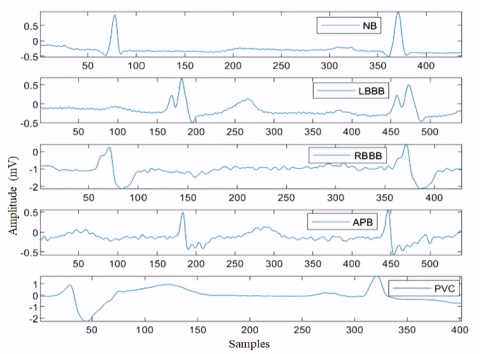
The Massachusetts Institute of Technology (MIT-BIH) arrhythmia database was utilized in this study to evaluate its usefulness as an open-source ECG database [26]. The database includes ECG recordings from 48 individuals, each lasting 30 minutes with 360Hz sampling rate, with 25 of them showing severe arrhythmias and the remaining 23 being healthy individuals [4, 27]. Each record in this dataset has an annotation file that includes the beat class information and R-peak occurrence time. The database contains annotations for various types of rhythmic and morphological arrhythmias and its primary goal is to detect irregularities in individual heartbeats. The data used in this study was extracted from the database and consists of Normal Sinus Rhythm beats (NB), Left Bundle Branch Block beats (LBBB), Atrial Premature Contraction beats (APC), Right Bundle Branch Block beats (RBBB), and Premature Ventricular Contraction beats (PVC) [22, 27]. Table 1 demonstrate the number of beats in each class and the record number that contains them. Figure 2 shows the five types of arrhythmias.
Table 1. Beats type and their records in the MIT-BIH DS
|
Type of Beat |
Number of Beat |
Record Name |
|
NB (N) |
79810 |
100, 101, 102, 103, 104, 107,112, 113, 114, 115, 117, 121, 122, 123, 202, 210, 213, 215, 219, 221, 223, 230, 234 |
|
LBBB (L) |
8534 |
105, 108, 109, 111, 207, 214 |
|
RBBB (R) |
7540 |
118, 124, 205, 212, 231 |
|
APB (A) |
1556 |
209, 220, 222, 232 |
|
PVC(V) |
2572 |
106, 116, 119, 200, 201, 203, 208, 217, 228, 233 |
Figure 2. Types of arrhythmia NB, LBBB, RBBB, APB and PVC respectively
2.3 Pre-processing
Pre-processing is an essential step in ECG signal analysis. During the acquisition of ECG signals, noise is inevitably captured along with the original signal, significantly impacting the quality and classification of the ECG. Various factors such as environmental conditions, circumstances, and AC power fluctuations during signal recording contribute to the presence of noisy ECG signals. To address this issue, preprocessing techniques are applied to remove baseline wander, motion artifacts, and other interruptions from the original recorded signal. One commonly used method for noise removal is the Discrete Wavelet Transform (DWT), a mathematical tool that identifies and eliminates noise from the ECG signal [28-30]. It involves creating a set of different wavelets from a single basic wavelet, known as the mother wavelet, denoted by ψ. The DWT family is given by the Eq. (1) [10].
$\psi_{m, n}(\mathrm{x})=a^{-\frac{m}{2}} \psi\left(a^{-m} \cdot x-n\right)$ (1)
where, (m) and (n) are integers that serve as indices and (a) represents a scaling factor for the wavelet. Given a function f(x), the inner product (f, ψ m, n) can be used to obtain the discrete wavelet transform [10], which is given by the Eq. (2).
$\operatorname{DWT}(\mathrm{m}, \mathrm{n})=(f, \Psi)=a^{-\frac{m}{2}} \sum_1^n {f}(x) \cdot \psi\left(a^{-m} \cdot x-n\right)$ (2)
For ECG signal processing, the Daubechies 6 (db6) mother wavelet is commonly employed [10, 18, 19] due to its smoothness, which is advantageous for signals with sharp transitions. The low-frequency sub-bands responsible for baseline shifting are then eliminated, and the clean ECG signal is reconstructed using the inverse DWT [6].
The Z-score normalization formula is used to standardize the ECG signal amplitude and eliminate the offset effect in the input data [11]. It is done by subtracting the mean of the heartbeats (μ) from each heartbeat sample (x(i)) and then dividing the result by the standard deviation (σ) of the heartbeats. Expressed as in Eq. (3) [11].
$Z(\mathrm{i})=\frac{(\mathrm{x}(\mathrm{i})-\mu)}{\sigma}$ (3)
This technique squeezes the range of values in the raw data to a smaller range, which improves the gradient flow in the neural network during training. As a result, the convergence rate is increased, and the training process is accelerated. To shift the baseline of an ECG signal to zero, it is necessary to subtract the average value of the ECG signal from the entire signal. This will result in the baseline being shifted to zero, which makes it simpler to identify any changes in the signal and compare different ECG recordings.
2.4 Data segmentation
The electrocardiogram signal is a continuous representation of the electrical activity of the heart over time. However, to analyse and extract relevant features from the signal, it is necessary to segment it into individual beats, which correspond to different events in the cardiac cycle. This is because machine learning algorithms typically operate on a beat-by-beat basis [4], enabling more accurate analysis and interpretation of the ECG signal. There are two main methods for separating the ECG signal into its individual beats [28]. The first approach involves using the annotation file provided by a specialized physician, while the second method involves locating the QRS complex and determining the duration of each beat. In this study, the first method was utilized and identified five types of arrhythmias, as shown in Table 1, which provides the primary information for this work.
After detecting the R-peaks, 360 samples (180 before and 180 after each R-peak) were extracted for each beat. These individual beat segments provide valuable information on heart function, such as the duration of the QRS complex, ST segment amplitude, and heart rate. Segmentation allows for focused analysis, essential for diagnosing and monitoring cardiac conditions.
To ensure a balanced training dataset, a resampling strategy was employed for Table 1, which had an unequal number of beats per class. Random selection of 10,000 beats per class resulted in a total of 50,000 beats. Out of these, 40,000 were used for training and 10,000 for testing, providing a representative sample from each class and ensuring accurate and unbiased model performance analysis.
2.5 Modeling ECG signal
The analysis of ECG signals poses a significant challenge due to the presence of a large amount of noise that can obscure the underlying signal. This noise can arise from a variety of sources such as muscle activity, electrical interference, and baseline drift, and can make it difficult to accurately diagnose cardiovascular diseases. Furthermore, the large size and complexity of ECG data further compound these challenges.
To address these issues, this study developed a model for the ECG signal using a Gaussian function. The P, Q, R, S, and T waves of an ECG beat were utilized as they exhibit a Gaussian-like shape, and a small set of Gaussian parameters were derived for modeling purposes [24]. Therefore, the Gaussian function is considered the appropriate method for modeling an ECG beat [24]. The standard Gaussian function, as defined in Eq. (4), was used to model the ECG signal. The waveform obtained from this function is depicted in Figure 3. The initial guesses for the height (a), position (µ), and standard deviation (σ) are required to be provided in order to perform the modeling using the Levenberg-Marquardt algorithm [31]. This algorithm determines the optimal-fit parameters for the curve by minimizing the sum of the squared residuals between predicted and actual values. To implement this technique, the curve fit function from the Scipy package in Python can be employed [32-34].
$G(x)=a e^{\frac{-(x-\mu)^2}{2 \sigma^2}}$ (4)
Figure 3. Gaussian curves with expected value μ and variance σ2 [35]
In This study, The ECG beat signal was modeled using the summation of five Gaussian functions [23], which is given by the Eq. (5).
ECGmodel $=\sum_{n=1}^5 a e^{\frac{-(x-\mu)^2}{2 \sigma^2}}$ (5)
Each beat return 15 optimal parameters, which can be used to reconstruct the ECG signal and remove noise. The compression of ECG signals in this way resulted in a reduction in data size, facilitating the transmission, storage, and analysis of large amounts of ECG data [36]. This approach overcomes the challenges of noise in ECG analysis and has implications for improved diagnosis and management of cardiovascular diseases. The proposed algorithm was applied to model ECG beats for the five classes, and their model fitting using five Gaussian functions is shown in Figure 4.
Figure 4. Model fitting of the five ECG classes
To evaluate the performance of the proposed algorithm, the Root Mean Square (RMS) error value was calculated for each class of ECG beats using Eq. (6). The RMS error measures the difference between the ECG model predicted by the Gaussian function and the real ECG signal. The results indicated that the algorithm accurately modeled the ECG signal, with low RMS error values across all classes as presented in Table 2.
RMS $=\sqrt[2]{\frac{1}{n} \sum_1^n(\text { ECG real }- \text { ECG model })^2}$ (6)
Table 2. RMS per ECG class type
|
Class type |
NB |
LBBB |
RBBB |
APB |
PVC |
|
RMS |
0.017 |
0.007 |
0.031 |
0.076 |
0.018 |
2.6 Feature reduction
The ECG signal is represented by a high number of samples (360 per beat) that include many points that do not correspond to the relevant P, Q, R, S, and T waves, and may introduce redundancy, leading to confusion in the classification process. This can negatively impact the accuracy of the model and increase compilation time. To improve accuracy and reduce classification time, it is crucial to identify and eliminate ECG features that do not correlate with the target class. Numerous research studies have employed Principle Component Analysis (PCA) to decrease the number of features in the features vector. However, it has been observed that classification accuracy is better without PCA, indicating that using PCA to reduce the number of features does not yield optimal results [28].
The analysis of variance (ANOVA) is a commonly used statistical technique for determining whether there is a significant difference in means between two groups [37, 38]. It can also be utilized as a method of feature selection [39, 40]. In this study, the ANOVA test was utilized to identify the significant numerical features that can predict the related class. To achieve this, the ANOVA test uses the F statistic to rank the features, where a larger F value indicates a better discriminative capacity of the feature. The F value is computed using Eq. (7), which involves the sum of squares between groups (SSB) and the sum of squares within groups (SSW), as well as the degrees of freedom for mean square between (dfb) and mean square within (dfw) [41].
$\mathrm{F}=\left(\frac{\mathrm{S S B}}{\mathrm{d f b}}\right) /\left(\frac{\mathrm{S S W}}{\mathrm{d f w}}\right)$ (7)
The F value was calculated for all numerical features in the dataset using Eq. (7), and the features with larger F values were selected as the most correlated with the class type. resulting in a reduction of the total number of features from 360 to 89 for each beat. This selection process helped to identify the most relevant and informative features, which can improve the overall performance of the model by eliminating redundant or irrelevant features and reducing processing time.
2.7 Classification techniques
In this study, we evaluated various classifiers to assess their capability in categorizing beats into different classes. Firstly, we tested the support vector machine (SVM) classifier, which utilizes an optimal hyperplane to separate data into distinct classes. It accomplishes this by transforming input data into a high-dimensional feature space, where it finds a linear or non-linear boundary that distinguishes the different classes. Next, we tested the decision trees (DT) classifier, which is a commonly used machine learning algorithm for classification and regression tasks.
The algorithm constructs a tree-like model of decisions and their potential outcomes based on the input data. Subsequently, we tested the k-nearest neighbours (KNN) classifier, which treats input data as points in a multi-dimensional space. The algorithm identifies the k nearest neighbours of a new input point and assigns the class or value based on the majority of the k neighbours. KNN is a non-parametric algorithm, meaning it does not make assumptions about the underlying distribution of the data.
We also tested the random forest (RF) classifier, which is an ensemble learning algorithm for classification and regression tasks. RF comprises multiple decision trees built using random subsets of the input features and data. The output is determined by taking a majority vote of the individual trees. Additionally, we tested the naive Bayes (NB) classifier, which is a probabilistic machine learning algorithm used for classification tasks. NB assumes that the features are independent of each other, given the class label, which is why it is called "naive." NB calculates the probability of each class for a new input based on the product of the conditional probabilities of each feature given the class label. NB is computationally efficient and can handle large datasets with high-dimensional features.
We also evaluated the Quadratic Discriminant Analysis (QDA) classification algorithm, which is similar to Linear Discriminant Analysis (LDA) but relaxes the assumption of equal covariance matrices across all classes. QDA learns the parameters of a Gaussian distribution for each class, including the mean and covariance matrix, and then uses Bayes' theorem to predict the class of new, unseen data. QDA can capture more complex relationships between input features and class labels compared to LDA.
Finally, we tested the convolutional neural networks (CNNs) classifier, which is a type of deep learning neural network commonly used for image and video processing tasks. CNNs use a convolution operation to extract features from the input data, which are then passed through multiple layers of nonlinear transformations to create a hierarchy of feature representations.
CNNs can also use pooling operations to reduce the dimensionality of the feature maps, which helps to reduce the computational complexity of the network. For one-dimensional input data like ECG beats, a one-dimensional convolutional neural network (1D-CNN) can be directly utilized.
Table 3. Layers detail of the proposed 1D-CNN model
|
NO. |
Layer type |
Kernel size |
Filter |
Other Layer Parameters |
|
1 |
Conv1D |
15 |
32 |
Activation: ReLU |
|
2 |
AvgPool1D |
- |
- |
Pooling Size=3, Strides=2 |
|
3 |
Conv1D |
15 |
32 |
Activation: ReLU |
|
4 |
AvgPool1D |
- |
- |
Pooling Size=3, Strides=2 |
|
5 |
Conv1D |
13 |
64 |
Activation: ReLU |
|
6 |
AvgPool1D |
- |
- |
Pooling Size=3, Strides=2 |
|
7 |
Conv1D |
11 |
128 |
Activation: ReLU |
|
8 |
AvgPool1D |
- |
|
Pooling Size=3, Strides=2 |
|
9 |
Flatten |
- |
- |
512 |
|
10 |
Dropout |
- |
- |
0.4 |
|
11 |
Dense |
- |
- |
128 |
|
12 |
Dense |
- |
- |
64 |
|
13 |
Dense |
- |
- |
32 |
|
14 |
Dense |
- |
- |
Activation: Softmax, 5 |
Our approach used categorical cross entropy as the loss function, Adam as the optimizer, a batch size of 32, a learning rate set at 0.0001, and a total of 90 epochs. The details of the proposed CNN are listed in Table 3, with total parameters of 208,997 to classify five classes ECG beats.
In this study, we tested several ways of classifying ECG signals. We began by pre-processing the ECG data and then extracted relevant features for each beat. We then used these features to build and test various classifiers to determine their ability to classify beats into different categories. The scikit-learn and TensorFlow libraries, which are computational tools in Python, were used for model training and evaluation. The pre-processed ECG data was utilized to build and test various classifiers, which were then trained and evaluated on the extracted data to determine their ability to classify beats into different categories.
The proposed methodology’s performance was evaluated for each category of ECG signal. Based on confusion matrix values, the number of correctly detected and correctly rejected heartbeats for each class, denoted by true positive (TP) and true negative (TN), respectively, is used to evaluate the performance of the proposed technique. Additionally, false positive (FP) and false negative (FN) are indicators of the number of heartbeats that were incorrectly detected and rejected for each class [42]. The proposed method's effectiveness is measured in terms of classification accuracy (Acc), sensitivity (Sens) and specificity (Spec) expressed as in Eq. (8), Eq. (9) and Eq. (10) respectively [14].
$\mathrm{A c c}=\frac{\mathrm{T N+T P}}{\mathrm{T P+T N+F P+F N}}$ (8)
$\mathrm{Sens}=\frac{\mathrm{T P}}{\mathrm{T P+F P}}$ (9)
$\mathrm{Spec}=\frac{\mathrm{T N}}{\mathrm{T N+F P}}$ (10)
The results obtained using the RF classifier, as shown in the confusion matrix depicted in Figure 5, indicate that the classifier has achieved an impressive level of performance, with accuracy, sensitivity, and specificity values of 99.77%, 99.82%, and 99.92%, respectively.
Figure 5. Confusion matrix achieved using RF classifier
Figure 6. Confusion matrix achieved using KNN classifier
Figure 7. Confusion matrix achieved using SVM classifier
According to the confusion matrix presented in Figure 6, the KNN classifier has demonstrated high performance with an accuracy of 99.81%, sensitivity of 99.89%, and specificity of 99.93%.
The confusion matrix shown in Figure 7 indicates that the SVM classifier achieved excellent performance, with accuracy, sensitivity, and specificity all reaching 100%.
The confusion matrix presented in Figure 8 reveals the exceptional performance of the DT method. With 100% accuracy, sensitivity, and specificity, it can be concluded that the DT classifier effectively classified all instances in the dataset without any errors or misclassifications.
Similarly, the NB classifier displayed exceptional performance as indicated by the confusion matrix in Figure 9, with 100% accuracy, sensitivity, and specificity. This suggests that the NB classifier accurately classified all instances in the dataset without any misclassifications.
Furthermore, the QDL classifier exhibited outstanding performance, achieving a perfect score of 100% for accuracy, sensitivity, and specificity, as demonstrated by the confusion matrix in Figure 10. These outcomes highlight the accurate classification of all instances in the dataset by the QDL classifier, without any misclassifications.
Figure 8. Confusion matrix achieved using DT classifier
Figure 9. Confusion matrix achieved using NB classifier
Table 4. Comparison of results obtained from literatures
|
References |
Features |
Classifier |
Accuracy |
Average Time for Beat Classification |
|
Li and Zhou [6] |
WPD |
RF |
94.61% |
- |
|
Venkatesan et al. [7] |
DWT |
SVM |
96.00% |
- |
|
Sahay et al. [8] |
Pan Tompkins algorithm |
PSO+FFNN |
93.61% |
- |
|
Martis et al. [9] |
DWT |
LDA+NN |
98.59% |
- |
|
Seera et al. [10] |
DWT |
DT NB RF |
95.00% 92.90% 96.00% |
- |
|
Pandey et al. [11] |
DWT, HOS+Z-score |
SVM KNN RF LSTM Ensemble SVMs |
90.09% 72.56% 93.45% 92.16% 94.40% |
- |
|
Slama et al. [14] |
DWT |
1D-CNN |
98.05% |
- |
|
Yıldırım et al. [15] |
Rescaling raw data |
CNN |
91.33% |
15ms |
|
Liu et al. [16] |
Segmentation by R position |
CNN+SVM |
91.29% |
- |
|
Acharya et al. [17] |
DWT+Z-score |
CNN |
94.03% |
- |
|
Asgharzadeh-Bonab et al. [18] |
DWT |
CNN+2D2PCA |
98.81% |
- |
|
Wang et al. [19] |
CWT |
CNN |
98.74% |
- |
|
Wang et al. [20] |
Segmentation by R position |
CNN+NCBAM |
98.64% |
- |
|
Oh et al. [21] |
Segmentation by R position+Z-score |
CNN+LSTM |
98.10% |
- |
|
Obeidat and Alqudah [22] |
Pan Tompkins algorithm |
CNN+LSTM |
98.22% |
2.987ms |
|
Proposed method |
DWT+Z-score+Gaussian Model Fitting |
RF KNN SVM DT QDA NB CNN |
99.77% 99.81% 100% 100% 100% 100% 99.65% |
8.132ms 17.961ms 1.213ms 0.182ms 0.921ms 0.973ms 0.167ms |
In the context of utilizing a deep learning approach, a CNN classifier model was trained and tested. The confusion matrix presented in Figure 11 demonstrates that the CNN classifier exhibited an impressive performance, achieving accuracy, sensitivity, and specificity rates of 99.65%, 99.64%, and 99.88%, respectively. These findings indicate that the CNN classifier accurately classified the vast majority of instances in the dataset and achieved a high level of precision and accuracy.
Table 4 presents a thorough comparison of the proposed method with previously reported approaches, identified through an extensive literature review. The comparison encompasses feature extraction techniques, classifier models employed, and the corresponding classification accuracies achieved. The evaluation of these methods was conducted using the MIT-BIH dataset, as documented in the respective research papers. This comprehensive analysis provides valuable insights into the performance and effectiveness of the proposed method in relation to existing approaches.
Figure 10. Confusion matrix achieved using QDL classifier
Figure 11. Confusion matrix achieved using CNN classifier
In this study, ECG signals collected from the MIT-BIH arrhythmia database were processed using a Gaussian Modeling method, where beats were approximated into a five-function Gaussian model with three parameters for each function.
The study's findings demonstrate that the Gaussian function used for modeling the ECG signal proved to be highly effective in improving the accuracy of the classifiers. The results indicated that various classifiers, including RF, KNN, SVM, DT, NB, and QDL, achieved outstanding levels of accuracy, sensitivity, and specificity, with some even reaching 100% accuracy. Additionally, the CNN classifier exhibited impressive accuracy rates of 99.65%, sensitivity of 99.64%, and specificity of 99.88%. These outcomes suggest that the Gaussian function successfully overcame the challenges posed by noise in ECG analysis, enabling the classifiers to extract more relevant features from the data and classify the beats into different categories with exceptional accuracy.
[1] Hasan, T.T., Jasim, M.H., Hashim, I.A. (2018). FPGA design and hardware implementation of heart disease diagnosis system based on NVG-RAM classifier. In 2018 Third Scientific Conference of Electrical Engineering (SCEE) IEEE, pp. 33-38. https://doi.org/10.1109/SCEE.2018.8684125
[2] Berkaya, S.K., Uysal, A.K., Gunal, E.S., Ergin, S., Gunal, S., Gulmezoglu, M.B. (2018). A survey on ECG analysis. Biomedical Signal Processing and Control, 43: 216-235. https://doi.org/10.1016/j.bspc.2018.03.003
[3] Serhani, M.A., El Kassabi, H., Ismail, H., Nujum Navaz, A. (2020). ECG monitoring systems: Review, architecture, processes, and key challenges. Sensors, 20(6): 1796. https://doi.org/10.3390/s20061796
[4] Merdjanovska, E., Rashkovska, A. (2022). Comprehensive survey of computational ECG analysis: Databases, methods and applications. Expert Systems with Applications, 203: 117206. https://doi.org/10.1016/j.eswa.2022.117206
[5] Khan, A.A., Alsadoon, A., Al-Khalisy, S.H., Prasad, P.W.C., Jerew, O.D., Manoranjan, P. (2020). A novel hybrid fall detection technique using body part tracking and acceleration. In 2020 5th International Conference on Innovative Technologies in Intelligent Systems and Industrial Applications (CITISIA). IEEE, pp. 1-8. https://doi.org/10.1109/CITISIA50690.2020.9371850
[6] Li, T., Zhou, M. (2016). ECG classification using wavelet packet entropy and random forests. Entropy, 18(8): 285. https://doi.org/10.3390/e18080285
[7] Venkatesan, C., Karthigaikumar, P., Paul, A., Satheeskumaran, S., Kumar, R. (2018). ECG signal preprocessing and SVM classifier-based abnormality detection in remote healthcare applications. IEEE Access, 6: 9767-9773. https://doi.org/10.1109/ACCESS.2018.2794346
[8] Sahay, S., Wadhwani, A.K., Wadhwani, S., Bhadauria, S.S. (2019). Detection and classification of ECG signal through machine learning. International Journal of Innovative Technology and Exploring Engineering, 8(10): 3221-3227. https://doi.org/10.35940/ijitee.J1165.0881019
[9] Martis, R.J., Acharya, U.R., Min, L.C. (2013). ECG beat classification using PCA, LDA, ICA and discrete wavelet transform. Biomedical Signal Processing and Control, 8(5): 437-448. https://doi.org/10.1016/j.bspc.2013.01.005
[10] Seera, M., Lim, C.P., Liew, W.S., Lim, E., Loo, C.K. (2015). Classification of electrocardiogram and auscultatory blood pressure signals using machine learning models. Expert Systems with Applications, 42(7): 3643-3652. https://doi.org/10.1016/j.eswa.2014.12.023
[11] Pandey, S.K., Janghel, R.R., Vani, V. (2020). Patient specific machine learning models for ECG signal classification. Procedia Computer Science, 167: 2181-2190. https://doi.org/10.1016/j.procs.2020.03.269
[12] Liu, X., Wang, H., Li, Z., Qin, L. (2021). Deep learning in ECG diagnosis: A review. Knowledge-Based Systems, 227: 107187. https://doi.org/10.1016/j.knosys.2021.107187
[13] Lateef, R.A., Abbas, A.R. (2022). Tuning the hyperparameters of the 1D CNN model to improve the performance of human activity recognition. Engineering and Technology Journal, 40(04): 547-554. http://doi.org/10.30684/etj.v40i4.2054
[14] Slama, A.B., Sahli, H., Maalmi, R., Trabelsi, H. (2021). ConvNet: 1D-convolutional neural networks for cardiac arrhythmia recognition using ECG signals. Traitement du Signal, 38(6): 1737-1745. https://doi.org/10.18280/ts.380617
[15] Yıldırım, Ö., Pławiak, P., Tan, R.S., Acharya, U.R. (2018). Arrhythmia detection using deep convolutional neural network with long duration ECG signals. Computers in Biology and Medicine, 102: 411-420. https://doi.org/10.1016/j.compbiomed.2018.09.009
[16] Liu, J., Song, S., Sun, G., Fu, Y. (2019). Classification of ECG arrhythmia using CNN, SVM and LDA. In International Conference on Artificial Intelligence and Security. Cham: Springer International Publishing, pp. 191-201. https://doi.org/10.1007/978-3-030-24265-7_17
[17] Acharya, U.R., Oh, S.L., Hagiwara, Y., Tan, J.H., Adam, M., Gertych, A., San Tan, R. (2017). A deep convolutional neural network model to classify heartbeats. Computers in Biology and Medicine, 89: 389-396. https://doi.org/10.1016/j.compbiomed.2017.08.022
[18] Asgharzadeh-Bonab, A., Amirani, M.C., Mehri, A. (2020). Spectral entropy and deep convolutional neural network for ECG beat classification. Biocybernetics and Biomedical Engineering, 40(2): 691-700. https://doi.org/10.1016/j.bbe.2020.02.004
[19] Wang, T., Lu, C., Sun, Y., Yang, M., Liu, C., Ou, C. (2021). Automatic ECG classification using continuous wavelet transform and convolutional neural network. Entropy, 23(1): 119. https://doi.org/10.3390/e23010119
[20] Wang, J., Qiao, X., Liu, C., Wang, X., Liu, Y., Yao, L., Zhang, H. (2021). Automated ECG classification using a non-local convolutional block attention module. Computer Methods and Programs in Biomedicine, 203: 106006. https://doi.org/10.1016/j.cmpb.2021.106006
[21] Oh, S.L., Ng, E.Y., San Tan, R., Acharya, U.R. (2018). Automated diagnosis of arrhythmia using combination of CNN and LSTM techniques with variable length heart beats. Computers in Biology and Medicine, 102: 278-287. https://doi.org/10.1016/j.compbiomed.2018.06.002
[22] Obeidat, Y., Alqudah, A.M. (2021). A hybrid lightweight 1D CNN-LSTM architecture for automated ECG beat-wise classification. Traitement du Signal, 38(5): 1281-1291. https://doi.org/10.18280/ts.380503
[23] Billah, M.S., Mahmud, T.B., Snigdha, F.S., Arafat, M.A. (2011). A novel method to model ECG beats using Gaussian functions. In 2011 4th International Conference on Biomedical Engineering and Informatics (BMEI). IEEE, 2: 612-616. https://doi.org/10.1109/BMEI.2011.6098409
[24] Awal, M.A., Mostafa, S.S., Ahmad, M., Alahe, M.A., Rashid, M.A., Kouzani, A.Z., Mahmud, M.P. (2021). Design and optimization of ECG modeling for generating different cardiac dysrhythmias. Sensors, 21(5): 1638. https://doi.org/10.3390/s21051638
[25] Roonizi, A.K. (2020). A new approach to Gaussian signal smoothing: Application to ECG components separation. IEEE Signal Processing Letters, 27: 1924-1928. https://doi.org/10.1109/LSP.2020.3031501
[26] PhysioNet. (n.d.). MIT-BIH arrhythmia database v1.0.0. https://physionet.org/content/mitdb/1.0.0/, accessed on Jan. 10, 2023.
[27] Apandi, Z.F.M., Ikeura, R., Hayakawa, S. (2018). Arrhythmia detection using MIT-BIH dataset: A review. In 2018 International Conference on Computational Approach in Smart Systems Design and Applications (ICASSDA). IEEE, pp. 1-5. https://doi.org/10.1109/ICASSDA.2018.8477620
[28] Abdalla, F.Y., Wu, L., Ullah, H., Ren, G., Noor, A., Zhao, Y. (2019). ECG arrhythmia classification using artificial intelligence and nonlinear and nonstationary decomposition. Signal, Image and Video Processing, 13: 1283-129. https://doi.org/10.1007/s11760-019-01479-4
[29] Wasimuddin, M., Elleithy, K., Abuzneid, A.S., Faezipour, M., Abuzaghleh, O. (2020). Stages-based ECG signal analysis from traditional signal processing to machine learning approaches: A survey. IEEE Access, 8: 177782-177803. https://doi.org/10.1109/ACCESS.2020.3026968
[30] Mahdi, J.A. (2018). ECG analysis using DWT and wavelet coefficient to reduce the feature and SVM-ICP for classification and matching. Engineering and Technology Journal, 36(8): 925-929. https://doi.org/10.30684/etj.36.8A.13
[31] Al Bataineh, A., Kaur, D. (2018). A comparative study of different curve fitting algorithms in artificial neural network using housing dataset. In Naecon 2018-IEEE National Aerospace and Electronics Conference, pp. 174-178. https://doi.org/10.1109/NAECON.2018.8556738
[32] Chrobáková, Ž., López-Corredoira, M. (2021). A case against a significant detection of precession in the galactic warp. The Astrophysical Journal, 912(2): 130. https://doi.org/10.3847/1538-4357/abf356
[33] Gardegaront, M., Farlay, D., Peyruchaud, O., Follet, H. (2018). Automation of the peak fitting method in bone FTIR microspectroscopy spectrum analysis: Human and mice bone study. Journal of Spectroscopy, 2018: 1-11. https://doi.org/10.1155/2018/4131029
[34] Tang, Y., Zhou, N., Guan, A. (2021). Anxiety detection algorithm for wearable devices based on dbscan. In 2021 6th International Conference on Intelligent Computing and Signal Processing (ICSP). IEEE, pp. 56-60. https://doi.org/10.1109/ICSP51882.2021.9408868
[35] Normal distribution-wikipedia. https://en.wikipedia.org/wiki/Normal_distribution, accessed on Mar. 04, 2023.
[36] Kundu, P., Gupta, R. (2015). Electrocardiogram synthesis using Gaussian and Fourier models. In 2015 IEEE International Conference on Research in Computational Intelligence and Communication Networks (ICRCICN), pp. 312-317. https://doi.org/10.1109/ICRCICN.2015.7434256
[37] Kim, H.Y. (2014). Analysis of variance (ANOVA) comparing means of more than two groups. Restorative Dentistry & Endodontics, 39(1): 74-77. https://doi.org/10.5395/rde.2014.39.1.74
[38] Ding, H., Feng, P.M., Chen, W., Lin, H. (2014). Identification of bacteriophage virion proteins by the ANOVA feature selection and analysis. Molecular BioSystems, 10(8): 2229-2235. https://doi.org/10.1039/c4mb00316k
[39] Bakar, Z.A., Ispawi, D.I., Ibrahim, N.F., Tahir, N.M. (2012). Classification of Parkinson's disease based on multilayer perceptrons (MLPs) neural network and ANOVA as a feature extraction. In 2012 IEEE 8th International Colloquium on Signal Processing and its Applications, pp. 63-67. https://doi.org/10.1109/CSPA.2012.6194692
[40] Sheikhan, M., Bejani, M., Gharavian, D. (2013). Modular neural-SVM scheme for speech emotion recognition using ANOVA feature selection method. Neural Computing and Applications, 23: 215-227. https://doi.org/10.1007/s00521-012-0814-8
[41] Deberneh, H.M., Kim, I. (2021). Prediction of type 2 diabetes based on machine learning algorithm. International Journal of Environmental Research and Public Health, 18(6): 3317. https://doi.org/10.3390/ijerph18063317
[42] Al-Obaidi, A., Alnajjar, S.H., Nsai, M., Sharabaty, H. (2020). Classification of multi heart diseases with android based monitoring system. Iraqi Journal of Computers, Communications, Control and Systems Engineering, 20(2): 14-22. https://doi.org/10.33103/uot.ijccce.20.2.3