Uddagiri Sirisha*![]() | Bolem Sai Chandana
| Bolem Sai Chandana![]() | Jonnadula Harikiran
| Jonnadula Harikiran![]()
© 2023 IIETA. This article is published by IIETA and is licensed under the CC BY 4.0 license (http://creativecommons.org/licenses/by/4.0/).
OPEN ACCESS
Dead animals on the road are very harmful to public health. Because of offensive odours and the potential outspread of diseases, dead animals endanger public health. Existing methods focused on collisions between vehicles and animals on roads, number of animals, protection of crops from animals etc. To solve this issue, two main tasks listed below can be used: (1) Detecting dead animals on the highway and (2) Notification to the appropriate authorities. In this paper, we explore the viability of object detection methods to detect dead animals. We scrutinize and compare various versions of the "YOLO"(you only look once) in detecting dead animals. We compare the performance with the improved YOLOv7 model with the earlier versions when trained on the ADD (Animal Death detection) dataset and results show that improved YOLOv7 performs best when compared to the earlier YOLO models.
dead animals, deep learning, object detection, normalization-based attention module, you only look once architecture
Traffic on the roads is becoming more congested as the population grows. When the animals try to cross the roads on a traffic road it results in animal vehicle collisions. As a result, animals are decreasing, which lead to animal accidents. Human deaths and animal deaths have both increased dramatically in recent years.
Animals are especially vulnerable to natural disasters such as earthquakes, floods, thunderstorms, heavy rainfall, and fires, which can all be disastrous. Many animals are killed when they are covered in sand and dust as a result of floods in water. Some animal species are killed as a result of fallen trees, heavy wind. Many of the animals were killed as a result of the toxic gases emitted by the factories. Animal deaths are increasing dramatically due to a variety of factors. Recently in Gujarat rains, one person and 90 animals were killed in Anand flooding due to heavy rainfall on July 3 2022. Over 250 cows die due to heavy rains in Odisha in December 2018. Several animals are killed in a gas leak at the LG Polymers factory in Vizag in May 2020.
Dead animals on the road should be removed quickly as early as possible. A dead animal may release bacteria that were previously contained within its body as it decomposes, potentially exposing people to disease-causing pathogens. Dead animals pose a risk to public health, because of offensive odours cause respiratory problems in humans and also other animals. When an animal dies, it is the owner's responsibility to dispose of the carcass in a manner that is not harmful to the environment or public health. This is true for farm owners, pet owners, service animal organisations (such as police departments), animal shelters, and laboratories. When people see roadkill, they call their local police or animal control department, and the municipality picks it up. The National Highway Administration and local village secretariats should be held accountable for the removal of dead animals from the roads. It takes some time for the municipality to remove the dead animals. So, to reduce the time delay we can accurately detect dead animals using deep learning and computer vision techniques.
Using computer vision, computers and machines can be taught to understand human action, behaviour, and language in much the same way as humans do. ML includes computer vision, which aims to make sense of images and videos by programming a computer to interpret the visual information contained within the digital data. In order to solve complex problems and make better business decisions, we need to translate data into meaningful insights based on contextual information provided by humans. Deep learning is applied in various areas such as image and video processing, image captioning [1], object-detection [2], natural language processing [3] etc. In DL, artificial neural networks are used to mimic the functioning of the human brain. As the human brain does, machines can learn through deep learning. Deep learning is applied in a wide range of applications in the recent times. Object-detection is the process of “locating” and "classifying" Objects. A procedure designed to detect objects consists of locating relevant elements, drawing rectangular bounding boxes around them, and determining each object's class. Object-detection can be done through ML and DL approaches. ML methods include "SIFT", "HOG" and Viola-Jones object detection and these methods are not efficient for accurate detection.
Several deep learning-based object--detection techniques are available i.e., Faster R-CNN, YOLO, YOLO v2, YOLOv3, YOLOv4, YOLOv5, YOLOv6, YOLOv7 and single shot detection (SSD). Each algorithm has some merits and some demerits and which algorithm should be used is determined based on the problem requirements. In this paper also, we used deep learning-based detection methods to detect dead animals on the roads and sending an alert information to the municipal authorities, so that municipality could take appropriate action.
Camera-based techniques have been used to detect animals on roads by many researchers, but they have several limitations as well. Despite the challenges, detection in coloured images has been successfully implemented using cutting-edge deep learning techniques [4-6]. Detection of animals on the road is an important problem that need to be done within some specific time boundary. As a result, the solution must be time efficient.
For dead animal detection we need images. So, we gathered images from the internet and some images are captured through drones. Practically we can use UAVs to detect dead animals. UAVs are used for surveillance, traffic monitoring, and surveys, among other things. In recent years, they have primarily replaced choppers due to their greater mobility and flexibility [7]. UAVs are being used in modern society with real-time deep learning algorithms that are more efficient and accurate. Aerial sensing research using deep neural networks has become increasingly popular in urban, environmental, and agricultural contexts [8].
A Brief analysis on animal detection is displayed in Table 1. The use of an automatic animal detection and warning system can help reduce collisions between vehicles and animals on roads and highways [9-13]. Trampling by animals such as "cows", "monkeys”, “rats”, “deer", "peacocks”, “elephants" and others causes significant crop damage. During the day, crops are easier to protect. At night, crops are more difficult to protect [14, 15]. van Gemert et al. [16] uses animal detection for animal counting. El Abbadi et al. [17], Tan et al. [18], Ulhaq et al. [19] detect the animals and classify the animals.
Table 1. Analysis on animal detection
|
Reference |
Animal Detection |
Focussed On |
|
[9-13] |
YES |
Vehicle-animal collisions. |
|
[14, 15] |
YES |
Protection of crops. |
|
[16] |
YES |
Animal Counting. |
|
[17-19] |
YES |
Classification of Animals. |
|
[Our Paper] |
YES |
Detection of Dead animals and remove them immediately to safeguard public health. |
Van Gemert et al. [16] used dataset containing of 6 videos recorded by “Ascending Technologies Pelican" (quadcopter)with a mounted GoPro HERO 3: Black Edition action camera. El Abbadi et al. [17] developed their own dataset consisting of 12000 images for their study in animal detection. Tan et al. [18] used “(Northeast Tiger and Leopard National Park wildlife dataset)” for animal detection.
In this paper, we claim the following contributions:
·The system takes the video or images as input and continuously checks for the Dead animals.
·Train the model using different algorithms to identify dead animals.
·On a large scale, we validate our process on DAD (Dead Animal Detection dataset) and inform the concerned municipal authorities for dead animals removal.
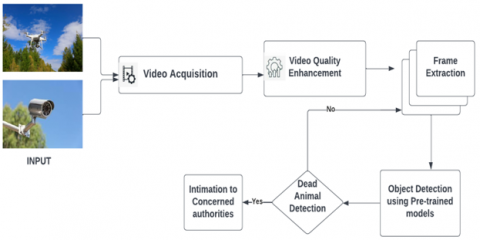
Throughout this section, we will discuss how the data can be prepared for training the model at various stages. Figure 1 depicts the process of dead animal detection using object detection techniques.
Figure 1. Overview of dead animal detection
2.1 Construction of dataset
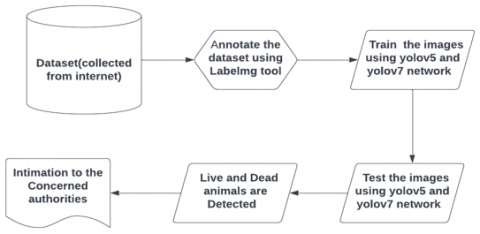
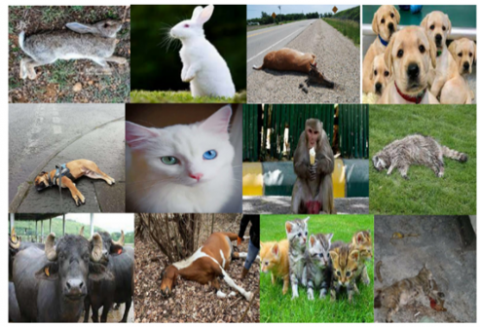
The dataset used in this study were obtained from the internet for animal detection. We gathered images of various animals in various orientations, lighting, and backgrounds. Video can be enhanced using various deep-learning techniques. To extract images from videos, we used a Python script (the frame rate was 50). Figure 2 shows how the data is collected and prepared for training. Figure 3 illustrates some sample images from our dataset.
Figure 2. Dataset collection process
Figure 3. Sample images from dataset
2.2 Data pre-processing
Pre-processing data is an important step in improving data quality. An important component of data pre-processing is organising and cleaning raw data in order to produce the desired outputs that are understandable and accessible. Image data can have complexity, correctness, and sufficiency issues. Image data processing is one of the most unexplored areas of data science. Image pre-processing techniques include grayscale conversion, normalisation, data augmentation, and image standardisation. We used data augmentation to increase the dataset size and rescaled the images to 416×416.
We extracted frames from the videos to prepare the training dataset. We had a large number of extracted frames because the video frame rate (used for the training dataset) was 60 frames per second. However, the majority of the frames have no indications of any animals; thereby, for robust results, only those frames which were confirmed to contain dead animals were used, while the rest were discarded.
2.3 Data annotation
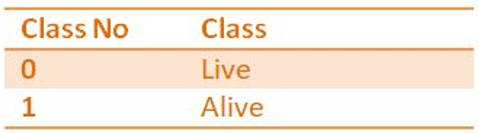
We need to annotate the data set. To annotate the image, we used the "labelimg tool". We need to draw the bounding box on the area of interest and label the class. After selecting the class, we need to save so that we receive a text file as output. The first decimal value in each text file represents the class id, followed by the x-axis and y-axis centres, and finally the width and height. The dataset is then divided into train and test segments for further processing. Figure 4 depicts classes involved in our object detection process. Figure 5 shows how the data annotation is done for our dataset using Labelimg tool.
Figure 4. Classes in our dataset
Figure 5. A sample of data annotation in our dataset for various animal species
It is possible to detect objects using either an anchor-based or an anchor--free method in the era of deep learning. The anchor--based detection method comprises a one-stage algorithm and a two--stage algorithm [20, 21]. The one--stage detector generates a "probability of a class" and a "position coordinate value" for the object, while the two--stage detector generates a "region proposal" and a "target boundary" based on the region proposal [22].
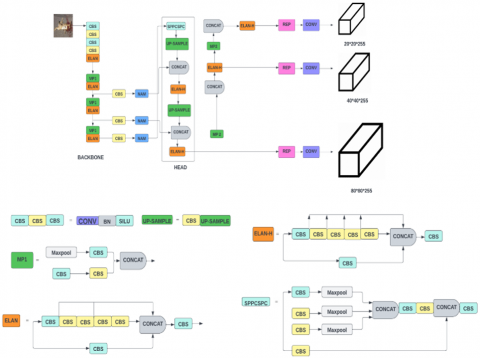
Increased network speed and strength in YOLOv7 allow for more efficient label assignment and model training, as well as improved accuracy in object identification and a more reliable loss function. So, in this study, we used YOLOv7, to identify, localise, and identify dead animals on roads, highways, and forests.
3.1 YOLOv7 architecture overview
Regarding object detection models, there are many different object detection models that perform well for specific use cases, but the recent release of "YOLOv7", was good enough in both speed and accuracy among all object detectors. In terms of speed and accuracy, the proposed YOLOv7 version E6 outperformed transformer-based detectors like "SWINL Cascade-Mask R-CNNR-CNN". The YOLOv7 outperformed the “Scaled-YOLOv4", "DINO-5scale-R50", "YOLOv5", "DETR", "Deformable DETR", "YOLOX", "YOLOR”, and "Vit-Adapter-B". The main key points of YOLOv7 architecture includes
Extended Efficient Layer Aggregation Network: E-ELAN focuses primarily on the computational density and model architecture parameters. The main advantage of ELAN was that it allowed a deeper network to learn and converge more effectively by controlling the gradient path.
Model Scaling for Concatenation based Models: For concatenation-based models, the model scaling method involves scaling depth in a computational block and width scaling in the remaining transmission layers.
Planned re-parameterized convolution: "Rep-Conv” can be replaced by a RepConvN layer with no identity connections.
Coarse for auxiliary and fine for lead loss: In this label assigner, predictions for heads and ground truth labels are used together to obtain labels for both training heads and auxiliary heads.
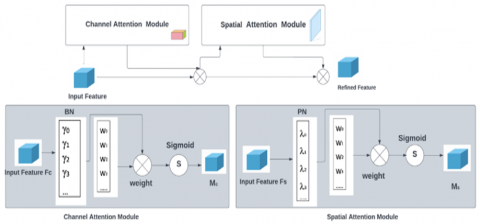
3.2 Improved YOLOv7 with normalization-based attention module (NAM)
The attention mechanism is commonly employed in machine learning and deep learning algorithms [23]. The computer vision attention mechanism finds correlations between original data and highlights significant aspects, such as channel attention, pixel attention, multi-order attention, etc. (Figure 6).
NAM is a variation of the image classification CBAM module [24-26]. Figure 7 shows how channel and spatial attention submodules are redesigned. Attention can be rebalanced by modifying the training weights of variance measurements across channels and spatial dimensions. Batch normalization is a scaling factor (BN).
$\mathrm{B}_{\mathrm{OUT}}=\mathrm{BN}\left(\mathrm{B}_{\mathrm{IN}}\right)=\gamma \frac{B_{I N}-\mu_b}{\sqrt{\sigma_b^2+\varepsilon}}+\beta$ (1)
where, $\gamma, \beta$ represent the trainable scale and shift parameters, respectively. $\mu_b$ and $\sigma_b$ are the mean and standard deviation in each batch $b$, respectively. $\gamma$ is the variance of $\mathrm{BN}$.
$\mathrm{M}_{\mathrm{c}}=\sum\left(\mathrm{W}_\gamma\left(\mathrm{BN}\left(\mathrm{F}_{\mathrm{c}}\right)\right)\right)$ (2)
Similarly, its spatial attention module applies BN to pixels in the spatial dimension. It is so-called pixel normalization (PN). It focuses on informational pixels based on scaling factor λ and modifies weights Wλ. The scaling factor value range between 0 and 1. Let us consider one more function Fse RH×W×NC is the input feature map and Ms represents the output of the spatial attention module. The Output Ms can be expressed as:
$\mathrm{M}_{\mathrm{s}}=\Sigma\left(\mathrm{W}_\lambda\left(\mathrm{PN}\left(\mathrm{F}_{\mathrm{s}}\right)\right)\right)$ (3)
NAM regularizes the loss function to suppress less important weights. The loss can be expressed as:
loss $=\sum_{(x, y)} l(f(x, W), y)+p \sum g(\gamma)+p \sum g(\lambda)$ (4)
where, l(.) and g(.) represent the loss function and l1 represents norm penalty function, x and y are the input and output, respectively; W is the network weight; and p is the equilibrium penalty factor.
Figure 6. Improved YOLOv7 with normalization-based attention module
Figure 7. Architecture of NAM with two attention submodules
3.3 YOLOv7 implementation details
“YOLOv7" model consists of the following training steps.
·For training, we use Google Colab. Create a new notebook, change the runtime type to GPU, and run the code below. This will clone the "yolov7 repository" and install the modules required for training in the colab environment.
·The dataset will be downloaded and extracted into a folder. Once the dataset has been downloaded, we must obtain the "YOLOv7" weight file. Because training from scratch takes longer, we will finetune previously pretrained weights on our dataset. "Yolov7.pt" will be downloaded in our project.
·Create a data. Yaml file with classes and double-check the paths in the ‘data. Yaml’ file inside the ‘yolov7/dataset' folder, as well as the paths in the training data.
·When the training is finished, the best weight is saved at the specified location, which is usually inside the 'runs' folder. Once we have the weight file, we can begin evaluating and inferencing.
·The detect.py script can be used to identify the alive or live animal in the image.
4.1 Evaluation metrics
Different hyperparameter parameters, including scaled picture size, batch size, and optimizer, can have an impact on the detection performance of the Improved YOLOv7 model. We manually tweaked the hyperparameters of the Improved YOLOv7 model and monitored its output on the ADD dataset to determine its best settings. We used F1 score and mAP for testing model's accuracy [27]. The harmonic means of precision & recall indicates F1 score [28]. The maximum and minimum values of F1 score are 1 and 0. Calculating mAP involves taking the average precision and dividing it by its mean. Among the total number of samples, recall represents the percentage that was correctly classified.
"Precision", "F1-score", "accuracy" and the "recall" are some of the metrics used to assess neural network performance. Precision describes correct predictions made from false positives, whereas recall describes correct predictions made from false negatives. The accuracy is determined by both the number of correct predictions and the number of incorrect predictions. The formulas listed in Eqns. (5)-(8) were used to calculate all of the performance metrics for our trained model. In the equations Prec represents Precision, Re represents recall, Acc represents accuracy, whereas TP', TN' denotes true positives, true negatives and FP’, FN' denotes false positives, false negatives respectively. TP' and TN' are correct predictions, while FP' and FN' are incorrect predictions.
$\operatorname{Prec}=\frac{T P^{\prime}}{T P^{\prime}+F P^{\prime}}$ (5)
$R e=\frac{T P^{\prime}}{T P^{\prime}+F N^{\prime}}$ (6)
$A c c=\frac{T P^{\prime}+T N^{\prime}}{T P^{\prime}+T N^{\prime}+F P^{\prime}+F N^{\prime}}$ (7)
$F 1-$ score $=2 * \frac{\operatorname{Prec} * \operatorname{Re}}{\operatorname{Prec}+\operatorname{Re}}$ (8)
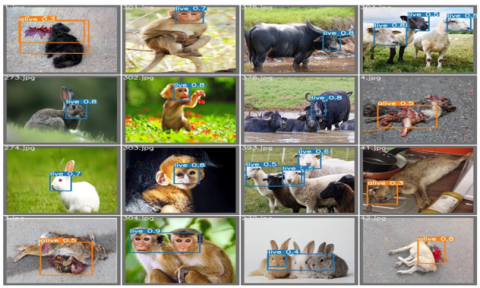
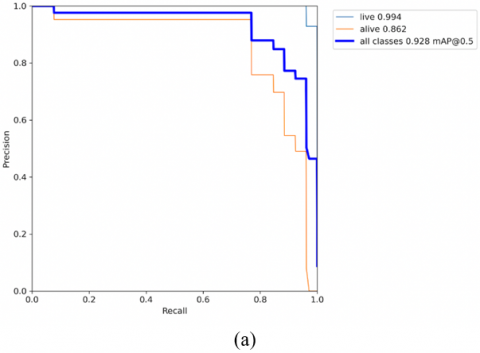
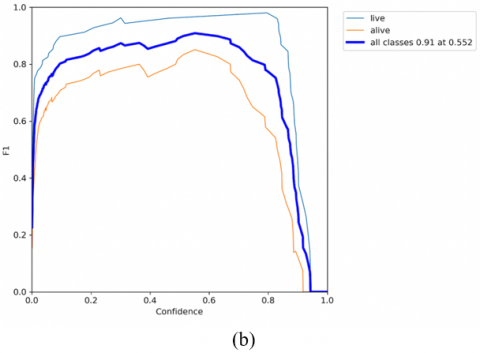
Intersection over Union (IoU) threshold: A value used in object-detection to calculate the overlap of a predicted versus actual bounding box for an object. It is predicted that the bounding box values will be closer to the actual bounding box values when the intersection and IoU values are high. The sample results of YOLOv7 are shown in Figure 8. The "YOLOv7" model was trained for 50 epochs and the best weights are saved in runs folder. The time taken to run “YOLOv7" is 0.54 hrs. F1 score is 0.552 for "YOLOv7" model.
Figure 8. YOLOv7 results
Figure 9. (a) PR curve of YOLOv7 model; (b) F1-Score of YOLOv7 model
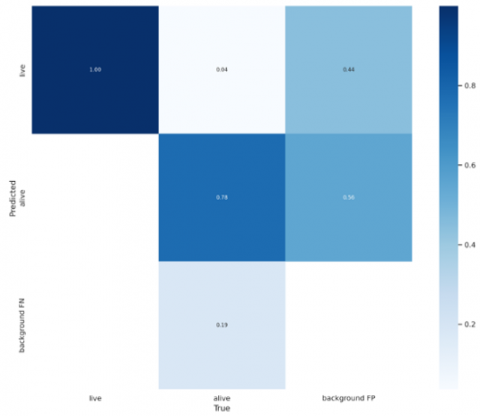
A correlogram is the best tool for exploratory data analysis. In a single glance, the entire dataset's relationship can be visualised. The correlogram, based on the bounding boxes of both classes, Figure 10 illustrates their relationship. Figure 9 depicts precision and recall curve and confidence versus F1 curve of "YOLOv7" respectively. YOLOv7 is better than previous models in terms of speed & accuracy.
Figure 10. Correlogram analysis of YOLOv7 model on our ADD dataset
4.2 Comparison of algorithms w.r.t to animal death detection
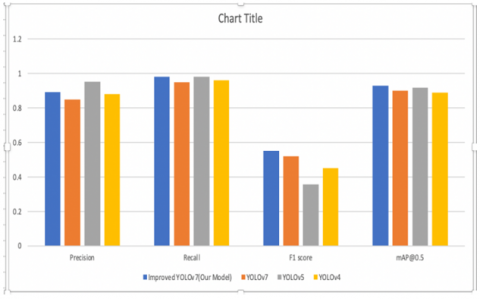
The parameters after training YOLOv7 are illustrated in Table 2. In addition to the YOLOv7 model we have trained with YOLOv5 and YOLOv4 using the ADD dataset and comparison analysis is illustrated in Table 2 and a bar chart is shown in Figure 11.
Table 2. Comparison of YOLO algorithms
|
Measure |
Improved YOLOv7 (Our Model) |
YOLOv7 |
YOLOv5 |
YOLOv4 |
|
Precision |
0.893 |
0.85 |
0.952 |
0.88 |
|
Recall |
0.98 |
0.95 |
0.979 |
0.96 |
|
F1 score |
0.552 |
0.52 |
0.358 |
0.45 |
|
mAP@0.5 |
0.928 |
0.90 |
0.918 |
0.89 |
|
epochs |
50 |
70 |
100 |
100 |
Figure 11. Bar chart on comparison of YOLO algorithms
“YOLOv5” employs auto learning bounding boxes [29] and “CSPdarkent53” to improve the algorithm’s overall accuracy. The YOLOv6 and YOLOv7 models outperform the YOLOv5 model in low-light scenarios. In particular, the model is able to detect the presence of dead animal with accuracy scores of 0.92 and 0.9 with improved YOLOv7 model and YOLOv7 model respectively. Keep in mind that the F1-score is a value used to represent an equilibrium between the model’s precision rate and recall rate. As a result of the higher mAP and F1 score of “YOLOv7,” we can conclude that it can detect objects more accurately for our specific application than earlier versions of “YOLO” in the ADD (Animal Detection dataset).
We created an object detection module that detects dead animals on the road. It has not been possible to find an object detection algorithm for dead animals on the road in previous work. For dead animal detection, we compared the accuracy and speed of our proposed YOLOv7 with the earlier versions of YOLO. Prior to testing the YOLO algorithms were trained and validated on the Animal Death detection dataset. According to Table 2, our investigations confirm that both algorithms are good for dead animal detection and for the protection of public health.
We thank VIT-AP University for providing the resources needed for this research.
[1] Sirisha, U., Sai Chandana, B. (2022). Semantic interdisciplinary evaluation of image captioning models. Cogent Engineering, 9(1): 2104333. https://doi.org/10.1080/23311916.2022.2104333
[2] Sirisha, U., Chandana, B.S. (2023). Privacy preserving image encryption with optimal deep transfer learning based accident severity classification model. Sensors, 23(1): 519. https://doi.org/10.3390/s23010519
[3] Sirisha, U., Bolem, S.C. (2022). Aspect based sentiment & emotion analysis with ROBERTa, LSTM. International Journal of Advanced Computer Science and Applications, 13(11).
[4] Redmon, J., Farhadi, A. (2017). YOLO9000: Better, faster, stronger. In Proceedings of the IEEE Conference on Computer Vision and Pattern Recognition, pp. 7263-7271. https://doi.org/10.1109/CVPR.2017.690
[5] Redmon, J., Farhadi, A. (2018). Yolov3: An incremental improvement. arXiv preprint arXiv:1804.02767. https://arxiv.org/abs/1804.02767.
[6] Bochkovskiy, A., Wang, C.Y., Liao, H.Y.M. (2020). Yolov4: Optimal speed and accuracy of object detection. arXiv preprint arXiv:2004.10934. https://arxiv.org/abs/2004.10934.
[7] Corcoran, M. (2014). Drone journalism: Newsgathering applications of unmanned aerial vehicles (UAVs) in covering conflict, civil unrest and disaster. Flinders Univ. Adelaide, 201: 202014.
[8] Osco, L.P., Junior, J.M., Ramos, A.P.M., de Castro Jorge, L.A., Fatholahi, S.N., de Andrade Silva, J., Matsubara, E.T., Gonçalves, N.W., Pistori, H., Li, J. (2021). A review on deep learning in UAV remote sensing. International Journal of Applied Earth Observation and Geoinformation, 102: 102456. https://doi.org/10.1016/j.jag.2021.102456
[9] Sodagar, H.R., Es’hagh-Pour Rezaee, M., Shekarian, R., Rahmati, T. (2022). E-learning of router applications to drivers in order to reduce collisions and road accidents with wild animals. Interdisciplinary Journal of Virtual Learning in Medical Sciences, 13(1): 63-65. https://doi.org/10.30476/ijvlms.2022.94592.1139
[10] Gandhi, R., Gupta, A., Yadav, A.K., Rathee, S. (2022). A novel approach of object detection using deep learning for animal safety. In 2022 12th International Conference on Cloud Computing, Data Science & Engineering (Confluence), pp. 573-577. https://doi.org/10.1109/Confluence52989.2022.9734225
[11] Sato, D., Zanella, A.J., Costa, E.J.X. (2021). Computational classification of animals for a highway detection system. Brazilian Journal of Veterinary Research and Animal Science, 58: 1-10. https://doi.org/10.11606/issn.1678-4456.bjvras.2021.174951.
[12] Munian, Y., Martinez-Molina, A., Alamaniotis, M. (2020). Intelligent system for detection of wild animals using HOG and CNN in automobile applications. In 2020 11th International Conference on Information, Intelligence, Systems and Applications (IISA), pp. 1-8. https://doi.org/10.1109/IISA50023.2020.9284365.
[13] Sharma, S.U., Shah, D.J. (2016). A practical animal detection and collision avoidance system using computer vision technique. IEEE Access, 5: 347-358. https://doi.org/10.1109/ACCESS.2016.2642981
[14] Khatri, K., Asha, C.S., D'Souza, J.M. (2022). Detection of animals in thermal imagery for surveillance using GAN and object detection framework. In 2022 International Conference for Advancement in Technology (ICONAT), pp. 1-6. https://doi.org/10.1109/ICONAT53423.2022.9725883
[15] Gogoi, M. (2015). Protection of crops from animals using intelligent surveillance system. Journal of Applied and Fundamental Sciences, 1(2): 200.
[16] van Gemert, J.C., Verschoor, C.R., Mettes, P., Epema, K., Koh, L.P., Wich, S.A. (2014). Nature Conservation Drones for Automatic Localization and Counting of Animals. In ECCV Workshops, pp. 255-270.
[17] El Abbadi, N.K., Alsaadi, E.M.T.A. (2020). An automated vertebrate animal’s classification using deep convolution neural networks. In 2020 International Conference on Computer Science and Software Engineering (CSASE), pp. 72-77. https://doi.org/10.1109/CSASE48920.2020.9142070
[18] Tan, M., Chao, W., Cheng, J.K., Zhou, M., Ma, Y., Jiang, X., Ge, J., Yu, L., Feng, L. (2022). Animal detection and classification from camera trap images using different mainstream object detection architectures. Animals, 12(15): 1976. https://doi.org/10.3390/ani12151976.
[19] Ulhaq, A., Adams, P., Cox, T.E., Khan, A., Low, T., Paul, M. (2021). Automated detection of animals in low-resolution airborne thermal imagery. Remote Sensing, 13(16): 3276. https://doi.org/10.3390/rs13163276.
[20] Zhao, Z.Q., Zheng, P., Xu, S.T., Wu, X. (2019). Object detection with deep learning: A review. IEEE Transactions on Neural Networks and Learning Systems, 30(11): 3212-3232. https://doi.org/10.1109/TNNLS.2018.2876865
[21] Zou, Z., Chen, K., Shi, Z., Guo, Y., Ye, J. (2023). Object detection in 20 years: A survey. arXiv preprint arXiv:1905.05055. https://doi.org/10.48550/arXiv.1905.05055
[22] Carranza-García, M., Torres-Mateo, J., Lara-Benítez, P., García-Gutiérrez, J. (2020). On the performance of one-stage and two-stage object detectors in autonomous vehicles using camera data. Remote Sensing, 13(1): 89. https://doi.org/10.3390/rs13010089
[23] Jiang, K., Xie, T., Yan, R., Wen, X., Li, D., Jiang, H., Feng, L., Duan, X.L., Wang, J. (2022). An attention mechanism-improved YOLOv7 object detection algorithm for hemp duck count estimation. Agriculture, 12(10).
[24] Zhu, X., Lyu, S., Wang, X., Zhao, Q. (2021). TPH-YOLOv5: Improved YOLOv5 based on transformer prediction head for object detection on drone-captured scenarios. In Proceedings of the IEEE/CVF International Conference on Computer Vision, pp. 2778-2788. https://doi.org/10.48550/arXiv.2108.11539.
[25] Liu, Y., Shao, Z., Teng, Y., Hoffmann, N. (2021). NAM: Normalization-based attention module. arXiv preprint arXiv:2111.12419. https://arxiv.org/abs/2111.12419
[26] Gong, H., Mu, T., Li, Q., Dai, H., Li, C., He, Z., Wang, W., Han, F., Tuniyazi, A., Li, H.Y., Lang, X.C., Li, Z.Y., Wang, B. (2022). Swin-transformer-enabled YOLOv5 with attention mechanism for small object detection on satellite images. Remote Sensing, 14(12): 2861. https://doi.org/10.3390/rs14122861.
[27] Davis, J., Goadrich, M. (2006). The relationship between Precision-Recall and ROC curves. In Proceedings of the 23rd International Conference on Machine Learning, pp. 233-240. https://doi.org/10.1145/1143844.1143874
[28] Maxwell, A.E., Warner, T.A., Guillén, L.A. (2021). Accuracy assessment in convolutional neural network-based deep learning remote sensing studies—part 1: Literature review. Remote Sensing, 13(13): 2450. https://doi.org/10.3390/rs13132450
[29] Mseddi, W.S., Sedrine, M.A., Attia, R. (2021). YOLOv5 based visual localization for autonomous vehicles. In 2021 29th European Signal Processing Conference (EUSIPCO), pp. 746-750. https://doi.org/10.23919/EUSIPCO54536.2021.9616354