Lei Yu*![]() | Mazhar Ali
| Mazhar Ali![]() | Imran Ali Khan
| Imran Ali Khan![]() | Tahir Maqsood
| Tahir Maqsood![]() | Yinling Wang
| Yinling Wang![]() | Haining Gao
| Haining Gao![]()
© 2023 IIETA. This article is published by IIETA and is licensed under the CC BY 4.0 license (http://creativecommons.org/licenses/by/4.0/).
OPEN ACCESS
Smart energy monitoring and analysis based on image recognition technology can provide more accurate and real-time data support for energy systems, improving the efficiency and level of energy management. The method is sensitive to factors such as image quality, illumination, and angle, and when the image quality is not high, the recognition effect may be poor. Some methods, such as feature extraction and deep learning methods, have a large amount of computation and relatively poor real-time performance, which may affect the timeliness of energy monitoring. Therefore, this study conducts a study on smart energy monitoring and analysis methods based on image recognition technology. The energy monitoring instrument panel is preprocessed with brightness adjustment and Hough transform. After extracting the pointer instrument panel, the pointer detection and angle calculation are performed by using connected domain analysis, thinning algorithm, line fitting, and pointer direction judgment mechanism. The energy monitoring instrument reading recognition method is given. The effectiveness of the proposed method is verified through experimental results analysis.
image recognition, energy monitoring, monitoring instrument reading recognition
With the rapid development of society, the demand for energy is constantly increasing, and the importance of energy monitoring and management is increasingly prominent [1-5]. Smart energy monitoring and analysis based on image recognition technology can provide more accurate and real-time data support for energy systems, improving the efficiency and level of energy management [6-13]. In the context of Industry 4.0 and digital transformation, various industries are constantly moving towards intelligent development. The energy industry also needs to keep pace with the times and use image recognition and other technological means for smart energy monitoring and analysis. In the various links of energy production, transportation, and use, it is necessary to monitor the operation of equipment and potential safety hazards in real time [14-21]. Image recognition technology can be used to quickly and accurately identify the abnormal conditions of energy equipment, thereby improving the operating efficiency and safety of energy equipment. It is necessary and meaningful to study this method.
Imran et al. [22] evaluated and compared the state-of-the-art deep learning algorithm You Only Look Once (YOLO) and traditional manual features for text extraction and recognition. The image dataset contains 10,000 electricity meter images, which are further expanded through in-plane rotation and scaling data enhancement to make the deep learning algorithm robust to these image changes. To train and evaluate, the image dataset is annotated to produce ground truth for all images. The proposed method can be very helpful in reducing the time and effort involved in current electricity meter readings, i.e., workers visiting households, taking pictures of electricity meters, and manually extracting readings from these images. To solve the problem of low sorting efficiency and poor quality caused by manual sorting in traditional electricity meter recycling, Hu et al. [23] adopted digital image processing technology and constructs an electricity meter recycling automatic sorting system based on an artificial neural network. The basic requirements for system construction are first analyzed in detail, and then the principles and methods of artificial neural network image recognition are introduced in detail. Based on this, the overall framework of the automatic sorting of electricity meter recycling is constructed. Finally, the functional modules are designed and applied, and the Azure database is built through the SQL Server platform, thus realizing the system application of this research. The final application shows that the automatic sorting system constructed by the research results has a simple interface and is easy to operate, which can greatly improve the efficiency and quality of electricity meter recycling sorting and has certain practical significance for the development of the national power grid industry. Bajaj and Yemula [24] proposed a Meter Image Capture and Processing System (MICAPS). MICAPS is an image-based data extraction technology. MICAPS is achieved by integrating Raspberry Pi with the Raspberry Pi camera. Python code is used to configure the camera, capture images and send them to the cloud. This image is a seven-segment display. To convert the seven-segment display into text, a computer vision optical recognition algorithm is used. Kanagarathinam and Sekar [25] described the collection of the original image dataset of digital electricity meter displays, text detection, and recognition of seven-segment digits from the collected samples, which may help reduce the cost of Advanced Metering Infrastructure (AMI). The proposed dataset has great potential in the field of electricity billing based on fully automatic Optical Character Recognition (OCR).
Currently, the main methods for energy monitoring instrument image data recognition used in smart energy management and analysis include: template matching method, edge detection method, feature extraction method, and deep learning-based method. Most of these methods are sensitive to factors such as the quality, illumination, and angle of the input image, and the recognition effect may be poor when the image quality is not high. Some methods, such as feature extraction and deep learning methods, have a large amount of computation and relatively poor real-time performance, which may affect the timeliness of energy monitoring. Moreover, existing methods perform well with specific types of energy monitoring instruments, but their generalization ability may be weak when facing new or different types of instruments, requiring retraining or adjustment of the model. To this end, this study conducts research on smart energy management and analysis methods based on image recognition technology. Section 2 of the study deals with the preprocessing of the energy monitoring instrument dial using brightness adjustment and Hough transform. In section 3, after extracting the pointer instrument dial, pointer detection and angle calculation are performed using connected domain analysis, thinning algorithm, line fitting, and pointer direction judgment mechanism. The energy monitoring instrument reading recognition method is given in section 4. Through the analysis of experimental results, the effectiveness of the proposed method is verified.
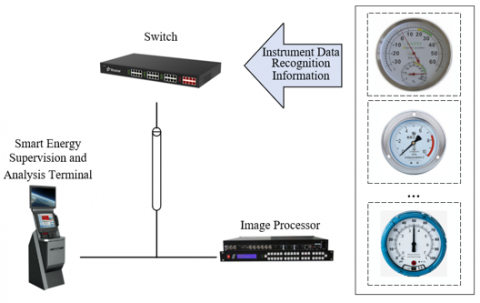
Figure 1. Overall architecture of the smart energy management and analysis system
In the actual scenario of smart energy management and analysis shown in Figure 1, due to the complexity of the shooting environment, the shooting process of the analog instrument is easily affected by lighting, which can cause great interference to the automatic recognition and reading of the instrument later. In order to improve the accuracy of automatic recognition and reading of the instrument, image preprocessing is crucial. In actual scenarios, it is often difficult to ensure constant lighting conditions, and brightness adjustment helps to eliminate the impact of changes in lighting conditions, making the image closer to the ideal state. Moreover, it can enhance the contrast of the image, making the difference between the instrument dial, pointer, and scale more obvious, which is convenient for subsequent recognition and location. Hough transform is a method used to detect specific geometric shapes in images, such as lines and circles. Through the Hough transform, the edge of the instrument dial can be effectively detected, thereby accurately positioning the dial. At the same time, it can detect the straight lines in the image, which helps to locate and detect the pointer, and then provides the basis for pointer angle calculation and reading calculation.
Histogram Equalization (HE) and Contrast Limited Adaptive Histogram Equalization (CLAHE) can both be used for brightness adjustment of energy monitoring instrument images. However, in the actual scenario of smart energy management and analysis, using CLAHE to adjust the brightness of energy monitoring instrument images has advantages over HE, such as local brightness adaptive adjustment, prevention of excessive noise enhancement, preservation of image detail information, and avoidance of local saturation. These advantages help improve image quality, further improving the accuracy and efficiency of energy monitoring instrument image data recognition. The basic algorithm flow is as follows:
(1) Convert the input color image to a luminance-chromaticity space, which makes it easy to process only the luminance component in the subsequent steps without affecting the chromaticity information.
(2) Divide the region: Divide the luminance component image into multiple small regions (tiles).
Local histogram equalization: Perform equalization processing on the luminance histogram of each small region. This step can enhance the contrast of local areas while preserving image detail information.
(3) For each small region's luminance histogram, each gray level corresponds to a set. If the size of the set is larger than a certain threshold, the gray level pixels exceeding the threshold will be removed. Suppose the gray level of each small region being processed is represented by Ig, the width of the small image is represented by Qa, and the height of each small region is represented by Qb, then the average pixel can be calculated by the following formula:
$X l Q=\frac{Q_a \times Q_b}{I_g}$ (1)
The actual threshold can be calculated by the following formula:
$V_g=I_{p j} \times X l Q$ (2)
The removed gray level pixels are evenly distributed. Suppose the interval of removed pixels is represented by V, the total number of removed pixels is represented by K, and the maximum gray level of the image is represented by Vc, then a moving interval can be selected, with:
$x_l=\frac{K}{I_g}$ (3)
$V=\frac{V_c}{K}$ (4)
(4) Contrast limitation: In order to avoid excessive noise enhancement, a contrast threshold can be set. When performing local histogram equalization, gray levels greater than this threshold will be clipped, and the clipped gray levels will then be evenly distributed to other gray levels, thus achieving contrast limitation.
(5) Region fusion: Since each small region has undergone independent histogram equalization processing, there may be unnatural edge transitions. Therefore, it is necessary to perform weighted averaging on adjacent regions to achieve a smooth transition effect.
Determine the center point of each small region as the sample point. Let o=c-c-/c+-c-, u=g-g-/g+-g-. Assuming the grayscale value of the pixel point (c,g) is represented by C(n), and the grayscale values of the four neighboring points around the pixel point are represented by C--, C+-, C-+, and C++. Traverse the image, and the following formula gives the grayscale linear interpolation formula:
$\begin{aligned} & C(n)=o\left[u C_{--}(n)+(1-u) C_{+-}(n)\right] \\ & +(1+o)\left[u C_{--}(n)+(1-u) C_{+-}(n)\right]\end{aligned}$ (5)
(6) Convert back to the original color space: Combine the brightness component after CLAHE processing with the original image's chroma component, and then convert the image back to the original color space (such as RGB space).
After the above steps, the brightness-adjusted energy meter image can be obtained, which is used for subsequent image recognition and analysis.
Figure 2. Hough circle detection principle diagram
In the actual scenarios of smart energy supervision and analysis, the Hough transform is an effective geometric shape detection method used for the detection of circular instrument dials in energy monitoring instrument images. For circle detection, the parameter space includes the circle center coordinates (a, b) and the radius r. The Hough transform finds the most likely parameter combination representing a circle by discretizing and accumulating in the parameter space. Before performing the Hough circle transform, edge detection should be performed on the image first to extract the edge information of the instrument dial. Then, according to the equation of a circle, draw a circle in the parameter space for each edge point in the image, taking the point as a point on the circumference, and the circle center and radius as parameters. In the parameter space, accumulate all the circles corresponding to the edge points, find the parameter combination with the maximum accumulation value, which is the detected circular dial. Figure 2 shows the principle diagram of Hough circle detection. Hough circle detection locates circles through a voting mechanism. Specifically, the standard equation of a circle (c-o)2+(g-u)2=f2 is converted to the ouf coordinate system, which is:
$o=c-f \cos \varphi ; u=g-f \sin \varphi$ (6)
Many energy monitoring instruments use pointer-style readings, where the position and angle of the pointer directly determine the accuracy of the measurement. By detecting the pointer and calculating its angle, accurate data can be obtained from images, providing a reliable basis for smart energy supervision and analysis. Traditional energy monitoring instrument data collection usually relies on manual readings, which is inefficient and prone to error. By detecting pointers and calculating angles, the automation and intelligence of energy monitoring instrument data collection can be achieved, improving data collection efficiency and reducing errors. Existing pointer detection and pointer angle calculation methods have their advantages and disadvantages, and may be affected by factors such as noise, illumination, and shape changes, leading to reduced detection and calculation accuracy. Therefore, improvements to existing methods can be considered in practical applications.
In order to achieve reliable recognition of energy monitoring instrument image data in complex environments, this study adopts connected domain analysis, thinning algorithm, line fitting, and pointer direction judgment mechanism for pointer detection and angle calculation after extracting the pointer-style instrument dial. Connected domain analysis can effectively detect pointer areas with similar color and grayscale features, adapting to pointers of different shapes and sizes. Thinning algorithms can extract the skeleton of the pointer, better describing the geometric characteristics of the pointer. Through line fitting, the angle of the pointer can be calculated more accurately, thereby improving the accuracy of data recognition. Combined with the pointer direction judgment mechanism, the direction of the pointer can be automatically identified, achieving automation and intelligence in energy monitoring instrument data collection. This can effectively reduce errors caused by manual operation and improve the efficiency of energy supervision and analysis.
This study divides pointer detection and pointer angle calculation into three steps: locating the pointer area and instrument center, refining the pointer and line fitting, and the pointer direction judgment mechanism. In the first step of locating the pointer area and the instrument center, the goal is to determine the approximate position of the pointer in the instrument and the center of the dial. First, image processing techniques are used to preprocess the image and extract the edge of the dial. Then, the connected domain analysis or contour detection method is used to find the dial area. Next, by calculating the geometric center of the dial area or using the Hough circle transform to detect the center, the center position of the instrument is obtained. Finally, by analyzing the color, grayscale, or edge information within the dial area, the pointer area can be preliminarily determined.
In the second step of refining the pointer and line fitting, the goal is to extract the skeleton of the pointer and calculate its fitting line. First, the Zhang-Suen algorithm can be used to process the pointer area to obtain the skeleton of the pointer. This step can eliminate differences in pointer width and make it a single-pixel width. Next, the pointer skeleton is fitted using the least squares method, obtaining a line representing the direction of the pointer. This line can help calculate the angle between the pointer and the instrument center.
The Zhang-Suen algorithm is a classic binary image thinning algorithm. It extracts the skeleton of an image by iteratively removing edge pixels. When using the Zhang-Suen algorithm for skeleton extraction in the pointer area, it is important to perform some preprocessing operations on the image before executing the algorithm to improve its performance. These may include denoising, smoothing, and sharpening operations. The algorithm may produce some imperfect skeletons, such as small breaks and bifurcations. In practical applications, post-processing operations (such as morphological operations) can be used to optimize the skeleton results and improve the accuracy of pointer detection and angle calculation.
When converting the pointer area image to a binary image, an appropriate binarization method should be chosen. Different binarization methods may lead to different refinement effects, so it is necessary to choose a suitable method based on the actual situation. To avoid infinite loops, a maximum number of iterations can be set as the termination condition for the algorithm. When the number of iterations reaches the maximum value, the iteration process should be terminated even if the image still changes.
Furthermore, the pointer skeleton is fitted using the least squares method for line fitting. The least squares method is to subtract the actual measured value of the pointer skeleton from the theoretical value and then take the minimum square sum of the calculation results. If there are i fitting points ((cn,gn), (n=1, 2...i), and the actual point is represented by un, the fitted line expression is:
$g(c)=o c+u$ (7)
The following formula gives the square deviation sum calculation formula:
$h^2=\sum_{n=1}^i\left(g_n-g\left(c_n\right)\right)^2=\sum_{n=1}^i\left(g_n-\left(o c_n+u\right)\right)^2$ (8)
To find the values of o and u that ensure the minimum of h2, the partial derivatives of h2 with respect to the unknowns o and u are found, and the partial derivatives are set to 0. The following formula gives the calculation formula for o and u:
$o=\frac{i \sum_{n=1}^i c_n g_n-\sum_{n=1}^i c_n \sum_{n=1}^i g_n}{i \sum_{n=1}^i c_n^2-\left(\sum_{n=1}^i c_n\right)^2}$ (9)
$u=\frac{\sum_{n=1}^i c_n^2 \sum_{n=1}^i g_n-\sum_{n=1}^i c_n \sum_{n=1}^i c_n g_n}{i \sum_{n=1}^i c_n^2-\left(\sum_{n=1}^i c_n\right)^2}$ (10)
In the third step, the pointer direction judgment mechanism, the goal is to determine the actual direction of the pointer and calculate the angle. Based on the fitting line obtained in the previous step, the angle between the line and the instrument center can be calculated. However, since the pointer has two ends, it is necessary to further determine which end is the actual pointing end. This can be done based on the length, color, shape, and other features of the pointer. For example, the pointing end of the pointer is usually shorter and darker in color. Through the pointer direction judgment mechanism, the accurate pointer angle can be obtained. Table 1 provides the pointer direction judgment mechanism.
Table 1. Pointer direction judgment mechanism
|
O |
U |
Quadrant |
Angle |
|
CO>EO |
CU=EU |
O positive semi-axis |
ϕ=0° |
|
CO<EO |
CU=EU |
O negative semi-axis |
ϕ=180° |
|
CO<EO |
CU<EU |
U positive semi-axis |
ϕ=90° |
|
CO=EO |
CU>EU |
U negative semi-axis |
ϕ=90° |
|
CO>EO |
CU<EU |
First quadrant |
0°<ϕ<90° |
|
CO>EO |
CU<EU |
Second quadrant |
90°<ϕ<180° |
|
CO<EO |
CU=EU |
Third quadrant |
180°<ϕ<270° |
|
CO>EO |
CU<EU |
Fourth quadrant |
270°<ϕ<360° |
Figure 3 presents the energy meter reading recognition process. After completing the energy meter dial preprocessing and energy meter pointer detection, it is necessary to extract the scale of the meter. After detecting the circular dial of the meter, edge detection algorithms or Sobel operators are used to extract the dial edge features. For the dial edge feature image, Hough transform is used to detect the scale lines. After detecting the scale lines, they are filtered and classified based on features such as length and angle. For the filtered scale lines, their angles with the meter center are calculated. It should be noted that the angle calculation method needs to be adjusted according to the actual situation to adapt to different types of meters. Based on the angles of the scale lines and the meter's range, the angles can be mapped to actual values. After calculating the pointer's angle, it is matched with the extracted scale values.
Figure 3. Energy meter reading recognition process
Since the scale values generally appear on the major scale lines, this paper divides the dial image according to the detected major scale line positions, obtaining the local areas containing the scale values. That is, a search area is set near the major scale line to obtain the area where the scale value is located. For the segmented local area, some image preprocessing operations are needed to improve the recognition accuracy, including grayscale, binarization, denoising, and smoothing. In the preprocessed image, the text area is located. For the located text area, Optical Character Recognition (OCR) technology is applied for recognition. The recognized scale values are matched with the corresponding major scale lines. This can be achieved by comparing the positions of the scale value area and the major scale lines. After the matching is completed, the scale values corresponding to each major scale line on the meter are obtained.
After extracting the image of the scale values, this paper further adopts a wavelet-based character fast recognition algorithm for scale value recognition. Wavelet transform can effectively capture local features of images, thus helping to improve character recognition accuracy. An appropriate wavelet basis function (such as Haar, Daubechies, etc.) and decomposition level can be chosen to meet the recognition needs. By projecting the binary grid image of characters vertically and horizontally, the conversion from two-dimensional image data to one-dimensional data is realized. The projected data is decomposed into two layers of wavelets, and a feature information is extracted from each layer's smooth component. This is compared and analyzed with the feature information of the template characters, achieving fast and efficient character recognition.
Suppose the wavelet function is represented by Ωs,m(c), and the wavelet coefficients are represented by Gs,m. The expression of any function r(c) in space V2(F) is given by Eq. (11).
$r(c)=\sum_{s, m \in W} G_{s, m} \Omega_{s, m}(c)$ (11)
The conditions satisfied by V2(F) are given by Eq. (12):
$\int_{-\infty}^{+\infty}|r(c)|^2 q c<+\infty, c \in F$ (12)
The scale function expression used in the wavelet-based character fast recognition algorithm is given by Eq. (13):
$\theta(c)=\left\{\begin{array}{l}1,0 \leq c \leq 1 \\ 0, \text { other }\end{array}\right.$ (13)
The wavelet function adopts Harr wavelet, as shown in Eq. (14):
$\Omega(c)=\theta(2 c)+\theta(2 c-1)$ (14)
Suppose the number of unit scale lines is represented by j, the right end scale line value is represented by X, and the left end scale line value is represented by Y. The scale value calculation formula for the ith small scale line within the corresponding scale unit is given by Eq. (15).
$S(i)=\frac{i-1}{j} \times(X-Y)+Y$ (15)
The reading recognition algorithm based on the pointer's deflection angle relies mainly on accurately calculating the pointer's angle to obtain the corresponding reading. Although this method can achieve relatively accurate recognition in many cases, it still has some drawbacks. For example, when the angle between the camera and the meter dial changes, it may cause perspective distortion. This distortion can affect the calculation of the pointer angle, and thus affect the accuracy of reading recognition. In the case of multi-pointer energy meters, this method also needs to deal with multiple pointer angles simultaneously. This may increase the complexity of the recognition algorithm and possibly lead to recognition errors. The method of using scale line values as reference values for reading recognition has the advantages of reducing angle calculation errors, improving stability, being more adaptable to different meters, and being able to handle multi-pointer meters in the application scenario of this paper.
Based on the existing scale line calibration, the readings corresponding to each scale line can be further determined. Suppose the number of detected scale lines is represented by i, the distance from point (cn,gm) to the pointer line Oc+Ug+G=0 is represented by qn, the reading of the pointer is represented by Fi, the readings corresponding to the upper and lower scale lines closest to the pointer are represented by FE and FV, and the distances from the upper and lower scale lines closest to the pointer are represented by q1 and q0. The distance between the pointer and the scale lines can be calculated based on Eq. (16).
$q_n=\frac{\left|O c_n+U g_n+G\right|}{\sqrt{X^2+Y^2}} ; n=1,2 \cdots i$ (16)
The meter reading calculation formula is given by Eq. (17).
$F_i=F_V+\frac{q_1}{q_0+q_1} \times\left(F_E-F_V\right)$ (17)
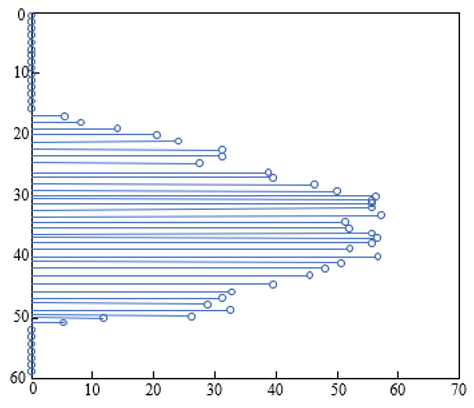
By observing the binary horizontal projection of the energy monitoring instrument image shown in Figure 4, it can be found that there may be significant fluctuations in brightness in some regions. These fluctuations may be caused by uneven illumination, reflection of the instrument material, and other factors. In this case, relying solely on binary processing may not fully extract the effective information of the instrument, which may affect the subsequent recognition and analysis process. Therefore, in order to obtain more accurate energy monitoring instrument readings, it is necessary to adjust the brightness of the image to eliminate the impact of uneven illumination, enhancing the readability and recognition accuracy of the image.
Table 2 provides a comparison of experimental results before and after image preprocessing. A more detailed analysis of the differences in experimental results before and after preprocessing can be made from four aspects: error analysis, time analysis, stability analysis, and practicality analysis. As can be seen from the table, the recognition errors after preprocessing are generally lower. This indicates that the image preprocessing involving brightness adjustment and Hough transform can reduce uneven illumination and environmental interference in the image, making the instrument pointer more clear and distinguishable. This helps improve the accuracy of pointer detection and angle calculation, thereby reducing recognition errors. The recognition time after preprocessing is generally shorter, which may be because the preprocessing process reduces noise and interference in the image, making it easier for the recognition algorithm to find the correct features. In addition, the processed image is clearer, which helps the algorithm quickly locate pointers and dials, thereby shortening the recognition time. In the experimental results after preprocessing, the fluctuations in error and time are smaller, indicating that the preprocessing method has better stability for instruments with different display values. This is crucial for smart energy supervision and analysis, as in practical applications, a large number of instruments with different display values need to be processed, and stability is a key factor. The method after preprocessing not only has lower errors and shorter recognition times but also has better adaptability for instruments with different display values. This makes the method more practical in actual applications, helping to improve the efficiency and accuracy of smart energy supervision and analysis. In summary, the image preprocessing involving brightness adjustment and Hough transform has significant effects on improving the accuracy, reducing recognition time, and enhancing the stability of energy monitoring instrument reading recognition. In the practical scenario of smart energy supervision and analysis, this preprocessing method has important significance, helping to achieve efficient and accurate energy monitoring.
Figure 4. Binary image horizontal projection of the energy monitoring instrument
Table 2. Comparison of experimental results before and after image preprocessing
|
Display value |
Before Preprocessing |
After Preprocessing |
||||
|
Recognize Value |
Error |
Time |
Recognize Value |
Error |
Time |
|
|
0 |
0 |
0 |
30 |
0 |
0 |
41 |
|
37 |
36.65 |
0.35 |
32 |
35.55 |
1.45 |
49 |
|
39 |
38.99 |
0.01 |
27 |
37.82 |
1.18 |
37 |
|
47 |
47.76 |
-0.76 |
33 |
48.98 |
-1.98 |
45 |
|
58 |
58.98 |
-0.98 |
30 |
57.61 |
0.39 |
37 |
|
61 |
61.87 |
-0.87 |
31 |
60.45 |
0.55 |
39 |
|
63 |
63.87 |
-2.87 |
32 |
61.83 |
-0.83 |
43 |
|
75 |
63.32 |
-0.32 |
32 |
65.92 |
-2.92 |
47 |
|
100 |
100.31 |
-0.31 |
29 |
100.43 |
-0.43 |
46 |
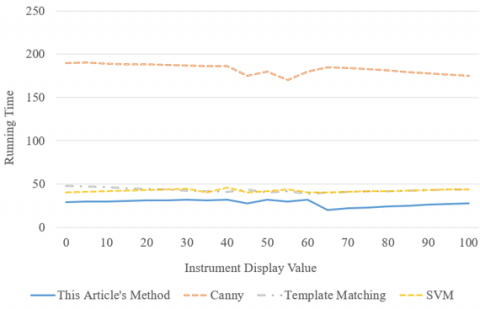
Figure 5. Running time curve of different pointer detection and pointer angle calculation methods
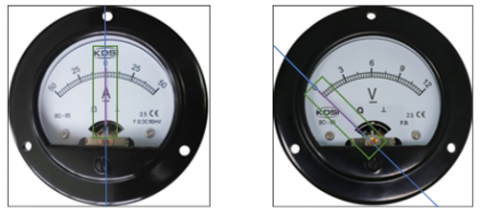
Figure 6. Pointer straight-line fitting results
Figure 5 shows the running time curve of different pointer detection and pointer angle calculation methods. By observing the data in the table, it can be found that the running time of each pointer detection method varies under different instrument display values. The running time of the method proposed in this paper is relatively low under various instrument display values, with small fluctuations, indicating that the method is stable and has faster calculation speed. The running time of the Canny method fluctuates greatly under various instrument display values, and the overall running time is significantly higher than other methods. This suggests that the Canny method may have lower efficiency in pointer detection tasks. The template matching method has a relatively stable running time, but in some instrument display values, the running time is higher. This indicates that the template matching method may have lower efficiency in some cases. The running time of the SVM method fluctuates slightly under various instrument display values, but its overall running time is higher than that of the proposed method. This suggests that the SVM method has lower efficiency in pointer detection tasks. In summary, according to the analysis of running time, the method proposed in this paper has higher efficiency and stability in pointer detection tasks under different instrument display values, performing better than Canny, template matching, and SVM methods.
Figure 6 shows the results of the pointer straight-line fitting. By observing this result, it can be found that the fitting straight line of the pointer skeleton is very close to the actual direction of the pointer, indicating a good fitting effect. In this paper, the least squares method is used to fit the pointer skeleton, aiming to obtain a straight line with the minimum sum of distances from the line to each point of the pointer skeleton. This method can effectively eliminate the influence of noise in the image on the fitting result.
Further, this study compares the experimental results of different energy meter reading recognition methods, and the comparison results are shown in Table 3. By comparing and analyzing the methods proposed in this study, Mask R-CNN, and Watershed, four aspects of conclusions can be drawn: error analysis, time analysis, stability analysis, and practicality analysis. From the table, it can be seen that the recognition error of the method proposed in this study is generally lower, indicating better performance in recognition accuracy. The errors of Mask R-CNN and Watershed methods are relatively larger, which may be due to their susceptibility to illumination and environmental interference when processing energy meter images. The recognition time of the method proposed in this study is generally shorter, implying higher efficiency in processing energy meter images. In contrast, the recognition time of Mask R-CNN and Watershed methods is longer, which may affect the efficiency of smart energy supervision and analysis. In the experimental results of the method proposed in this study, the fluctuations in error and time are smaller, indicating better stability. The fluctuations of Mask R-CNN and Watershed methods are larger, which may result in unstable recognition results when processing meters with different display values. The method proposed in this study has better adaptability when dealing with meters with different display values, maintaining both low error and short recognition time. Mask R-CNN and Watershed methods perform worse in adaptability, possibly requiring parameter adjustments for different meters. In conclusion, the method proposed in this study has higher accuracy, shorter recognition time, and better stability in energy meter reading recognition, making it more valuable for practical applications compared to Mask R-CNN and Watershed methods. In the actual scenarios of smart energy supervision and analysis, adopting the method proposed in this study can help achieve efficient and accurate energy monitoring.
Finally, this study compares the relative errors of different energy meter reading recognition methods, and the comparison results are shown in Table 4. By comparing and analyzing the relative errors of Mask R-CNN, Watershed, before preprocessing, and after preprocessing, the following conclusions can be drawn. Comparing the errors before and after preprocessing, it is evident that preprocessing significantly reduces recognition errors, indicating the importance of preprocessing steps in improving the accuracy of energy meter reading recognition. The method after preprocessing has lower errors compared to Mask R-CNN and Watershed methods, demonstrating better performance in recognition accuracy after preprocessing. In contrast, Mask R-CNN and Watershed methods have relatively larger errors, possibly affected by factors such as illumination and environmental interference. In terms of error performance, the fluctuations of the method after preprocessing are smaller, showing better stability. Mask R-CNN and Watershed methods have larger fluctuations, which may result in unstable recognition results when processing meters with different display values. The method after preprocessing has better adaptability when dealing with meters with different display values, with generally lower errors. Mask R-CNN and Watershed methods perform worse in adaptability, possibly requiring parameter adjustments for different meters. In conclusion, after preprocessing, the method proposed in this study has higher accuracy and better stability in energy meter reading recognition, making it more valuable for practical applications compared to Mask R-CNN and Watershed methods. In the actual scenarios of smart energy supervision and analysis, adopting the method proposed in this study can help achieve efficient and accurate energy monitoring.
Table 3. Comparison of experimental results of different energy monitoring instrument reading recognition methods
|
Display Value |
This Article's Method |
Mask R-CNN |
Watershed |
||||||
|
Recognize Value |
Error |
Time |
Recognize Value |
Error |
Time |
Recognize Value |
Error |
Time |
|
|
0 |
0 |
0 |
30 |
0 |
0 |
199 |
0 |
0 |
47 |
|
37 |
36.65 |
0.35 |
32 |
35.55 |
1.45 |
191 |
36.11 |
0.89 |
43 |
|
39 |
38.99 |
0.01 |
27 |
37.82 |
1.18 |
187 |
37.21 |
1.79 |
49 |
|
47 |
47.76 |
-0.76 |
33 |
48.98 |
-1.98 |
173 |
48.87 |
-1.87 |
37 |
|
58 |
58.98 |
-0.98 |
30 |
57.68 |
0.32 |
177 |
57.78 |
0.22 |
45 |
|
61 |
61.87 |
-0.87 |
31 |
60.01 |
0.99 |
176 |
60.89 |
0.11 |
37 |
|
63 |
63.87 |
-2.87 |
32 |
61.82 |
-0.82 |
183 |
61.23 |
-0.23 |
39 |
|
75 |
63.32 |
-0.32 |
32 |
65.92 |
-2.92 |
184 |
63.68 |
-0.68 |
43 |
|
100 |
100.31 |
-0.31 |
29 |
97.77 |
2.23 |
179 |
99.81 |
0.19 |
47 |
Table 4. Comparison of relative errors of different energy meter reading recognition methods
|
Display Value |
Mask R-CNN |
Watershed |
Before Preprocessing |
After Preprocessing |
|
37 |
1.45 |
0.89 |
1.45 |
0.35 |
|
39 |
1.18 |
1.79 |
1.18 |
0.01 |
|
47 |
-1.98 |
-1.87 |
-1.98 |
-0.76 |
|
58 |
0.32 |
0.22 |
0.39 |
-0.98 |
|
61 |
0.99 |
0.11 |
0.55 |
-0.87 |
|
63 |
-0.82 |
-0.23 |
-0.83 |
-2.87 |
|
75 |
-2.92 |
-0.68 |
-2.92 |
-0.32 |
|
100 |
2.23 |
0.19 |
-0.43 |
-0.31 |
This study conducts research on smart energy supervision and analysis methods based on image recognition technology. The energy meter dial is preprocessed with brightness adjustment and Hough transform. After extracting the pointer-type meter dial, connected component analysis, thinning algorithm, line fitting, and pointer direction judgment mechanism are used for pointer detection and angle calculation. The energy meter reading recognition method is proposed. The experimental results before and after image preprocessing are compared and verified, showing that the brightness adjustment and Hough transform significantly improve the accuracy of energy meter reading recognition, reduce recognition time, and enhance recognition stability. The running time curves of different pointer detection and pointer angle calculation methods are given, showing that the method proposed in this study has higher efficiency and stability in pointer detection tasks with different meter display values, outperforming Canny, template matching, and SVM methods. The results of pointer line fitting are given, verifying the effectiveness of using the least squares method to fit the pointer skeleton. Furthermore, this study compares the experimental results of different energy meter reading recognition methods, demonstrating that the method proposed in this study has better practical application value compared to Mask R-CNN and Watershed methods. Lastly, this study compares the relative errors of different energy meter reading recognition methods. It is evident from the experimental results that after preprocessing, adopting the method proposed in this study can help achieve efficient and accurate energy monitoring.
This research was funded by the Natural Science Foundation of Henan province (Grant No.: 222300420239); and Youth project of National Scientific Research Project Cultivation Fund of Huanghuai University (Grant No.: XKPY-202104).
[1] He, Q., Wu, M., Liu, C., Jin, D., Zhao, M. (2023). Management and real-time monitoring of interconnected energy hubs using digital twin: Machine learning based approach. Solar Energy, 250: 173-181. https://doi.org/10.1016/j.solener.2022.12.041
[2] Selvaraj, R., Kuthadi, V.M., Baskar, S. (2023). Smart building energy management and monitoring system based on artificial intelligence in smart city. Sustainable Energy Technologies and Assessments, 56: 103090. https://doi.org/10.1016/j.seta.2023.103090
[3] Sahu, A., Davis, K., Huang, H., Umunnakwe, A., Zonouz, S., Goulart, A. (2023). Design of next-generation cyber-physical energy management systems: Monitoring to mitigation. IEEE Open Access Journal of Power and Energy, 10: 151-163. https://doi.org/10.1109/OAJPE.2023.3239186
[4] Rohmingtluanga, C., Datta, S., Sinha, N., Ustun, T.S. (2023). SCADA based intake monitoring for improving energy management plan: Case study. Energy Reports, 9(S1): 402-410. https://doi.org/10.1016/j.egyr.2022.11.037
[5] Fetanat, A., Tayebi, M., Shafipour, G., Moteraghi, M. (2023). A novel integrated method of fsQCA and digital design for sustainability monitoring and assessment in building energy management systems: A case study. Journal of Building Performance Simulation, 16(1): 107-130. https://doi.org/10.1080/19401493.2022.2112758
[6] Tao, Y., Qiu, J., Lai, S., Wang, Y., Sun, X. (2022). Reserve evaluation and energy management of micro-grids in joint electricity markets based on non-intrusive load monitoring. IEEE Transactions on Industry Applications, 59(1): 207-219. https://doi.org/10.1109/TIA.2022.3217747
[7] Ullah, Z., Wang, S., Wu, G., Xiao, M., Lai, J., Elkadeem, M.R. (2022). Advanced energy management strategy for microgrid using real-time monitoring interface. Journal of Energy Storage, 52: 104814. https://doi.org/10.1016/j.est.2022.104814
[8] Xue, Z., Dong, B. (2022). Design and implementation of monitoring and management system for battery energy storage. In 2022 IEEE 5th International Electrical and Energy Conference (CIEEC), Nangjing, China, pp. 489-493. https://doi.org/10.1109/CIEEC54735.2022.9846574
[9] Ayinla, L.S., Aziz, A.A., Drieberg, M., Azubogu, A.C., Amosa, T.I. (2022). Energy management algorithm in wireless sensor network for pipeline monitoring. In 2022 International Conference on Future Trends in Smart Communities (ICFTSC), Kuching, Sarawak, Malaysia, pp. 70-75. https://doi.org/10.1109/ICFTSC57269.2022.10039825
[10] Alam, M.M., Haque, A., Khan, M.A., Sobahi, N.M., Mehedi, I.M., Khan, A.I. (2022). Condition monitoring and maintenance management with grid-connected renewable energy systems. CMC-Computers Materials & Continua, 72(2): 3999-4017. https://doi.org/10.32604/cmc.2022.026353
[11] Magrini, A., Marenco, L., Bodrato, A. (2022). Energy smart management and performance monitoring of a NZEB: Analysis of an application. Energy Reports, 8: 8896-8906. https://doi.org/10.1016/j.egyr.2022.07.010
[12] Li, Q., Jiang, Z., Yuan, F. (2022). Monitoring and visualization application of smart city energy economic management based on IoT sensors. Neural Computing and Applications, 34(9): 6695-6704. https://doi.org/10.1007/s00521-021-06108-1
[13] Sumarmad, K.A.A., Sulaiman, N., Wahab, N.I.A., Hizam, H. (2022). Microgrid energy management system based on fuzzy logic and monitoring platform for data analysis. Energies, 15(11): 4125. https://doi.org/10.3390/en15114125
[14] Li, C., Wang, H., Shen, H., Li, Q., Tao, P., Li, B., Wang, Y. (2022). Fractional-order Retinex-based low-light image enhancement fusion algorithm for energy meters. In 2022 IEEE 10th Joint International Information Technology and Artificial Intelligence Conference (ITAIC), 10: 1224-1232. https://doi.org/10.1109/ITAIC54216.2022.9836944
[15] Tang, Y., Ten, C.W., Wang, C., Parker, G. (2015). Extraction of energy information from analog meters using image processing. IEEE Transactions on Smart Grid, 6(4): 2032-2040. https://doi.org/10.1109/TSG.2015.2388586
[16] Salomon, G., Laroca, R., Menotti, D. (2022). Image-based automatic dial meter reading in unconstrained scenarios. Measurement, 204: 112025. https://doi.org/10.1016/j.measurement.2022.112025
[17] Ma, Y., Zhao, Z., Chen, M., Guo, J., Lan, S., Wang, Y. N. (2022). Image comparison research of smart electricity meter. In Proceedings of the 6th International Conference on Advances in Image Processing, Zhanjiang China, pp. 74-79. https://doi.org/10.1145/3577117.3577132
[18] Devyatkin, A.V., Muzalevskiy, A.R., Morozov, A.S. (2022). Computer vision system for image-based automated dial meter reading. In 2022 XXV International Conference on Soft Computing and Measurements (SCM), Saint Petersburg, Russian Federation, pp. 222-225. https://doi.org/10.1109/SCM55405.2022.9794897
[19] Martinelli, F., Mercaldo, F., Santone, A. (2022). Smart grid monitoring through deep learning for image-based automatic dial meter reading. In 2022 IEEE International Conference on Big Data (Big Data), Osaka, Japan, pp. 4534-4542. https://doi.org/10.1109/BigData55660.2022.10020523
[20] Chen, M., Ji, C., Mao, D., Wang, Y.N., Ma, Y., Cao, X. (2022). Application of color filtering and image filtering algorithms in circuit diagnosis of smart meter box. In Proceedings of the 2022 7th International Conference on Multimedia Systems and Signal Processing, pp. 1-7. https://doi.org/10.1145/3545822.3545823
[21] Luo, P., Hu, X., Zhao, Y., Jiang, Y., Lu, F., Liang, J., Xu, L. (2022). Smear character recognition method of side-end power meter based on PCA image enhancement. Nonlinear Engineering, 11(1): 232-240. https://doi.org/10.1515/nleng-2022-0028
[22] Imran, M., Anwar, H., Tufail, M., Khan, A., Khan, M., Ramli, D.A. (2023). Image-based automatic energy meter reading using deep learning. CMC-Computers Materials & Continua, 74(1): 203-216. https://doi.org/10.32604/cmc.2023.029834
[23] Hu, H., Liu, B., Li, W.J., Sun, H.L., Ni, T.S. (2021). Digital image processing technology in design and development of automatic sorting system for energy meter recovery. In Journal of Physics: Conference Series, 2143(1): 012042. https://doi.org/10.1088/1742-6596/2143/1/012042
[24] Bajaj, S., Yemula, P.K. (2020). Computer vision based energy monitoring system using Meter Image Capturing System (MICAPS). In 2020 First International Conference on Power, Control and Computing Technologies (ICPC2T), Raipur, India, pp. 246-249. https://doi.org/10.1109/ICPC2T48082.2020.9071459
[25] Kanagarathinam, K., Sekar, K. (2019). Text detection and recognition in raw image dataset of seven segment digital energy meter display. Energy Reports, 5: 842-852. https://doi.org/10.1016/j.egyr.2019.07.004