Xiangyu Wang | Kang Cao*![]()
© 2023 IIETA. This article is published by IIETA and is licensed under the CC BY 4.0 license (http://creativecommons.org/licenses/by/4.0/).
OPEN ACCESS
With the continuously increasing requirement of data processing speed, it is more and more suitable for images to be processed on cloud computing platform with distributed parallel computing. Therefore, this paper studied the rapid classification of massive images based on cloud computing platform. The multi-mode information fusion of massive images was carried out, which gave the implementation steps of the proposed massive image fusion method based on information complementation. This paper proposed to classify the massive images based on salient interactive feedback network. The model constructed in this paper not only simplified the complicated network parameter initialization and tuning process, but also avoided the classification failure caused by the scarcity of labeled images, which is more suitable for application and practical application scenarios. The experimental results verified the effectiveness of the constructed model in rapidly classifying massive images.
cloud computing, massive images, rapid image classification
With the progress of information technology and the rapid development of image data acquisition technology, a large amount of multimedia data is generated every day in all walks of life, among which digital image data accounts for a large part [1-6]. Face with the explosive growth of digital image data, the traditional stand-alone mode of image processing has exposed many problems, such as slow processing speed and poor concurrency, etc. [7-12]. Therefore, the traditional image processing mode has gradually failed to meet the needs of users. Now it is particularly necessary to seek a new and efficient image processing mode [13-20]. As a new calculation pattern, cloud computing is a typical distributed and parallel computing model, which can greatly shorten the execution time of computing tasks. With the continuously increasing data processing speed requirements, it is more and more suitable to process images on cloud computing platform with distributed parallel computing.
With the advent of the era of big data, various types of image data has been growing explosively. The traditional image classification algorithm has low efficiency and accuracy problems, which can not meet the processing requirements of massive image data. For the above problems, Wang et al. [21] proposed a massive image classification method based on parallel hybrid classifier algorithm, which combined Adaboost algorithm with Radial Basis Function (RBF) algorithm, and incorporated multiple RBF classifiers into a strong classifier. In addition, MapReduce parallel programming model was used to parallelize the Adaboost RBF algorithm. The performance test results showed that the algorithm met the automatic classification needs of massive images. For the problem of low image classification performance in single-node computing model, Hu et al. [22] integrated the gray level with image texture using Gray Level Concurrence Matrix (GLCM), and designed a MapReduce-based parallel fuzzy C-means clustering method, which improved the real-time classification performance of massive images. The results showed that this method had high real-time processing efficiency in massive image classification. The cloud computing platform, which has achieved excellent commercial results, was used for parallel classification processing of massive remote sensing data, which met the requirements of improving the parallel processing efficiency. Feng and Wu [23] aimed to study the application of distributed cloud computing architecture in big data-based hyperspectral remote sensing image classification. The co-authors described related cloud computing technologies, and proposed Spatial Correlation regularized Sparse Representation Classification (SCSRC) model of sparse representation classification method based on spatial correlation constraints. In addition, the co-authors proposed a distributed classification algorithm DP-SCSRC on Spark platform based on spatial correlation constraint sparse representation by analyzing the principle and the solving method of the SCSRC model, and designed optimization methods for the core steps. Thakur and Pillai [24] proposed that these methods showed some limitations when the input images contained a large amount of noise contents and fuzzy degrees, such as unsatisfactory image classification results and low accuracy. Then the co-authors analyzed and summarized various image classification technologies.
In conclusion, the application of distributed parallel processing technology to massive image processing will become an important research direction. As a typical distributed and parallel computing mode, cloud computing has efficient computing processing ability, which greatly shortens the execution time of computing tasks. With the need for continuous increase of data processing speed, it is more and more suitable for images to be processed on cloud computing platform with distributed parallel computing. Therefore, this paper did research on the rapid classification of massive images based on cloud computing platform. The second part of the paper presented the multi-mode information fusion of massive images, and gave the implementation steps of the proposed massive image fusion method based on information complementation. For the massive image classification tasks, the third part of the article proposed to classify the massive images based on the salient interactive feedback network. The constructed model not only simplified the complicated network parameter initialization and tuning process, but also avoided the classification failure caused by scarce labeled images, which is more suitable for application and practical application scenarios. The experimental results verified the model was effective in rapid massive image classification.
Image fusion of multi-mode information refers to processing the image data of the same target, collected from multi-source channels, based on image processing and computer technology, as well as extracting the favorable information in each channel to the maximum and synthesizing it into high-quality images. Image fusion is of great significance to simplify the processing process of massive images one by one, and at the same time can effectively improve the utilization rate of massive image information, improve the accuracy and reliability of computer interpretation, and increase the spatial and spectral resolution of the original images, which is more suitable for processing scenarios of massive monitoring images. Therefore, this paper proposed a massive image fusion method based on information complementation before rapidly classifying the massive images on cloud computing platform. The implementation steps of this method were described in detail below:
STEP 1: Let g(a, b) be the image to be fused and P be the blank image used to store the fused image, then g(a, b) was mapped to the H channel of IHS space of image P based on the following formula:
$H(a, b)=0.03^* g(a, b)$ (1)
In the above formula, a coefficient 0.03 was set to ensure that H value did not change too much when the gray level g(a, b) changed.
STEP 2: Let l be the coefficient used to adjust the color saturation of the fused image, then g(a, b) was mapped to the S channel of IHS space of image P based on the following formula:
$S=\left\{\begin{array}{l}l^* g(a, b), g(a, b) \leq 127 \\ l^*(255-g(a, b)), g(a, b)>127\end{array}\right.$ (2)
In order to ensure the harmony between image colors, the l value should not be too large, and about 1.5 was appropriate.
STEP 3: In order to obtain an effective edge brightness image h(a, b), the edge detection operator was used to operate another image to be fused, and mapping to the I channel of IHS space of image P based on the following formula was:
$I=h(a, b)$ (3)
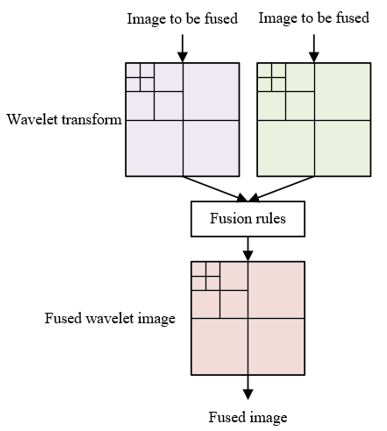
STEP 4: Corresponding wavelet domain image was obtained through wavelet decomposition of two images to be fused and the fused image. Figure 1 shows the generation process of wavelet domain image. Then wavelet low frequency was extracted for the HIS image of the fused image, with the corresponding low frequency coefficient represented by KKmj. The maximum value of high frequencies in the three images was taken. Let FKmj, KFmj and FFmj be wavelet coefficients in the three directions, respectively, and S, U, P and G be the subscripts of the two images to be fused, the fused image in IHS space and the final fused image, respectively, then:
KKGj=KKPj (4)
FKGj=max(||FKSj|,|FKUj|,|FKPj|) (5)
KFGj=max(||KFSj|,|KFUj|,|KFEj|) (6)
FFGj=max(||FFSj|,|FFUj|,|FFEj|) (7)
STEP 5: The final fused image was obtained through inverse wavelet transform. Figure 2 shows the fusion process of massive images.
Figure 1. Generation process of wavelet domain image
Figure 2. Fusion process of massive images
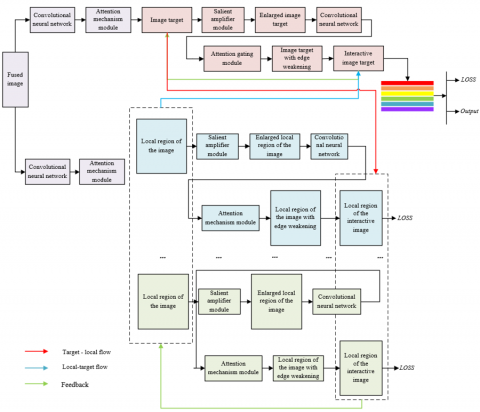
Figure 3. Classification model framework of massive images
For the tasks of classifying massive images, this paper proposed to classify them based on salient interactive feedback network. The network model mainly aimed to train a massive image classification model by combining the interaction with the feedback between the image target and the salient local region of the image. Figure 3 shows the framework of massive image classification model. Compared with the traditional classification model, this model not only simplified the complicated network parameter initialization and tuning process, but also avoided the classification failure caused by the scarcity of labeled images, showing it is more suitable for application and practical application scenarios.
The model set the salient feature extraction and refinement modules, which were used to capture the salience of image target and local region of the image and refine the extracted salient feature. Let V and U be the height and width of the input image, F, Q and D be the height, width and channel number of the corresponding feature map, respectively, Qd be the trainable parameter in the convolutional neural network and * be the convolution, pooling and activation operation. In the salient feature extraction module, $S Q \in R^{V \times U \times 3}$, the given image fused in the previous section, was input into the pre-trained convolutional neural network to extract the primary feature $G \in R^{F \times Q \times 3}$. The following formula showed the extraction process of G:
$G=Q_d * S Q$ (8)
In order to obtain better extraction effects of salient feature, this paper explored the image target and candidate local region of the image in SQ using 1×1 convolution kernel, and represented the exploration region through the class activation map $X \in R^{F \times Q \times D}$. Let Qg be the trainable parameter in the 1×1 convolution kernel, then:
$X=Q_g * G$ (9)
In order to generate the class activation map and cover the expected discriminative region as much as possible, this paper generated the class activation map based on top- k average activation operation, and adjusted the response of the class activation map channel to different regions using the weight b, generated by the function softmax. Let bi be the weight of the i-th channel and Xx be X after global average pooling operation, then the following formula gave the expression of the weight vector b=[b1, b2,..., bi,..., bD]:
$b_i=\frac{\exp \left(X_{x(i)}\right)}{\sum_{i=1}^D \exp \left(X_{x(i)}\right)}$ (10)
Due to b representing the discrimination of X, the salient feature extraction module adjusted the influence of class activation map on the exploration region using b. Initial attention map $N \in R^{F \times Q \times D}$, which balanced the coverage region and the discrimination ability of these regional features, was built through channel weighting of X, that is:
$N=b \otimes X$ (11)
In order to obtain a complete salient image target, this paper designed an image target flow, which focused on the region related to semantics of the image target. Let Xi be the weight of the class activation map in the i-th channel and the cross-channel average pooling of X was performed, then:
$R=\frac{\sum_{i=1}^D X_i}{D}$ (12)
In order to make full use of R, this paper also constructed an attention gating sub-module to locate the region related to the image target. In order to meet the functional requirements of both capturing the spatial relationship in the image and extracting the region highly responsive to the final classification, this module needed to include the attention sub-module shown in the following formula. Let $N_x \in R^{F \times Q}$ be the attention map with context and Qr and Qx be the learnable parameters corresponding to the two convolution layers contained in the attention sub-module, then:
$N_x=\operatorname{sigmoid}\left(Q_x \cdot \tanh \left(Q_r \cdot R\right)\right)$ (13)
Let $N_t \in R^{F \times} Q$ be the attention map saliently related to the image target and Gtr be the salient feature related to semantics of the image target. This module summarized the features of the fused image in each channel direction, and Nt and Gtr were obtained by processing the summary $N_{\text {Total }} \in R^{F \times Q}$ using the gating sub-module. The following gave the corresponding calculation formula:
$N_t=\operatorname{sigmoid}\left(Q_n \cdot \tanh \left(\left(Q_m \cdot N_x\right) \otimes N_{s u m}\right)\right)$ (14)
$G_{t r}=X \otimes N_t$ (15)
In order to extract the salient feature of local region of the image, a local flow was set up to learn from multiple detectors, which could perceive the whole local region. Therefore, by taking into consideration the maximum response of different channels in the fused image, which reflected the most discriminative local region in different channels, the coordinates of each local region were represented as {(a1, b1), (a2, b2), (ai, bi), (am, bm)}, where (ai, bi) are the coordinates of the i-th local region in the fused image, and m is the number of detected local regions. Let QE and Qs be the parameters of the two convolution layers and $N_{e(i)} \in R^{F \times Q}$ be the attention map of the i-th channel. Similarly, the attention map $N_E \in R^{F \times Q \times m}$ related to local semantics in local flow could be obtained by the following formula:
$N_E=\operatorname{sigmoid}\left(Q_s \cdot \operatorname{tabh}\left(Q_E \cdot N_{\text {norm }}\right)\right)=\left\{N_{e(1)}, N_{e(2)}, \ldots, N_{e(i)}, \ldots, N_{e(m)}\right\}$ (16)
The extraction of local salient features included two steps: initializing the flow parameters and adjusting the parameters with the activation ratio. Let Ne be m attention maps related to local semantics and Ger=[Ger(1), Ger(2), ..., Ger(m)] be the generated salient features related to local semantics, and Ger contained m local salient features, then the specific calculation formula was as follows:
$G_{e r}=X \otimes N_e$ (17)
The design of salient feature refinement module aimed to refine the salient features of the image target and local region of the image, and synthesize them into advanced features with discrimination, which was conducive to the rapid recognition of massive images. Specifically, the salient amplifier module was introduced to generate image target and its local region based on salient amplification. Then the attention gating sub-module and the attention sub-module were used to locate the image target and its local region, and the target-level and local-level salient amplification features were generated.
Let Gtr be the target-level salient amplification feature, Ge be the local-level salient amplification feature, and $N_{e x} \in R^{F \times Q \times m}$ and $G_{e f} \in R^{D \times m}$ be the local attention map and its advanced feature, respectively. In order to locate each independent local region in the image target, this paper modeled the similarity between Gtr and Ge in the image target flow and the local flow, and guided Ge to be constrained in the image target. Let Qt, Ql and Qk be the learnable weight parameters, respectively, then:
$N_{e x}=\operatorname{sigmoid}\left(Q_k \cdot \tanh \left(Q_t \cdot G_{t r}+Q_l \cdot G_e\right)\right)$ (18)
$G_{e f}=G_e \otimes M_{e x}$ (19)
The salient features of all local regions in Ger were supplemented further in the local-image target flow. The Ger(l) and Gt of each local region were integrated in the form of Ger(l)⨂Gt to generate the advanced feature $G_{t f} \in R^{D \times m}$ of the image target. Let h(*) be the global maximum pooling and then:
$G_{t f}=\left(\begin{array}{l}h\left(G_{e r(1)} \otimes G_t\right) \\ h\left(G_{e r(2)} \otimes G_t\right) \\ \vdots \\ h\left(G_{e r(m)} \otimes G_t\right)\end{array}\right)$ (20)
In order to optimize the advanced features generated, the network information affecting the optimization effects of salient feature was readjusted in the back-propagation form layer by layer. This paper proposed a comprehensive calibration loss LsKr, which realized the construction of feedback between advanced feature and salient feature. Let Kx and Kg be the attention and feature calibration loss functions, respectively, then, Kr, which could achieve the calibration salient feature, was calculated by the following formula:
$K_r=K_x+K_g$ (21)
Let nex(i,j) and ne(i,j) be the elements in the attention map corresponding to Nex and Ne of each local region, respectively, and ntx(i,j) and nt(i,j) be the elements in the attention map corresponding to Ntx and Nt of the image target, respectively, then Kx was represented as:
$\begin{aligned} & K_x\left(N_{e x}, N_e\right)=\sum_{i, j=1}^{(F, O)}\left\|n_{e x}(i, j)-n_e(i, j)\right\|^2 \\ & K_x\left(N_{t x}, N_t\right)=\sum_{i, j=1}^{(F, Q)}\left\|n_{t x}(i, j)-n_t(i, j)\right\|^2\end{aligned}$ (22)
In addition, in order to achieve the goal of salient feature gradually approaching the advanced feature, this paper set the Hellinger distance between them as the feature calibration penalty term. Let Ger(j) and Gef(j) be the salient feature and advanced feature of each local region on the j-th feature channel, respectively, Gtr(j) and Gtf(j) be the salient feature and advanced feature of the image target on the j-th feature channel, respectively, and D1 and D2 be the number of feature channels of the local region and image target, respectively, then:
$\begin{aligned} & K_g\left(N_{e r}, N_{e f}\right)=\frac{1}{\sqrt{2}} \sum_{j=1}^{D_1}\left\|\sqrt{G_{e r(j)}}-\sqrt{G_{e f(j)}}\right\|_2 \\ & K_g\left(N_{t r}, N_{t f}\right)=\frac{1}{\sqrt{2}} \sum_{j=1}^{D_2}\left\|\sqrt{G_{t r(j)}}-\sqrt{G_{t f(j)}}\right\|_2\end{aligned}$ (23)
All the experiments in this paper were carried out on the same GTX1080T GPU server based on the Pytorch 1.0 framework, with 11GB random access memory. The batch processing for parameter optimization was set to 16, and the initial learning rate was set to 0.001, because mini-batch gradient descent made the constructed model obtain faster convergence speed and smaller objective function fluctuation. In order to explore the number of the optimal local regions of the image, extracted by the salient feature extraction module in the proposed model, the number of channels of the attention map related to local semantics was changed. Table 1 shows the accuracy change of the constructed model in different-source image sample sets along with the number of local regions of the image.
According to the table, the constructed model can extract more salient features of local regions of the image along with the increase of the number of channels, which facilitates the recognition and division of different local regions of the images, thus improving the accuracy and efficiency of massive image classification. The maximum value of classification accuracy was obtained when the number of the local regions in the image was seven, mainly because too many attention map feature channels led to the extraction of redundant information in the image, further affecting the accuracy of image classification.
In order to verify the performance advantages of the model built in this paper in massive image classification, the classification accuracy of different models was statistically analyzed in the experiments. The constructed model was trained only using the images and their labels in sample sets 1, 2 and 3. This paper made a contrast test between the model constructed in this paper and other models, including three strongly supervised models of R-CNN, MASK-CNN and Part-based R-CNNs and eight weakly supervised models of RA-CNN, CUNet, CDBN, ConvNet, PA-CNN, DeconvNet, MA-CNN and PMG.
In order to prove the effectiveness of the constructed model, the model was compared with eleven classic image classification models. Table 2 shows the accuracy of different models on three sample sets. The three strongly supervised models of R-CNN, MASK-CNN and Part-based R-CNNs adopted image labels, or bounding boxes, local labels and other specific labels. The eight weakly supervised models of RA-CNN, CUNet, CDBN, ConvNet, PA-CNN, DeconvNet, MA-CNN and PMG did not use additional image annotations. As can be seen from Table 2, the constructed model achieved the highest classification accuracy of massive images on three sample sets, compared with other reference models.
In the experiment, different numbers of DataNode were selected for massive image processing in order to compare the processing process of the same sample set using both single and multiple DataNode.
Table 1. Accuracy of different numbers of local regions on three sample sets
|
Number of local regions |
1 |
2 |
3 |
4 |
5 |
|
Sample set 1 |
87.2 |
87.5 |
88.1 |
88.6 |
89.2 |
|
Sample set 2 |
92.8 |
93.6 |
94.1 |
94.2 |
94.9 |
|
Sample set 3 |
91.5 |
91.7 |
92.6 |
93.1 |
93.6 |
|
Number of local regions |
6 |
7 |
8 |
9 |
10 |
|
Sample set 1 |
89.7 |
90.3 |
90.7 |
90.7 |
90.7 |
|
Sample set 2 |
95.1 |
95.3 |
94.6 |
92.6 |
91.6 |
|
Sample set 3 |
93.6 |
93.8 |
94.1 |
91.2 |
90.3 |
Table 2. Accuracy of different models on three sample sets
|
Method |
Extra label |
Sample set 1 |
Sample set 2 |
Sample set 3 |
|
R-CNN |
√ |
84.2 |
91.4 |
84.2 |
|
MASK-CNN |
√ |
87.4 |
- |
- |
|
Part-based R-CNNs |
√ |
87.6 |
93.7 |
- |
|
RA-CNN |
|
85.4 |
92.6 |
- |
|
CUNet |
|
85.9 |
92.1 |
- |
|
CDBN |
|
86.6 |
92.9 |
89.8 |
|
ConvNet |
|
87.4 |
- |
- |
|
PA-CNN |
|
87.9 |
93.2 |
- |
|
DeconvNet |
|
87.9 |
94.6 |
93.1 |
|
MA-CNN |
|
88.6 |
94.8 |
92.7 |
|
PMG |
|
89.4 |
95.2 |
93.5 |
|
The constructed model (1) |
|
87.2 |
92.7 |
91.5 |
|
The constructed model (6) |
|
90.7 |
95.5 |
94.1 |
|
The constructed model (11) |
|
90.7 |
95.5 |
94.3 |
|
The constructed model (16) |
|
90.6 |
95.4 |
94.5 |
Table 3. Time of completing sample set processing in case of different numbers of DataNode
|
Number of DataNode |
Number of file document |
Completion time (s) |
|
1 |
1 |
2345 |
|
3 |
3 |
812 |
|
5 |
5 |
4997 |
|
10 |
10 |
335 |
|
15 |
15 |
242 |
|
20 |
20 |
208 |
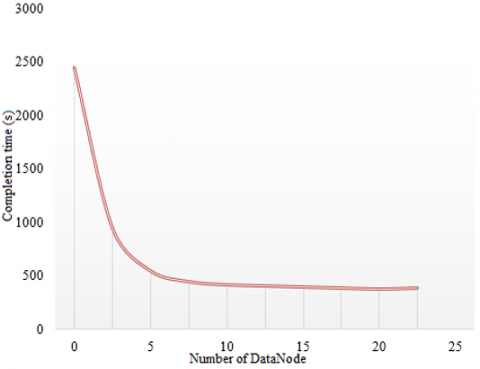
Figure 4. Variation trend of completion time in case of different numbers of DataNode
Figure 5. Percentage of time saved in case of different numbers of DataNode
Table 3 shows the time of completing sample set processing on the cloud computing platform when the number of DataNode is different. Figure 4 shows the variation trend of completion time when the number of DataNode is different. According to the table and figure, when processing the same image data, the processing efficiency of multiple DataNode was significantly better than that of single DataNode. The percentage of time saved is shown in Figure 5 when the number of DataNode is different. In addition, five DataNode nodes saved nearly 40% of the time, compared with three DataNode nodes. Ten DataNode nodes saved more than 30% of the time, compared with five DataNode nodes. Similarly, fifteen and twenty DataNode nodes saved more time. It can be seen that, with the same processing sample size, the more the number of DataNode on the cloud computing platform, the faster the image processing time.
This paper studied the rapid classification of massive images based on cloud computing platform and gave the implementation steps of the proposed massive image fusion method based on information complementation through multi-mode information fusion of the massive images. For the massive image classification tasks, this paper proposed to classify the massive images based on salient interactive feedback network. The constructed model is more suitable for application and practical application scenarios because it simplified the complicated network parameter initialization and tuning process, and avoided the classification failure caused by scarce labeled images. With the change of the number of local regions of the image, the experimental results showed the accuracy change of the constructed model in different-source image sample sets, with the constructed model obtaining the maximum classification accuracy when the number of local regions was seven. The statistic analysis results of classification accuracy of different models showed that the constructed model achieved the highest classification accuracy of massive images on three sample sets, compared with other reference models. With the same sample set, this paper compared the processing process of using both single and multiple DataNode and gave the conclusion of comparative analysis.
[1] Dadmand, B., Sadaghian, H., Khalilzadehtabrizi, S., Pourbaba, M., Shirdel, M., Mirmiran, A. (2023). Studying the compressive, tensile and flexural properties of binary and ternary fiber-reinforced UHPC using experimental, numerical and multi-target digital image correlation methods. Case Studies in Construction Materials, e01865. https://doi.org/10.1016/j.cscm.2023.e01865
[2] Deng, W. (2022). Application of partial differential equation in digital image processing technology. In Cyber Security Intelligence and Analytics: The 4th International Conference on Cyber Security Intelligence and Analytics (CSIA 2022), Cham: Springer International Publishing, 2: 967-974. https://doi.org/10.1007/978-3-030-97874-7_141
[3] Ding, Y., Wei, Y., Zhang, S., Yu, S. (2022). Digital image restoration based on multicontour batch scanning. Scanning, 2022: 8106516. https://doi.org/10.1155/2022/8106516
[4] Paul, A. (2023). Adaptive tri-plateau limit tri-histogram equalization algorithm for digital image enhancement. The Visual Computer, 39(1): 297-318. https://doi.org/10.1007/s00371-021-02330-z
[5] Lefèvre, P., Carré, P., Gaborit, P. (2019). Application of rank metric codes in digital image watermarking. Signal Processing: Image Communication, 74: 119-128. https://doi.org/10.1016/j.image.2018.12.015
[6] Jisha, T.E., Monoth, T. (2019). Authenticity and integrity enhanced active digital image forensics based on visual cryptography. In Smart Intelligent Computing and Applications: Proceedings of the Second International Conference on SCI 2018, Springer Singapore, 2: 189-196. https://doi.org/10.1007/978-981-13-1927-3_19
[7] Nie, Y., Liu, W. (2022). Distributed storage and retrieval of massive remote sensing images. In Third International Conference on Computer Science and Communication Technology (ICCSCT 2022), SPIE, 12506: 783-787. https://doi.org/10.1117/12.2662384
[8] Li, N., Zhang, H., Lv, Z., Min, L., Guo, Z. (2022). Simultaneous screening and detection of RFI from massive SAR images: a case study on European sentinel-1. IEEE Transactions on Geoscience and Remote Sensing, 60: 1-17. https://doi.org/10.1109/TGRS.2022.3191815
[9] Gao, Y., Xiao, X., Li, X., Zhu, H., Tang, J., Guo, F. (2022). Research on the stitching method of massive aerial far-infrared images with an inconsistent overlap rate. Infrared and Laser Engineering, 51(7): 20210611-1. https://doi.org/10.3788/IRLA20210611
[10] Al-Khasawneh, M.A., Uddin, I., Shah, S.A.A., Khasawneh, A.M., Abualigah, L., Mahmoud, M. (2022). An improved chaotic image encryption algorithm using Hadoop-based MapReduce framework for massive remote sensed images in parallel IoT applications. Cluster Computing, 1-15. https://doi.org/10.1007/s10586-021-03466-2
[11] Yang, X., Zhang, X., Wang, N., Gao, X. (2021). A robust one-stage detector for multiscale ship detection with complex background in massive SAR images. IEEE Transactions on Geoscience and Remote Sensing, 60: 1-12. https://doi.org/10.1109/TGRS.2021.3128060
[12] Hajjaji, Y., Boulila, W., Farah, I.R. (2021). An improved tile-based scalable distributed management model of massive high-resolution satellite images. Procedia Computer Science, 192: 2931-2942. https://doi.org/10.1016/j.procs.2021.09.065
[13] Ma, L., Qu, M., He, P. (2022). Double encryption algorithm for massive personal biometric authentication images based on chaotic mapping for future smart cities. Journal of Testing and Evaluation, 51: 3. https://doi.org/10.1520/JTE20220093
[14] Wu, H., Miao, Z., Chen, J., Zhang, Q., Xu, W. (2014). Image completion based on creative design of massive images. Optik, 125(16): 4374-4378. https://doi.org/10.1016/j.ijleo.2014.03.019
[15] Livet, F., Charnock, T., Le Borgne, D., de Lapparent, V. (2021). Catalog-free modeling of galaxy types in deep images-Massive dimensional reduction with neural networks. Astronomy & Astrophysics, 652: A62. https://doi.org/10.1051/0004-6361/202140383
[16] Wang, N., Chen, F., Yu, B., Qin, Y. (2020). Segmentation of large-scale remotely sensed images on a Spark platform: A strategy for handling massive image tiles with the MapReduce model. ISPRS journal of photogrammetry and remote sensing, 162: 137-147. https://doi.org/10.1016/j.isprsjprs.2020.02.012
[17] Wu, Y., Li, Z., Guo, Y., Zhang, S., Zhang, Z., Liu, Z., Han, X., Sun, W. (2022). Research on construction method of massive geographic image database for power grid EIA. In Advances in Smart Vehicular Technology, Transportation, Communication and Applications: Proceedings of VTCA, Springer Singapore, pp. 371-379. https://doi.org/10.1007/978-981-16-4039-1_37
[18] Parera, F., Pinyol, N.M., Alonso, E.E. (2021). Massive, continuous, and non-invasive surface measurement of degree of saturation by shortwave infrared images. Canadian Geotechnical Journal, 58(6): 749-762. https://doi.org/10.1139/cgj-2019-0051
[19] Wang, Y., Tian, Z., Hu, S. (2020). Multiscale statistical analysis of massive corrosion pits based on image recognition of high resolution and large field-of-view images. Materials, 13(21): 4695. https://doi.org/10.3390/ma13214695
[20] Liu, M., Xue, R., Li, X. (2022). Video image processing method based on cloud platform massive data and virtual reality. Mathematical Problems in Engineering, 2022: 2802901. https://doi.org/10.1155/2022/2802901
[21] Wang, M., Cheng, P., Hu, Z., Chen, H., Zhang, X., Yang, X. (2020). Research on massive image classification method based on parallel hybrid classifier algorithm. In Proceedings of the 2020 4th International Conference on High Performance Compilation, Computing and Communications, pp. 140-144. https://doi.org/10.1145/3407947.3407965
[22] Hu, J., Cheng, Q., Wen, Z. (2021). A massive images classification method based on MapReduce parallel fuzzy C-means clustering. Journal of Computational Methods in Sciences and Engineering, 21(4): 999-1011. https://doi.org/10.3233/JCM-204829
[23] Feng, K., Wu, Y. (2022). Distributed cloud computing architecture in hyperspectral remote sensing image classification under big data. In 2022 IEEE 5th international conference on information systems and computer aided education (ICISCAE), IEEE, pp. 456-460. https://doi.org/10.1109/ICISCAE55891.2022.9927624
[24] Thakur, M., Pillai, S.K. (2019). A review on various methods for classification of massive noisy image. in 2019 international conference on intelligent sustainable systems (ICISS), IEEE, pp. 525-528. https://doi.org/10.1109/ISS1.2019.8907993