Chunhui Liang* | Chao Ding | Jinfa Li | Xiaoyang Zuo
© 2022 IIETA. This article is published by IIETA and is licensed under the CC BY 4.0 license (http://creativecommons.org/licenses/by/4.0/).
OPEN ACCESS
False alarms and omissions of key measurement signals may even affect the reliability of decision-making in power IoT system, lead to safety accidents and bring huge economic losses. In order to improve the reliability of system operation and the information management level of electrical equipment, it is necessary to identify and extract suddenly changed signals from massive measurement signals collected by wireless sensor networks, and to detect the working state of electrical equipment by judging the source of signals. Therefore, this article studies the state detection method of electrical equipment based on wireless sensor network signal processing. In the second chapter, a cluster splitting and merging method is designed to solve the problem that the existing detection methods tend to ignore the imbalance of cluster size. In the third chapter, according to the data characteristics of measurement signals collected by wireless sensor networks, a similarity measurement criterion for composite time series of measurement signals is proposed, and the corresponding distance matrix is generated based on this criterion. In the fourth chapter, wavelet decomposition is used to decompose the initial measurement signals collected by wireless sensor networks, and then the signals are compressed twice based on compressed sensing. Then the abnormal signal data information is imported into support vector machine for training to realize the real-time detection of abnormal signals of electrical equipment state. Experimental results verify the effectiveness of the proposed algorithm.
wireless sensor network, signal processing, state detection of electrical equipment
Generators, transformers, power lines, circuit breakers and other electrical equipment are important components of ubiquitous power IoT [1-7]. With the improvement of information level at present, the power IoT uses wireless sensors as sensing units to build a sensing system for electrical equipment state, which is used for network fault handling or other advanced applications [8-15]. In a large number of measurement signals collected by actual wireless sensor networks, it is inevitable that there will be sudden signal changes caused by signal transmission or storage failures. False alarms and omissions of key measurement signals will even affect the reliability of decision-making of power IoT system, causing safety accidents and bringing huge economic loss [16-24]. How to distinguish and extract suddenly changed signals from massive measurement signals collected by wireless sensor networks, and how to detect the working state of electrical equipment combined with the judgment of signal sources, is of positive significance to improve the reliability of system operation and the information management level of electrical equipment.
In order to meet the needs of lean maintenance and operation & maintenance of power system and improve the utilization rate of power system data, Chen et al. [25] proposes a method of detecting equipment state in power system based on multi-source data fusion. Firstly, the article analyzes requirements of state identification and evaluation of network and equipment in power system operation. Then, the article introduces the principle of multi-source data fusion, and expounds the multi-source information sources of power system equipment. Based on association rules and entropy weight fuzzy analysis, the article proposes a method of detecting equipment state in power system, and introduces the process of evaluation and recognition. In order to achieve network loss reduction and voltage regulation, Jeong et al. [26] proposes a reactive power voltage control method based on public coupling connection (PCC) voltage and renewable generator (RG) active power. The proposed method utilizes the output information of voltage and active power at PCC, which makes it possible to reduce the network loss and improve the voltage regulation capability. In the radial feeder model of multiple RG connections, the proposed reactive power control method is simulated by using the actual solar energy output data. Yu et al. [27] firstly studies and determines which equipment failure is suitable to be predicted by using the concept of digital twinning and establishes a mathematical and physical model describing the fault or health state, which has undetermined coefficients related to the measurable state characteristics of the equipment. Then, a digital twin model is established on the basis of the mathematical and physical model, and the consistency with the equipment state is realized by adjusting the undetermined coefficients. Zhou [28] introduces the research status of diagnosis and predictive maintenance of mine electromechanical equipment, summarizes the outstanding progress and typical achievements, analyzes the existing problems and shortcomings, and finally puts forward some thoughts on the development trend of this research. Bian et al. [29] studies the implementation and application status of the intelligent IoT platform for electrical equipment, the problems existing in the implementation process, the key technologies and solutions to solve the problems, etc., which provides a good foundation for the construction and application of the intelligent IoT platform for electrical equipment and delivers reference for development.
Existing research results mainly aim at the high-voltage electrical equipment in the power IoT, the related state detection methods cannot be directly applied to low-voltage equipment with different safe power supply capabilities, and the detection effect is not ideal when there are subsets with different distribution and density in the measurement signal sample set, so it is not suitable for online monitoring of the power IoT detection signal sample set composed of high-dimensional data signals. Therefore, this article studies the state detection method of electrical equipment based on wireless sensor network signal processing. In the second chapter, a cluster splitting and merging method is designed to solve the problem that the existing detection methods tend to ignore the imbalance of cluster size. In the third chapter, according to the data characteristics of measurement signals collected by wireless sensor networks, a similarity measurement criterion for composite time series of measurement signals is proposed, and the corresponding distance matrix is generated based on this criterion. In the fourth chapter, wavelet decomposition is used to decompose the initial measurement signals collected by wireless sensor networks, and then the signals are compressed twice based on compressed sensing. Then the abnormal signal data information is imported into support vector machine for training to realize the real-time detection of abnormal signals of electrical equipment state. Experimental results verify the effectiveness of the proposed algorithm.
There is great imbalance between normal data and abnormal data in a large number of measurement signals collected by wireless sensor networks, which means that it is very difficult to extract feature information from abnormal signals. Current electrical equipment state detection methods based on clustering algorithm tend to ignore the imbalance of cluster size, and only focus on the problem of new signal partition based on density. Therefore, this article designs a cluster splitting and merging method to solve the above problem. Figure 1 shows the classification flow of newly collected signals.
Figure 1. Classification flow of newly collected signals
In the classification of newly collected signal anew, different from other methods, this article emphasizes the neighborhood information of new samples, and adds the imbalance degree to the distance calculation formula between clusters. The determination of upper and lower approximations of new signals is described in detail below:
It is assumed that the cluster i of the measurement signals collected by the wireless sensor network is represented by Di, the cluster center of the cluster i is represented by ui, the number of signals of the cluster to which the signals belong is represented by Mi, and the number of signals of all the clusters participating in the calculation is represented by M. The Euclidean distance cij from each signal object aj to the center point ui of each cluster is calculated. Choose t={i|cij=min({cij})}i=1,2...,l, if ∃t'={i'|cij/cij≤M/M-Mi·ξ,i'≠i}, aj∈Di* and aj∈Di*; otherwise aj∈Ḋi. For all clusters of measurement signals, D'i=Ḋi∪Di*.
It is assumed that the number of signals belonging to cluster i in the neighborhood signal is represented by Ai, the number of all neighborhood signals within the signal radius δ is represented by |M(ai)|δ, the distance coefficient between signals and cluster signals is represented by ∑li=1exp(-cii/2δ2denδ), and the local density of signals is represented by DUδ, which satisfies DUδ=|M(ai)|δ/δ. The following formula gives the membership calculation formula of the newly added signal anew and cluster i:
${{f}_{ij}}=\left\{ \begin{align}& \frac{{{A}_{j}}}{{{\left| M\left( {{a}_{i}} \right) \right|}_{\xi }}} \\& \cdot \sum\limits_{i=1}^{l}{\exp \left( -\frac{{{v}_{ij}}}{2{{\delta }^{2}}D{{U}_{\delta }}} \right)},{{a}_{new}}\in {{D}_{i}}^{*} \\ & 1,{{a}_{new}}\in {{{\dot{D}}}_{i}} \\\end{align} \right.$ (1)
It is assumed that the original cluster center of measurement signals collected by wireless sensor networks is represented by uo, the number of approximate signals on the cluster is represented by |D'i|, and the number of newly collected signals is represented by Anew. The following formula gives the iteration formula for updating the center of the signal cluster:
${{u}_{i}}=\left\{ \begin{align} & \frac{\begin{align} & {{u}_{o}}\times \left| {{{{D}'}}_{i}} \right| \\ & +{{\theta }_{y}}\times \sum\nolimits_{{{a}_{new}}\in {{{\hat{D}}}_{i}}}{{{f}_{ij}}\times {{a}_{new}}} \\\end{align}}{\left| \overline{{{D}_{i}}} \right|+{{a}_{new}}},{{a}_{new}}\in {{D}_{i}}^{*} \\ & \frac{\begin{align} & {{u}_{o}}\times \left| {{{{D}'}}_{i}} \right| \\ & +\sum\nolimits_{{{a}_{new}}\in {{D}_{i}}}{{{f}_{ij}}\times {{a}_{new}}} \\\end{align}}{\left| {{{{D}'}}_{i}} \right|+{{a}_{new}}},{{a}_{new}}\in {{{\dot{D}}}_{i}} \\\end{align} \right.$ (2)
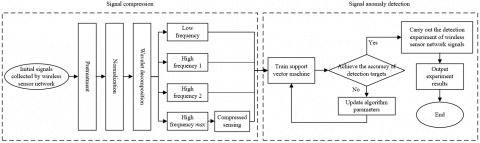
After completing the classification of new measurement signals collected by wireless sensor networks, this article proposes a clustering-based electrical equipment state detection method. Firstly, according to the data characteristics of measurement signals collected by wireless sensor networks, this article proposes a similarity measurement criterion for composite time series of measurement signals, and generates the corresponding distance matrix based on this criterion. In order to save the node energy of wireless sensor networks and improve the detection efficiency of abnormal signals, this article uses wavelet decomposition to triple decompose the initial measurement signals collected by wireless sensor networks, and carries out secondary compression based on compressed sensing to fully retain the characteristic information of abnormal signals. Finally, the abnormal signal data information is imported into support vector machine for training to obtain the final electrical equipment state detection model is obtained, which realizes the real-time detection of abnormal signals of electrical equipment state. Figure 2 shows the similarity measurement flow of time series of collected signals.
The following formula gives the time series expression of measurement signals of two wireless sensor network nodes Ai and Aj in the power IoT at O time:
$\begin{align} & {{A}_{i}}=\left\{ {{A}_{i,1}},{{A}_{i,2}},...,{{A}_{i,o}} \right\} \\ & {{A}_{j}}=\left\{ {{A}_{j,1}},{{A}_{j,2}},...,{{A}_{j,o}} \right\} \\\end{align}$ (3)
Assuming that the difference of probability distribution between Ai and Aj is represented by CJS, the amplitude similarity between Ai and Aj is represented by CAM, and the error pattern distance between Ai and Aj is represented by CFM, the following formula gives the similarity measurement criterion expression for measurement signal time series:
${{C}_{i,j}}=dist\left( {{A}_{i}},{{A}_{j}} \right)=\frac{1}{4}{{C}_{jsd}}+\frac{1}{2}{{C}_{edc}}+\frac{1}{4}{{C}_{mis}}$ (4)
CJS can be calculated by JS divergence. Let the sample-based probability density function estimation of signal flow of wireless sensor network nodes Ai and Aj be represented by Ei=Ei(g) and Ej= ej(g), respectively. The following formula gives the calculation formula of CJS:
$\begin{align} & {{C}_{KL}}\left( {{E}_{i}}||{{E}_{j}} \right)=\sum\limits_{i}{{{E}_{i}}\left( g \right)}\ln \frac{{{e}_{i}}\left( g \right)}{{{E}_{j}}\left( g \right)} \\ & N=\frac{1}{2}\left( {{E}_{i}}+{{E}_{j}} \right) \\ & {{C}_{JS}}=\frac{1}{2}{{C}_{KL}}\left( {{E}_{i}}||N \right)+\frac{1}{2}{{C}_{KL}}\left( {{E}_{j}}||N \right) \\\end{align}$ (5)
Amplitude similarity CAM can be calculated by Euclidean distance:
${{C}_{edc}}=\left\| {{A}_{i}}-{{A}_{j}} \right\|={{\left( \sum\limits_{m=1}^{o}{{{\left( {{a}_{i,m}}-{{a}_{j,m}} \right)}^{2}}} \right)}^{\frac{1}{2}}}$ (6)
When the sampled signal flow of a wireless sensor network node has an erroneous measurement value less than 0 or a signal missing, it is determined that the signal’s time series has a basic error pattern. The error mode distance CFM is calculated as follows:
$\psi_i=\left\{\begin{array}{l}1, i f \exists a \in\{1, \ldots, o\}, g_{i, l}<0 \vee g_{i, a}=N a N \\ 0, \text { Other }\end{array}\right.$
$C_{F M}=\left\{\begin{array}{l}0, \text { if } \psi_i=\psi_j \\ 1, \text { Other }\end{array}\right.$ (7)
Figure 3 shows the algorithm flow of abnormal signal detection. Assuming that the initial signal collected by the wireless sensor network with the event sequence P to be processed is RN×M, that’s, the signals collected by N wireless sensor network nodes at M time points, RN×M is decomposed by db1 wavelet, and the decomposition steps are described in detail below:
STEP1: Based on Mallat algorithm, the signal collected by wireless sensor network is decomposed in db1 wavelet domain. Assuming that the low-pass filter coefficients corresponding to db1 wavelet function are represented by Rβ,K(m), the high-pass filter coefficients corresponding to db1 wavelet function are represented by Rβ,F(m), and the number of decomposition layers is represented by β, the wavelet low-frequency coefficients and high-frequency coefficients obtained by decomposition are characterized by the following formula:
$\left\{ \begin{align} & {{R}_{\beta ,K}}\left( m \right)=\sum\limits_{L=0}^{L-1A}{{{R}_{\beta -1,K}}\left[ 2m-l \right]h\left[ l \right]} \\ & {{R}_{\beta ,F}}\left( m \right)=\sum\limits_{L=0}^{L-1A}{{{R}_{\beta -1,F}}\left[ 2m-l \right]f\left[ l \right]} \\\end{align} \right.$ (8)
The initial signals collected by wireless sensor network are calculated with high-pass filtering and low-pass filtering respectively. The following formula gives the expressions of the first layer low-frequency components and the first layer high-frequency components generated by the operation:
${{K}_{1}}\left( {{R}_{N\times M}} \right)={{R}_{N\times M}}\cdot {{R}_{\beta ,K}}\left( m \right)$ (9)
${{F}_{1}}\left( {{R}_{N\times M}} \right)={{R}_{N\times M}}\cdot {{R}_{\beta ,F}}\left( m \right)$ (10)
Figure 2. Similarity measurement flow of time series of collected signals
Figure 3. Algorithm flow of abnormal signal detection
The second layer decomposition of the signals can be obtained by performing K1(RN×M) with high-pass filtering and low-pass filtering again.
The accuracy of abnormal signal detection has a great relationship with the number of wavelet decomposition layers. If the number of layers is too less, the complete characteristics of abnormal signals cannot be distinguished, and if the number of layers is too more, the detection efficiency of the algorithm is too low. After completing the convolution calculation with high-pass filtering and low-pass filtering, the obtained low-frequency components and high-frequency components need to be down-sampled with a coefficient of 2, and the length of the down-sampled signals is shortened to 1/2 of the original signal. In order to obtain an effective down-sampling signals, the signals collected by wireless sensor networks cannot be decomposed infinitely. Assuming that the maximum decomposition layers is represented by SPmax, the downward integer function is represented by FL, and the low-pass filter length is represented by K, the following formula gives the calculation formula of wavelet decomposition layers:
$S{{P}_{\max }}=FL\left( {{\log }_{2}}\left( M/\left( K-1 \right) \right) \right)$ (11)
STEP2: After wavelet decomposition of SPmax layer, the initial sample set of signals collected by wireless sensor networks can be expressed by the following formula:
${{\bar{R}}_{N\times M}}={{F}_{1}}\left( m \right)+{{F}_{2}}\left( m \right)+{{F}_{3}}\left( m \right)+{{K}_{3}}\left( m \right)$ (12)
STEP3: After wavelet decomposition of SPmax layer, the signals collected by wireless sensor network can be divided into two parts: low-frequency components containing normal signal information and high-frequency components containing abnormal characteristics. For low-frequency components K3(m), then:
$\xi ={{\psi }^{T}}{{K}_{3}}\left( m \right)$ (13)
Because the sparse low-frequency components containing normal signal information can be compressed by compressed sensing, this article compresses K3(m) twice based on compressed sensing.
STEP4: Assuming that the observation matrix is represented by ψ, K3(m) is observed based on ψ, and the compressed measurement value b is obtained:
$b=\kappa {{K}_{3}}\left( m \right)=\kappa \psi \xi =\Omega \xi $ (14)
After completing the secondary compression of the low-frequency components collected by the wireless sensor network, the initial signals collected by wireless sensor network becomes a set composed of high-frequency components and compressed low-frequency components, and the representation is given by the following formula:
$\begin{align} & {{R}_{N\times M}}^{*}={{F}_{1}}\left( m \right)+{{F}_{2}}\left( m \right)+{{F}_{3}}\left( m \right) \\ & +\cdots +{{F}_{\max }}\left( m \right)+b \\\end{align}$ (15)
In order to facilitate further research, this article directly uses the constructed set for the training set of detecting abnormal signal time series. After many times of wavelet decomposition, the time and node of abnormal value in the initial signals collected by wireless sensor networks can be judged by the modulus maximum of wavelet transform, which fully preserves the abnormal feature information in the collected signals.
Assuming that the abnormal signals contained in the signal set RN×M* in Formula 15 is represented by F(m), the normal signal by b, and the two kinds of signal components are labeled, the signal set at this time can be represented as R*={(Ri,Bi)}, where Bi satisfies Bi∈{+1,-1}. The following steps for detecting abnormal signals collected by wireless sensor networks are described in detail as follows:
STEP1: Classify the collected signals of wireless sensor networks by using the super-plane of support vector machine;
$\left\{ \begin{align} & \theta \cdot \bar{R}+y=0 \\ & {{B}_{i}}\left( \theta \cdot \bar{R} \right)+y\ge 1 \\\end{align} \right.$ (16)
Then, the objective function is optimized for the secondary times to obtain the optimal hyper-plane. Assume δi≥0,i=1,2,..k, the relaxation variable is represented by δ and the penalty coefficient is represented by d, then:
$\left\{ \begin{align} & \min \left( \frac{1}{2}{{\left( \left\| \theta \right\| \right)}^{2}}+d\times \sum\limits_{i=1}^{m}{{{\delta }_{i}}} \right) \\ & s.t{{B}_{i}}\left[ \left( \theta \cdot \bar{R} \right)+y \right]>1-{{\delta }_{i}} \\\end{align} \right.$ (17)
Let the Lagrange multiplier be represented by ηi(i = 1,2, ... k), then the dual formal expression of the optimal hyper-plane is as follows:
$\left\{ \begin{align} & \max \sum\limits_{i=i}^{k}{{{\eta }_{i}}-\frac{1}{2}\sum\limits_{i=1}^{m}{{{b}_{i}}}{{b}_{j}}{{\eta }_{i}}{{\eta }_{j}}L\left( {{A}_{i}},{{A}_{j}} \right)} \\ & s.t\sum\limits_{i=i}^{k}{{{\eta }_{i}}{{b}_{i}}=0\left( 0\le {{\eta }_{i}}\le d,i=1,2,..,k \right)} \\\end{align} \right.$ (18)
STEP2: The signal samples collected by the wireless sensor network to be tested are imported into the support vector machine for training, and the category of the signals is further judged through the calculation of the following formula:
$L\left( {{R}_{i}},\bar{R} \right)=\exp \left( -{{\left\| {{R}_{i}}-\bar{R} \right\|}^{2}}/2{{\xi }^{2}} \right)$ (19)
The decision-making function of support vector machine is expressed by the following formula:
$G(a)=\operatorname{sgn}\left[\left(\sum_{i=1}^k \partial_i b_i\right) L\left(R_i, R_j\right)+y\right]$ (20)
STEP3: Based on the above formula, the clustering boundary is determined, and then the distance from the signal collected by the wireless sensor network to the boundary line is calculated to further realize its classification.
Based on all the research schemes, the following steps for electrical equipment state detection algorithm can be obtained:
STEP1: Cluster the ne signals collected by wireless sensor networks according to the judgment standard of the upper and lower approximation of the newly collected signals;
STEP2: Based on the similarity measurement criterion for the composite time series of measurement signals, process the time series of new signals collected by wireless sensor network and generate the corresponding distance matrix;
STEP3: Use Mallat algorithm to decompose the time series of new signals collected by wireless sensor network in wavelet domain to obtain low-frequency signals and high-frequency signals;
STEP4: Until the wavelet decomposition of the SPmaxlayer is completed, a plurality of groups of high-frequency signals F1(m),F2(m),…Fmax(m) and a group of low-frequency signals are obtained, and the obtained low-frequency signals are compressed to obtain an observation value b;
STEP5: Label the obtained normal signals and abnormal signals with {+1, -1};
STEP6: The new labeled signals collected by wireless sensor networks are imported into support vector machine for training to obtain the final electrical equipment state detection model.
1)
2) Data source 2
Figure 4. Abnormal signal detection accuracy and F1 value
In order to compare and analyze the performance differences between the electrical equipment state detection algorithm proposed in this article and the commonly used detection algorithms, the optimal detection performance of this algorithm in different signal sample sets collected by wireless sensor networks is selected, and compared with the widely used K-means algorithm and DBSCAN algorithm. The comparison results are shown in Figure 4. It can be seen from the figure that the algorithm in this article has good abnormal signal detection performance in three sample sets: generator, transformer and circuit breaker, with an average accuracy rate of 95.67%, especially in the circuit breaker measurement signal sample set with strong fluctuation. The accuracy of this algorithm is 0.5% ~ 2.5% higher than K-means algorithm and DBSCAN algorithm. In terms of F1 value, the proposed algorithm is 0.2% ~ 1.9% higher than K-means algorithm and DBSCAN algorithm.
In order to further verify the effectiveness of the proposed electrical equipment state detection algorithm, which adopts the classification of newly collected signals and the similarity measurement of time series of collected signals, the article calculates and compares the error evaluation indexes of different models. Tables 1-3 show the performance index comparison results of different models on three sample sets: generators, transformers and circuit breakers.
Table 1. Error performance indexes of generators with different models
|
Model |
MAE |
MAPE(%) |
RMSE |
|
DBSCAN algorithm |
0.34 |
0.79 |
0.42 |
|
K-means algorithm |
0.12 |
0.24 |
0.19 |
|
The algorithm (1) |
0.07 |
0.19 |
0.13 |
|
The algorithm (2) |
0.05 |
0.15 |
0.12 |
|
The algorithm |
0.04 |
0.11 |
0.08 |
Table 2. Error performance indexes of transformers with different models
|
Model |
MAE |
MAPE(%) |
RMSE |
|
DBSCAN algorithm |
0.16 |
0.33 |
0.19 |
|
K-means algorithm |
0.17 |
0.35 |
0.22 |
|
The algorithm (1) |
0.07 |
0.14 |
0.11 |
|
The algorithm (2) |
0.11 |
0.23 |
0.12 |
|
The algorithm |
0.06 |
0.12 |
0.11 |
Table 3. Error performance indexes of circuit breakers with different models
|
Model |
MAE |
MAPE(%) |
RMSE |
|
DBSCAN algorithm |
0.19 |
0.41 |
0.22 |
|
K-means algorithm |
0.16 |
0.33 |
0.21 |
|
The algorithm (1) |
0.11 |
0.24 |
0.17 |
|
The algorithm (2) |
0.04 |
0.08 |
0.10 |
|
The algorithm |
0.04 |
0.12 |
0.11 |
It can be seen from the tables that compared with the algorithm in this article, K-means algorithm and DBSCAN algorithm, the detection accuracy of K-means algorithm and DBSCAN algorithm for the operation state of generators, transformers and circuit breakers is less than that proposed in this article, so it is more accurate to choose this algorithm as the state detection algorithm of electrical equipment. Compared with the algorithm (1) without classification of newly collected signals, the error index results of the complete algorithm in this article are different. The main reason is that the algorithm in this article fully considers the imbalance of cluster size, and screening input features by cluster splitting and merging is helpful to improve the accuracy of the model. Compared with the algorithm (2) without similarity measurement, the complete algorithm in this article also has some differences in error index results. The main reason is that this article uses wavelet decomposition to decompose the initial measurement signals and compress the signal for the secondary time, which fully preserves the abnormal signal characteristic information, saves the node energy of wireless sensor network and improves the model accuracy.
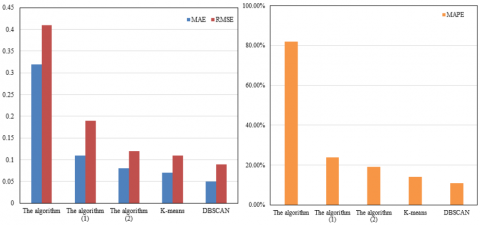
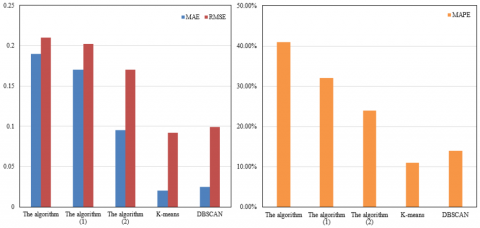
The model in this article has excellent performance on the measurement signal sample set of generators, transformers and circuit breakers, which shows that the state detection results of the model will be improved by classifying the newly collected signals and measuring the similarity. In order to visually show the error difference, the error performance index is drawn as a histogram, as shown in Figures 5, 6 and 7. To sum up, the model in this article is suitable for state detection of electrical equipment.
Figures 8 and 9 show the variation trend of abnormal or alarm detection times for state evaluation of components included in different units. It can be seen from the figures that there are relatively many abnormal state and alarm times of large units due to short circuit accidents, disconnection accidents, grounding accidents and leakage accidents. Based on the analysis of the operating characteristics of the components of large-scale units, the frequent start-up and shutdown during the operation of the units will accelerate the performance and structural aging and functional failure of the key components of the units to a certain extent. Therefore, the abnormal or alarm detection times of the electrical equipment state detection algorithm proposed in this article reflect the performance and structure state of the key components of the units to a certain extent.
Figure 5. Error performance index of generators with different models
Figure 6. Error performance index of transformers with different models
Figure 7. Error performance index of circuit breakers with different models
Figure 8. Statistics of Unit 1 evaluation results
Figure 9. Statistics of Unit 1 evaluation results
This article studies the state detection method of electrical equipment based on wireless sensor network signal processing. In the second chapter, a cluster splitting and merging method is designed to solve the problem that the existing detection methods tend to ignore the imbalance of cluster size. In the third chapter, according to the data characteristics of measurement signals collected by wireless sensor networks, a similarity measurement criterion for composite time series of measurement signals is proposed, and the corresponding distance matrix is generated based on this criterion. In the fourth chapter, wavelet decomposition is used to triple decompose the initial measurement signals collected by wireless sensor networks, and then the signals are compressed twice based on compressed sensing. Then the abnormal signal data information is imported into support vector machine for training to realize the real-time detection of abnormal signals of electrical equipment state. Combined with experiments, this article compares the performance difference between the proposed state detection algorithm and commonly used detection algorithms and verifies that the proposed algorithm has better abnormal signal detection performance on three sample sets: generators, transformers and circuit breakers. It shows the performance index comparison results of different models on the sample set, and verifies that the state detection effect of the model will be improved by classifying the newly collected signals and measuring the similarity. The article provides the variation trend of abnormal or alarm detection times of components in different units, which verifies that the model in this article is suitable for electrical equipment state detection.
The authors gratefully acknowledge the support of Project of Science and Technology Department of Jilin Province (Grant No.: 20200403143SF).
[1] Zhou, J., Wu, Q., Li, J., Li, J. (2022). Dynamic encryption of power internet of things data based on national secret algorithm. In International Conference on Artificial Intelligence and Security, Qinghai, China, pp. 496-506. https://doi.org/10.1007/978-3-031-06791-4_39
[2] Zhou, J., Wu, Q., Li, J., Li, J. (2022). Dynamic encryption of power internet of things data based on national secret algorithm. In International Conference on Artificial Intelligence and Security, Qinghai, China, pp. 518-528. https://doi.org/10.1007/978-3-031-06791-5_28
[3] Yang, W., Liu, W., Cui, H., Wei, X., Huang, H., Liao, P., Qian, Z., Wang, Y. (2022). SG-Edge: Key technology of power internet of things trusted edge computing framework. Journal of Software, 33(2): 641-663. https://doi.org/10.13328/j.cnki.jos.006154
[4] Ge, Y., Wang, Y., Cheng, Y. (2022). Edge task offloading method for power internet of things based on multi-round combined auction. In Proceedings of the 11th International Conference on Computer Engineering and Networks, Singapore, pp. 31-41. https://doi.org/10.1007/978-981-16-6554-7_4
[5] Qin, J., Yang, M., Lu, Y., Wang, Z., Hu, C. (2022). Research on three-dimensional geometry-based channel modeling for power internet of things communications. Journal of Electronics and Information Technology, 44(9): 3051-3057. https://doi.org/10.11999/JEIT211300
[6] Liu, D., Liang, H., Zeng, X., Zhang, Q., Zhang, Z. (2022). Edge computing application, architecture, and challenges in ubiquitous power Internet of Things. Frontiers in Energy Research, 10: 850252. https://doi.org/10.3389/fenrg.2022.850252
[7] Xu, H., Sun, X., Ying, J.Y., Niu, Q.L. (2022). Design and application of security monitoring system for perception terminal of power internet of things. In IoT and Big Data Technologies for Health Care, Virtual Event, pp. 373-385. https://doi.org/10.1007/978-3-030-94185-7_25
[8] Liu, J., Zhao, Z., Ji, J., Hu, M. (2020). Research and application of wireless sensor network technology in power transmission and distribution system. Intelligent and Converged Networks, 1(2): 199-220. https://doi.org/10.23919/ICN.2020.0016
[9] Robinson, C.A., Nieman, B.T., Craven, R., Bima, M.E., Van Neste, C.W. (2020). Development of a wireless power transmission system for agriculture sensor devices. In 2020 IEEE International Conference on Big Data (Big Data), Atlanta, GA, USA, pp. 2360-2364. https://doi.org/10.1109/BigData50022.2020.9377855
[10] Zabasta, A., Kunicina, N., Vitols, K., Duritis, I., Grunde, U., Judvaitis, J., Galkins, I. (2019). Low-power wireless sensor network system for early diagnostic of subacute rumen acidosis in cows. In 2019 IEEE 7th IEEE Workshop on Advances in Information, Electronic and Electrical Engineering (AIEEE), Liepaja, Latvia, pp. 1-6. https://doi.org/10.1109/AIEEE48629.2019.8977012
[11] Cheng, L. (2020). Research on remote monitoring of smart power grid using wireless sensor network. International Journal of Mechatronics and Applied Mechanics, 8: 243-249.
[12] La Rosa, R., Costanza, M., Livreri, P. (2020). Advanced techniques for powering wireless sensor nodes through energy harvesting and wireless power transfer. In 2020 AEIT International Conference of Electrical and Electronic Technologies for Automotive (AEIT AUTOMOTIVE), Turin, Italy, pp. 1-6. https://doi.org/10.23919/AEITAUTOMOTIVE50086.2020.9307406
[13] Giannì, C., Balsi, M., Esposito, S., Ciampa, F. (2020). Low-power global navigation satellite system-enabled wireless sensor network for acoustic emission localisation in aerospace components. Structural Control and Health Monitoring, 27(6): e2525. https://doi.org/10.1002/stc.2525
[14] Mohsan, S.A.H., Amjad, H., Mazinani, A., Sahibzada, A. S., Khan, M.A., Islam, A., Soban, A. (2020). Investigating transmission power control strategy for underwater wireless sensor networks. International Journal of Advanced Computer Science and Applications, 11(8): 281-285. https://doi.org/10.14569/IJACSA.2020.0110836
[15] Li, J., Yang, Y., Yan, H., Liu, C., Dong, L., Wang, G. (2020). Quasi-omnidirectional wireless power transfer for a sensor system. IEEE Sensors Journal, 20(11): 6148-6159. https://doi.org/10.1109/JSEN.2020.2972618
[16] Lee, D., Lim, Y., Park, K. (2020). Low-power unobtrusive ECG sensor system for wireless power transfer. In 2020 IEEE Wireless Power Transfer Conference (WPTC), Seoul, Korea (South), pp. 450-452. https://doi.org/10.1109/WPTC48563.2020.9295625
[17] Duan, R., Lyu, Y., Du, W., Zhou, Y. (2022). Multi-channel wireless sensor system based on CC1310 chip wtih high speed and low power consumption. Journal of Beijing University of Aeronautics and Astronautics, 48(11): 2177-2185. https://doi.org/10.13700/j.bh.1001-5965.2021.0682
[18] Hilleringmann, U., Petrov, D., Mwammenywa, I., Kagarura, G.M. (2021). Local Power Control using Wireless Sensor System for Microgrids in Africa. In 2021 IEEE Africon, Arusha, Tanzania, United Republic of, pp. 1-5. https://doi.org/10.1109/AFRICON51333.2021.9570970
[19] Sohan, M.F.A.A., Nahar, A. (2022). A low-power wireless sensor network for a smart irrigation system powered by solar energy. In Proceedings of the 2nd International Conference on Computing Advancements, Dhaka Bangladesh, pp. 537-543. https://doi.org/10.1145/3542954.3543031
[20] Xu, Y., Sun, Y., Tang, J., Wei, C., Ding, X., Huang, W. (2022). A Lamb waves-based wireless power transmission system for powering IoT sensor nodes. Smart Materials and Structures, 31(10): 105009. https://doi.org/10.1088/1361-665X/ac8ada
[21] Feng, X., Shao, Z., Wen, Y., Li, P., Wang, Y. (2021). An ultra-low-power wireless sensor system using Wi-Fi channels. Chinese Journal of Scientific Instrument, 42(9): 131-140.
[22] Hoang, V.A., Lee, Y.C. (2022). Capacitive-wireless power transfer system for power supply of a wireless sensor system on a propulsion shaft. Progress in Electromagnetics Research Letters, 102: 9-18. https://doi.org/10.2528/pierl21110301
[23] Qi, N. (2022). Optimization and simulation of a dynamic management system for building construction based on low-power wireless sensor networks. Journal of Sensors. 2022: 1841066. https://doi.org/10.1155/2022/1841066
[24] Bouattour, G., Kallel, B., Viehweger, C., Kanoun, O. (2022). Compact multi-coil inductive power transfer system with a passive peak detector circuit for wireless sensor nodes. tm-Technisches Messen, 89(9): 612-624. https://doi.org/10.1515/teme-2021-0113
[25] Chen, S., Liang, S., Li, S., Zhou, Y., Yu, X. (2021). Assessment of Electrical equipment status in distribution network based on multi-source data fusion. In IOP Conference Series: Earth and Environmental Science, 632(4): 042027. https://doi.org/10.1088/1755-1315/632/4/042027
[26] Jeong, S., An, Y.Y., Kang, H., Shim, T., Kim, S.H. (2020). An IoT standards-based electrical equipment status monitoring system supporting Modbus/OCF bridging. Journal of Electrical Engineering & Technology, 69(1): 217-224. https://doi.org/10.5370/KIEE.2020.69.1.217
[27] Yu, X., Huang, J., Liu, S., Lu, G., Yuan, J. (2022). Prediction of health status and fault of electrical equipment based on the concept of digital twin. In The proceedings of the 16th Annual Conference of China Electrotechnical Society, Singapore, pp. 1200-1207. https://doi.org/10.1007/978-981-19-1870-4_126
[28] Zhou, L. (2022). Research status and trend analysis of coal mine electro-mechanical equipment maintenance under the background of smart mine construction. In Advanced Intelligent Technologies for Industry, Singapore, pp. 263-272. https://doi.org/10.1007/978-981-16-9735-7_25
[29] Bian, L., Zhang, J., Cui, Q., Chen, X., Wang, S. (2021). Research on the Realization and Application of Intelligent IoT Platform for Electrical Equipment under Industrial Internet. In Journal of Physics: Conference Series, 1982(1): 012078. https://doi.org/10.1088/1742-6596/1982/1/012078