Praveen Kumar Pachala* | Polaiah Bojja
© 2022 IIETA. This article is published by IIETA and is licensed under the CC BY 4.0 license (http://creativecommons.org/licenses/by/4.0/).
OPEN ACCESS
The CT images of Lung illnesses or diseases that damage the lungs and weaken the respiratory system. Lung cancer is one of the topmost causes of death in humans around the world. Humans have a better chance of surviving if they are detected early. The average survival rate of persons with lung cancer increases from 14 to 49 percent if the disease is detected early. While computed tomography (CT) is significantly more effective than X-ray, a complete diagnosis requires a combination of imaging techniques that complement each other. But, because there are multiple phases of cancer that develop into different types of tumors with varying sizes and risks, finding lung cancer does not predict the risk of cancer. A deep neural network is constructed and tested for detecting lung cancer CT images. This research work analyses different types of tumor sizes such as large cell carcinoma, normal, squamous cell carcinoma, and adenocarcinoma. Also, the lung tumors are detected and predicted with the help of computer vision methods such as Residual neural network (ResNet), Convolutional neural network (CNN). Finally, the results of all the methods are compared and various parameters were calculated. Thus, the proposed method (ResNet) gives an optimal solution on comparison with respect to all the parameters.
CNN, CT images, ResNet, computer vision, large cell carcinoma, squamous cell carcinoma
Cancer is one of the deadliest diseases that leads to death. Approximately one-fourth of people will be diagnosed with cancer at some point during their lives [l]. The earlier the detection, the better the chance of survival. Once a year, there is a gradual increase in the number of cancer casualties. According to studies, cigarette smoking causes lung cancer in 85 percent of men and 75 percent of women [2].
An efficient hybrid evolutionary algorithm called GOADE for solving visual tracking problems. In the proposed hybrid algorithm, Grasshopper Optimization Algorithm (GOA) operates in refining the vector [3]. When compared to MRI and X-Ray readings, computerized Tomography reports are less noisy [4].
As a results, Many researchers have used machine learning models to detect and diagnose lung computed tomography (CT) images using various computer assisted detection (CAD) systems, such as convolutional neural networks (CNNs) [5], Which have demonstrated classification performance on medical images in recent years [6, 7].CNNs have shown exceptional performance in applications such as vision and pictures in the medical area in CAD systems to efficiently diagnose lung cancer from CT scans [8]. For classification, a CNN model is used [9]. Image classification, facial recognition, and natural language processing are just a few of the disciplines where two-dimensional (2D) CNN has been used with promising results [10]. The current CAD design necessitates the training of a large number of parameters, but parameter setup is difficult, thus the parameters must be tuned to improve classification accuracy [11]. The majority of patients present is in advanced stages because the index of suspicion for lung cancer is low. Unfortunately, it spreads early and causes few early symptoms.
2.1 Review stage
Lucky [12] proposed a system to detect tumor by radiology image with an Accuracy of 85%.
Bingulac and Faulhaber [13, 14] projected a respiratory cancer recognition strategy with the SVM classifier using fuzzy c & k-mean partition methodologies. By this model less than 93 percent accuracy is gained.
Doyle [15] proposed a novel method for lung cancer diagnosis with the inclusion of expert knowledge and proven pathology. In this method 86 percent precision is attained.
Juette and Zeffanella [16] proposed a novel method for recognition of lung tumor by using chest CT images. In this paper DenseNet is used for classification and feature extraction.
Williams [17] proposed a novel method for detection and classification of Brain Tumor using RCNN with two channel CNN. By this model less than 89 percent accuracy is gained.
Kawasaki [18] proposed a novel method to detect lung cancer that uses a Convolutional Neural Network ResNet-18, AlexNet, GoogLeNet, Marine predators algorithm used for optimal arrangement with an accuracy of 93.4%.
Rajakumari et al. [19] proposed a novel method for detection of lung cancer and classification using machine learning algorithm and image processing techniques are uses to extract lung regions and K-Means is used for segmentation and attained accuracy is less than 90%.
Nagadasari and Bojja [20], Kola et al. [21] AmataDesai studied mainly on the classification of lung images cancerous and non-cancerous. Dharani and Bojja [22] proposed a novel method.
Therefore, literature survey of a study on medical imaging in lung cancer detection, review on image processing methods used in lung cancer detection in review of optimization methods but by indicating observations and limitations and also research gaps found in terms of prediction of the lung cancer is need to be develop with deep learning methods.
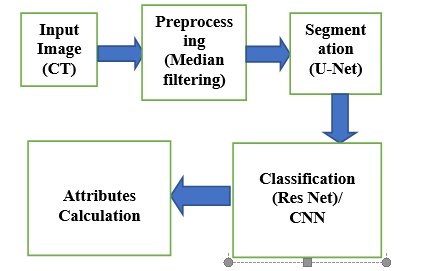
The Proposed system initiates its operation by acquiring the CT images from public database like Kaggle. The novel approach for detection and classification of Lung cancer disease using deep learning technique increases the classification and detection accuracy. The detailed view of the proposed method is shown in the below Figure 1.
Figure 1. Proposed block diagram of the overview of the methodology
The first stage is gathering a set of CT images from both public and private sources. CT images are pre-processed using the information base, and noise is removed using a median filter. The image is then segmented using the RCNN technique, as well as feature extraction and classification using the ResNet where the size and location of disease are detected. Finally, the identified tumor is classified whether it is benign or malignant.
3.1 Dataset acquisition
In this work, CT images are acquired because they produce more detailed visual data than other scans. CT scans can show a tumor's shape, size, and location [22]. They can even show the blood vessels that feed the tumor all without having to cut into the patient. Medical images are always stored using the DICOM file format, which stands for Digital Imaging and Communications in Medicine. The header's content is structured using a standardized series of tags. By extracting data from these tags, the doctor can access important information about the patient demographics and many more.
3.2 Pre-processing
Pre-processing is a technique involving the transformation of input data into an understandable format. Pre-processing is aimed at improving the quality and optimizing the image quality and optimizing the image functionality further pre-processing. Normally every has contained low frequency noise, so the image has to undergone pre-processing to remove the noise [23]. In pre-processing the stage involves is resized, the collected input images are of different sizes. Therefore, establish the base size of all the input images [24]. The base size of the image is 256×256. After resizing the image, we go from RGB to Gray scale conversion for converting true color image RGB to Gray scale image.
3.3 Median filtering
For removing noise median filter is used. Median Filter. The median filter is used for enhancement in pre-processing. It's a filter that isn't linear. It dampens the sound of salt and pepper [25]. The image's edges are preserved by the filter. In pictures, salt and pepper noise is an impulsive form of noise [26]. Errors in data transmission are the most common cause of noise. It appears as a smattering of white and black pixels that can substantially degrade the clarity of an image.
The reduction of noise in an image can be achieved by signal pre-processing. This filter replaces the through entry with the centre of the nearby entries to execute the image entry. The window, which slides in full signal or picture entry by entry, is known as the neighbours' pattern.
3.4 Dataset acquisition
In this work, CT images are acquired because they produce more detailed visual data than other scans. CT scans can show a tumor's shape, size, and location [22]. Medical images are always stored using the DICOM file format, which stands for Digital Imaging and Communications in Medicine. The header's content is structured using a standardized series of tags. By extracting data from these tags and many more.
3.5 Segmentation with U-Net architecture
Segmentation is a technique for partitioning an image into numerous portions or areas. It had a strong link to the visual objects [27]. Most algorithms require setting a certain parameter threshold. Right thresholding results in better segmentation. Using samples of available image strength, the correct threshold should be set automatically in a reliable algorithm that is np hard-wired gray values [28]. In this work U-Net Architecture is utilized for segmentation.
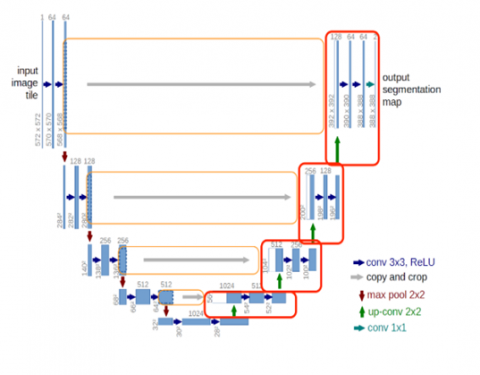
Figure 2. U-Net architecture
The shown in the Figure 2. Input images are received as a segmented yield map. The most specific aspect of the architecture in the second half. This network does not consist of a fully-connected layer. Only convolution layers are used. Each specified convolution process is treated by a ReLU stimulation function. After undergoing the process, the segmental image is provided as the final output.
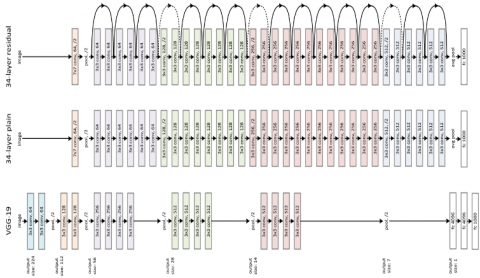
In this work the ResNet neural network, which stands for Residual Networks is used for classification. ResNet is a traditional neural network that serves as the foundation for many computers vision tasks [29]. The main reason for choosing ResNet over CNN because additional to improve accuracy and performance on proposed problems. The idea was that these layers would gradually learn the features [30]. As a result, the performance of a network degrades as more layers are added on top of it. The introduction of ResNet, or residual networks, has alleviated the problem of training profound networks. The Res Net network architecture is as shown in Figure 3.
Custom Resnet Model for Image Classification utilizing Fastai and PyTorch, to construct the Resnet backbone, Fastai library is used, as well as its underlying PyTorch operations, for the classification model. Fastai is a Python deep learning library consisting of high-level components that enable researchers to rapidly and efficiently achieve state-of-the-art results in common deep learning domains and low-level components that can be combined and matched to create novel approaches. Furthermore, Fastai is best compatible with the PyTorch library.
Figure 3. ResNet architecture
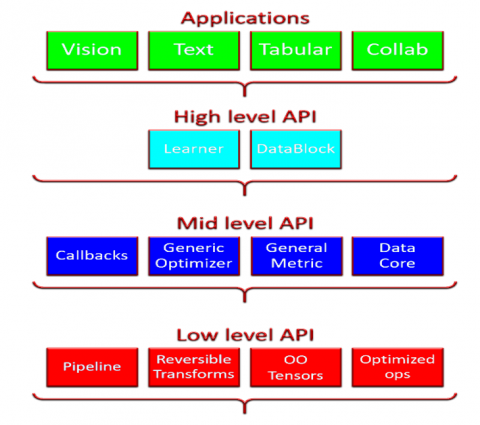
Figure 4. Fastai layered
The layers of Fastais as shown in Figure 4. Therefore, it is built on lower-level APIs' hierarchical structure that provides modular building blocks. This way, a user who wishes to rewrite a portion of the high-level API or add custom behaviour is not required to learn how to use the lowest level.
When it comes to image detection, there are various approaches. The first method uses a labelled dataset in which the cancer region has been marked and annotated. This assists the training algorithm in determining what it is looking for. As shown in Figure 4, the second method which is folder structured method is to use an image where images are classified into different types of cancers. This method is proper when the user is unfamiliar with the dataset and what to look for. Because the dataset is new, we're using a folder structure-based classification technique in our case.
In this work also implemented other deep learning technique like CNN and also machine learning technique [31] like SVM for classification is classification by CNN as show in Figure 5.
Figure 5. Architecture of CNN
The activation function most popularly used in neural networks, predominantly in CNNs [32].
The layer configurational data of CNN is given in Table 1.
Table 1. The layer configurational data of accuracy and sensitivity in percentage
|
Image |
Iterations |
MSE |
PSNR (%) |
Specificity (%) |
Sensitivity (%) |
Accuracy (%) |
Processing Time (sec) |
|
Input Lung CT Image-1 |
100 |
0.0080 |
69.1201 |
59.7420 |
91.4257 |
96.5927 |
6.2435 |
|
150 |
0.0080 |
69.1201 |
59.7420 |
91.4257 |
96.5927 |
7.4188 |
|
|
200 |
0.0079 |
69.1306 |
59.7448 |
91.4259 |
96.6292 |
8.8451 |
|
|
250 |
0.0079 |
69.1306 |
59.7448 |
91.4259 |
96.6292 |
9.2435 |
|
|
300 |
0.0079 |
69.1306 |
59.7448 |
91.4259 |
96.6292 |
10.8028 |
|
|
500 |
0.0079 |
69.1306 |
59.7448 |
91.4259 |
96.6292 |
13.4111 |
|
|
600 |
0.0079 |
69.1306 |
59.7448 |
91.4259 |
96.6292 |
15.3391 |
|
|
Input Lung CT Image-2 |
100 |
0.0085 |
68.8222 |
60.6828 |
91.5441 |
96.2511 |
9.6698 |
|
150 |
0.0075 |
69.3920 |
65.6870 |
91.5435 |
96.2637 |
10.8112 |
|
|
200 |
0.0074 |
69.4363 |
66.0475 |
91.5437 |
96.3461 |
11.6584 |
|
|
250 |
0.0074 |
69.4363 |
66.0475 |
91.5437 |
96.3461 |
12.7513 |
|
|
300 |
0.0074 |
69.4363 |
66.0475 |
91.5437 |
96.3461 |
13.7375 |
|
|
500 |
0.0074 |
69.4363 |
66.0475 |
91.5437 |
96.3461 |
15.7300 |
|
|
600 |
0.0074 |
69.4363 |
66.0475 |
91.5437 |
96.3461 |
16.4370 |
In this work to measure the efficiency of the proposed techniques various performance attributes such as accuracy, sensitivity, specificity, PSNR and MSE were determined as shown in Table 1.
6.1 Accuracy
In measuring technology, the process of measuring a degree of correct or accuracy in relation to the real measured variable with multiple measurements. The accuracy is calculated by using true positive, true negative, false positive and false negative values as shown in Eq. (1).
Accuracy $=\frac{(T p+T n)}{(T p+F p+F n+T n)}$ (1)
6.2 Sensitivity
The sensitivity tests the proportion of positives correctly defined as percentage of sick people. In clinics the sickness of people is judge by through percentage level, if the percentage is more than the specificity. The sensitivity of a test has an ability to distinguish the patient cases correctly. Calculate the fraction of true positive in-patient cases as shown in Eq. (2).
Sensitivity $=\frac{T p}{T p+F n}$ (2)
6.3 Specificity
The test has ability to define the healthy cases correctly, it calculates the proportion of true negative (Tn) in healthy cases, it measures the proportion of high values (positives) that are correctly defined by using Eq. (3). This can correctly identify the persons which are not sick.
Specificity $=\frac{T n}{T n+F p}$ (3)
The proposed system detects the lung cancer based on different types of tumor sizes such as (Large_cell_carcinoma, Normal, Squamous_cell_carcinoma, and adenocarcinoma) by using CT images. To detect and classify the lung cancer, initially the CT images are acquired from public database. In this work the CT images are acquired from public and private database. In this work the CT images are acquired from public and private database as given in Table 2.
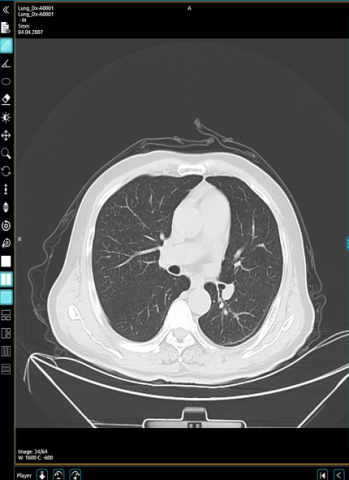
Figure 6. Input image
Table 2. Diagonal values for different types of lung cancer
|
Centimeter to Pixel (X) Conversion Table |
||
|
Type |
Centimeter [cm] |
Pixel (X) |
|
Large_cell_carcinoma |
between 5–7 cm |
between 150-265 pixel (X) |
|
Squamous_cell_carcinoma |
<3cm |
<120 |
|
adenocarcinoma |
>3 cm |
>120 pixel (X) |
CT scans can show a tumor's shape, size, and location. CT images are now widely used as a screening tool for detecting and diagnosing a variety of tumors. It has also become an important component of any comprehensive medical examination. The CT images provide extensive information about lungs. The input image is as shown in Figure 6.
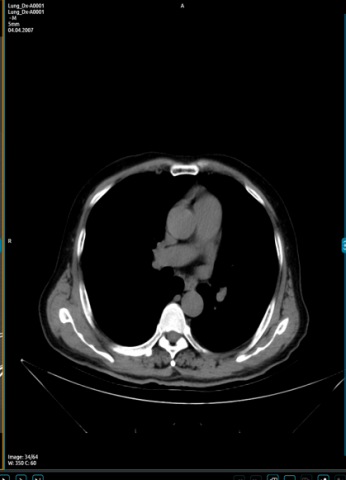
Pre-processing is a technique involving the transformation of input data into an understandable format. Pre-processing is aimed at improving the quality and optimizing the image quality. Pre-processing is used to remove the noise. In pre-processing the stage involves is resized, the collected input images are of different sizes. The pre-processed image is shown in Figure 7.
Figure 7. Pre-processing image
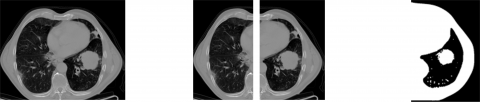
After pre-processing the image is undergone to segmentation using U-Net architecture. The tiled and binary images obtained in the process of segmentation is as shown in Figure 8.
Figure 8. Original image, tiled image, binary image
Segmentation is a technique for partitioning an image into numerous portions or areas, usually based on the characteristics of the pixels in the image. The prediction model can detect the type of cancer, as illustrated in Figure 9, only when the data is unambiguous and without superimposed images.
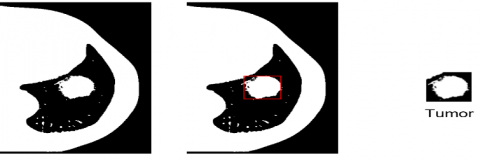
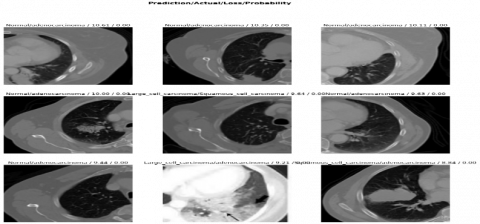
After the tumor is detected, the segmented image is processed to ResNet classification stage where the tumor is classified as benign or malignant. The classification accuracy will be improved if the input contains no losses. Failed cases in which the cancer type could not be determined due to unclear information, superimposed images, and a lack of landmarks to distinguish them from one another. The plot top losses present in the acquired image is as shown in Figure 10.
Figure 9. Detected tumor region
Figure 10. Plot top losses which show the classification of malignant
Similarly for predicting the squamous cell carcinoma and adenocarcinoma the diagonal values are calculated using the equation 8 and the obtained diagonal values are tabulated in Table 3.and the corresponding prediction images are shown in Figure 4 and Figure 5 respectively, to construct the Resnet backbone, we will make use of the Fastai library, as well as its underlying PyTorch operations, for the classification model. Fastai is a Python deep learning library consisting of high-level components that enable researchers to rapidly and efficiently achieve state-of-the-art results in common deep learning domains and low-level components that can be combined and matched to create novel approaches. Fastai's goal is to accomplish both without sacrificing significant ease of use, either adaptability or performance. Furthermore, Fastai is best compatible with the PyTorch library. Installing Fastai dependencies can be accomplished using the pip command, which can be entered as 'pip install Fastai.' After importing Fastai, we will first initialize the Resnet model from Fastai using the following command in learn=create cnn (data, models, resnet101, metrics=error rate).
For testing, we are using resnet101, a 101-layer convolutional neural network. Next, we need to initialize the training model for the custom Resnet Image Classifier; in this case, we are adding a callback function. Callbacks are used in Fastai to allow the user to customize the training loop from Fastai callbacks import, from the callback function, we request an early stopping method from callback function that enables users to define an arbitrary number of training epochs and automatically stop training when the model's performance on a hold-out validation dataset stops improving early_stop EarlyStoppingCallback (learn, patience=20). As a result, we can estimate the accuracy of the model.
Table 3. Diagonal values for test images
|
Type |
Diagonal (D) |
Diagonal in centimeter |
|
Squamous cell carcinoma |
L=78px W= 79px D=111.97 |
2.930 |
|
adenocarcinoma |
L=125px W= 128px D=178.91 |
4.723 |
Lung cancer is the most Incurable diseases in the world. The detection and classification of cancer at an early phase is quite hard with the existing methods of segmentation and classification techniques. Exact Diagnosis and Identification of these cancers can increase the survival rate. However, lung cancer is diagnosed by radioscopy which significantly takes a longer time and not accurate. So based on Image processing techniques ResNet approach is proposed for classification based on segmentation for accurate sensing. Also, various parameters like specificity, sensitivity, accuracy, PSNR and MSE values determined and compared with other classification techniques as CNN is deliberated. The proposed classification method yields high accuracy i.e,99.4200 compared to the CNN method.
[1] Young, G.O., Peters, J. (1964). Synthetic Structure of Industrial Plastics. Plastics, New York: McGraw-Hill, 15-64.
[2] Chen, W.K. (1990). Linear Networks and Systems: Algorithms and Computer-aided Implementations. World Scientific, 3: 123-135. https://doi.org/10.1142/0676
[3] Reddy, K.N., Bojja, P. (2022). A novel method to solve visual tracking problem: Hybrid algorithm of grasshopper optimization algorithm and differential evolution. Evolutionary Intelligence, 15(1): 785-822. https://doi.org/10.1007/s12065-021-00567-0
[4] Miller, E.H. (1990). A note on reflector arrays (Periodical style—Accepted for publication). IEEE Trans. Antennas Propagat, pp. 123-135.
[5] Wang, J. (2005). Fundamentals of erbium-doped fiber amplifiers arrays (Periodical style—Submitted for publication). IEEE J. Quantum Electron.
[6] Kaufman, C.J. (1995). Rocky Mountain Research Lab., Boulder, CO, Private Communication. https://www.scirp.org/journal/paperinformation.aspx?paperid=79295.
[7] Bojja, P. (2021). A non-linear mathematical model based routing protocol WBSN-based health-care system. International Journal of Pervasive Computing Communications, 13: 127-139. https://doi.org/10.1108/Ijpcc-09-2000-0138.
[8] Young, M. (1989). The Techincal Writers Handbook. Mill Valley, CA: University Science. https://agris.fao.org/agris-search/search.do?recordID=US201300003585.
[9] Duncombe, J.U. (1959). Infrared navigation—Part I: An assessment of feasibility. IEEE Trans. Electron Devices, 11(1): 34-39.
[10] Chen, S., Mulgrew, B., Grant, P.M. (1993). A clustering technique for digital communications channel equalization using radial basis function networks. IEEE Transactions on Neural Networks, 4(4): 570-590. https://doi.org/10.1109/72.238312
[11] Venkatesh, C., Bojja, P. (2022). A dynamic optimization and deep learning technique for detection of lung cancer in CT images and data access through internet of things. Wireless Personal Communications, 125: 2621-2646. https://doi.org/10.1007/s11277-022-09676-0
[12] Lucky, R.W. (1965). Automatic equalization for digital communication. Bell System Technical Journal, 44(4): 547-588. https://doi.org/10.1002/j.1538-7305.1965.tb01678.x
[13] Bingulac, S.P. (1994). On the compatibility of adaptive controllers (Published Conference Proceedings style). In Proc. 4th Annu. Allerton Conf. Circuits and Systems Theory, pp. 8-16.
[14] Faulhaber, G.R. (1995). Design of service systems with priority reservation, Conf. Rec. 1995 IEEE Int. Conf. Communications, pp. 3-8.
[15] Doyle, W. (1966). Magnetization reversal in films with biaxial anisotropy. IEEE Transactions on Magnetics, 2(2): 68-73. https://doi.org/10.1109/TMAG.1966.1065802
[16] Juette, G.W., Zeffanella, L.E. (1990). Radio noise currents n short sections on bundle conductors (Presented Conference Paper style). In IEEE Summer power Meeting, Dallas, TX, 690.
[17] Williams, J. (1993). Narrow-band analyzer (Thesis or Dissertation style) (Doctoral dissertation, Ph. D. dissertation, Dept. Elect. Eng., Harvard Univ., Cambridge, MA).
[18] Kawasaki, N. (1993). Parametric study of thermal and chemical nonequilibrium nozzle flow (Doctoral dissertation, MS thesis, Dept. Electron. Eng., Osaka Univ., Osaka, Japan).
[19] Rajakumari, P., Bojja, P., Ch, S.C., Mrudula, S.T., Putta, K.R., Gosuadigo, A. (2022). Experimental analysis and improvements of a visible spectrophotometer for detection of nano materials. International Journal of Chemical Engineering, Article ID: 7952197. https://doi.org/10.1155/2022/7952197
[20] Nagadasari, M.P., Bojja, P. (2022). Industrial IoT enabled fuzzy logic based flame image processing for rotary kiln control. Wireless Personal Communications, 1-19. https://doi.org/10.1007/S11277-022-09677-Z
[21] Kola, R.R.K., Bojja, P., Kumari, P.R. (2021). Optimal technique of tumor detection and prediction of livestock by deep neural network with tensor flow and Keras. Journal of Physics: Conference Series, 1804(1): 012171. https://doi.org/10.1088/1742-6596/1804/1/012171
[22] Dharani, N.P., Bojja, P. (2022). Analysis and prediction of COVID-19 by using recurrent LSTM neural network model in machine learning. International Journal of Advanced Computer Science and Applications, 13(5): http://doi.org/10.14569/IJACSA.2022.0130521
[23] Maheshan, C.M., Prasanna Kumar, H. (2020). Performance of image pre-processing filters for noise removal in transformer oil images at different temperatures. SN Appl. Sci., 2: 67. https://doi.org/10.1007/s42452-019-1800-x
[24] Krizhevsky, A., Sutskever, I., Hinton, G.E. (2012). Imagenet classification with deep convolutional neural networks. In Advances in Neural Information Processing Systems, pp. 1106-1114.
[25] Thakur, T., Batra, I., Luthra, M., Vimal, S., Dhiman, G., Malik, A., Shabaz, M. (2021). Gene expression-assisted cancer prediction techniques. Journal of Healthcare Engineering, 2021. https://doi.org/10.1155/2021/4242646
[26] Shashi, P., Suchithra, R. (2019). Review Study on Digital Image Processing and Segmentation. Am. J. Comput. Sci. Technol, 2(68).
[27] Pfeuffer, A., Schulz, K., Dietmayer, K. (2019, June). Semantic segmentation of video sequences with convolutional lstms. In 2019 IEEE intelligent vehicles symposium (IV), IEEE Trans. 1441-1447. https://doi.org/10.1109/IVS.2019.8813852
[28] Zhang, X., Feng, Z. (2018). New development of the image matching algorithm. In Ninth International Conference on Graphic and Image Processing (ICGIP 2017), 10615: 509-516. https://doi.org/10.1117/12.2305367
[29] He, K., Zhang, X., Ren, S., Sun, J. (2016). Deep residual learning for image recognition. In Proceedings of the IEEE Conference on Computer Vision and Pattern Recognition, pp. 770-778. https://doi.org/10.1109/CVPR.2016.90
[30] Tai, Y., Yang, J., Liu, X. (2017). Image super-resolution via deep recursive residual network. In Proceedings of the IEEE Conference on Computer Vision and Pattern Recognition, pp. 3147-3155. https://doi.org/10.1109/CVPR.2017.298
[31] Liu, W., Wang, Z., Liu, X., Zeng, N., Liu, Y., Alsaadi, F.E. (2017). A survey of deep neural network architectures and their applications. Neurocomputing, 234: 11-26. https://doi.org/10.1016/j.neucom.2016.12.038
[32] Kim, E.J., Brunner, R.J. (2016). Star-galaxy classification using deep convolutional neural networks. Monthly Notices of the Royal Astronomical Society, 464: 4463-4475. https://doi.org/10.1093/mnras/stw2672