Onur Erdem Korkmaz
© 2022 IIETA. This article is published by IIETA and is licensed under the CC BY 4.0 license (http://creativecommons.org/licenses/by/4.0/).
OPEN ACCESS
Brain-computer interfaces are systems that control computers or external electronic devices by converting the electrical activity produced by the brain into device commands. One of the brain-computer interface types frequently used in the literature is the P300-based system. Research in this area aims to develop new paradigms to improve its performance. In this study, the amplitude and latency values of the P300 signals obtained from classical two-dimensional row-column flashings and novel three-dimensional column flashing paradigms were compared in terms of both visual and numerical evaluations. Based on the obtained results, it is observed that the amplitude of the P300 signal captured using the three-dimensional column flashing paradigm increased while the corresponding latency decreased. The most significant amplitude improvement between the two paradigms was obtained on the P8 channel with 1.47 mV. Based on the average values over all individuals and channels, it was also observed that the proposed paradigm provides a 15.94% amplitude increase and a -1.22% latency decrease value. In other words, higher P300 amplitude and lower latency values were obtained using the developed/novel/proposed/3D paradigm. These obtained results are significant since low P300 amplitude and high latency values are related to complex tasks in the literature. From this point of view, it was concluded that the newly developed paradigm was perceived as an easy-to-use and efficient procedure by the participants. Therefore, it provided high performance in terms of classification accuracy.
brain computer interface, paradigm, p300, amplitude, latency
Brain-computer interface (BCI) is a system that converts electroencephalography (EEG) signals into computer commands to communicate between the human brain and a computer or other external devices. In this manner, a computer can be controlled using EEG signals, just like a computer mouse or keyboard. Brain-computer interface is a system that links the brain to various electronic devices, including computers, wheelchairs and robotic arms, without using the peripheral neural system and muscles. BCI speller has a vital role for patients with diseases such as amyotrophic lateral sclerosis, brainstem stroke, or traumatic brain injury since they have lost the ability to communicate due to loss of muscle control. Hence, such individuals require personal care assistance or a caretaker and must express their daily living activities to them. BCI systems enable such patients to communicate their needs to their relatives [1-6]. In the literature, there are generally three main approaches utilizing features obtained from EEG signals use of motor images [7-10], event-related P300 potentials [11-13], and steady-state visually evoked potentials [14-16]. Of these, event-related P300 potential is frequently preferred in EEG-based BCI systems as they occur in a short time, are not impaired by eye movement artifacts, and these systems do not require a pre-training phase. Using the P300 components, therefore, high-performance BCI systems can be obtained in terms of classification accuracy (CA) and information transfer rate.
Based on P300 potentials, many applications have been developed to control external devices, from computer mouse [17], robotic arms [18], and wheelchairs [19] to spelling [20], games [21], and even security [22]. Among these, the BCI speller is vital for individuals with diseases such as amyotrophic lateral sclerosis, brainstem stroke, or traumatic brain injury who lose their ability to communicate due to loss of muscle control. These people need personal care assistance to perform their daily living activities. The P300 speller is one of the most promising and vital BCI applications. It enables such patients to communicate with their environment by selecting letters or other characters on a computer screen without muscle activity by employing the P300 event-related potential [23]. It typically uses the classic two-dimensional row-column paradigm (2D-RC), in which letters and other characters are displayed in a matrix that simulates a keyboard. Here the rows and columns flash randomly while the user focuses on the desired letter or character, also referred to as a target. Interestingly, whenever the user notices the desired flashing letter or character, the subject’s brain has a positive electrical response which occurs approximately 300 milliseconds (ms) following the onset of flashing [24, 25]. This signal is referred to as the P300 wave. As a result, the P300 speller identifies the target and non-target flashings by examining the existence of P300 components.
Some features of P300 spelling systems are speller performance, online/offline use, subject dependency, stimulus technique and inter-stimulus interval times, the amplitude of P300, number of flashes and flashing techniques, visual layout, number of channels, classification method for flashing existence, and effect on mental workload capacity [25, 26]. Many studies have proposed new visual stimulus presentation techniques [27, 28] to improve CA or fewer flashing techniques [29, 30] to reduce decision time. In a P300-based study, Wu et al. [31] stated that the CA performance and information transfer rate of the P300 speller was insufficient for real-world application and proposed a new matrix format by placing a green dot or a red line over the characters in a virtual character matrix. To improve the performance of the P300 speller, Wu et al. designed a new typing paradigm in which a flashing row or column of a virtual character matrix is covered with a translucent green circle with a red dot on the top or bottom half. Experimental results showed that the new paradigm increased the P300 amplitude of the electrodes in the parietal and frontal areas. In addition, the new paradigm developed has achieved higher classification accuracy and information transfer rates. The offline study they conducted with 11 participants achieved an average CA of 97.27%. In another study, Lu et al. [32] proposed a P300-speller paradigm based on the users' and famous faces. In their research, the online CA average of 10 participants reached 85.3%. In another, Qu et al. [27] obtained an average CA rate of 94% from 12 volunteers in their online (real-time) experiment with the P300 speller, a three-dimensional (3D) and single-character visual stimulus, based on a similar objective. In a study evaluating visual modulations in P300 spelling paradigms [28], online and offline experiments were conducted with a total of 10 people. The results showed that the red face paradigm in the white frame provided higher average accuracy than the red face paradigm in the blue frame and the red face paradigm in the red frame in the online session. Most of the work done in the field of BCI is aimed at developing new paradigms for a more efficient brain-computer interface. In the above studies, for this purpose, BCI performance was tried to be improved by developing new visual stimulus presentations.
In studies, the effect of the paradigm on the CA effect was investigated with methods such as different visual, color, face, and arithmetic operations. In the literature, 2D and 3D flashing paradigms and CA performances have been compared [27, 33, 34]. For example, a similar study by Korkmaz et al. obtained the highest CA of 99.81% in the 3D paradigm using 11 electrodes and 15 flashes in the central, parietal and occipital regions [33], while they achieved 99.70% CA in the 2D paradigm using the same electrodes and number of flashes. Using P8 single electrode, they also achieved the highest CA of 97.83% in the 3D paradigm and 96.17% in the 2D paradigm. These results show that the proposed 3D paradigm provides higher CA performance, especially for low flashing numbers in the range of 1-3. However, the amplitude and latency differences of P300 signals between 2D and 3D paradigms have not been investigated yet. In this study, using the 3D paradigm dataset, the effect of the 2D and 3D paradigms on P300 amplitude and latency was analyzed on an EEG channel basis. By revealing the difference in amplitude and latency values between 2D and 3D paradigms, it has been shown from a scientific point of view why the 3D paradigm provides more performance in ERP-based studies. The greatest amplitude increase between the two paradigms was obtained from the P8 channel, and the difference was 1.47 mV. It was also observed that since the proposed paradigm was averaged for all subjects, it provided a 15.94% amplitude increase and a -1.22% latency reduction.
The rest of this paper is organized as follows. In section 2, materials and methods are presented, including the data set and paradigm descriptions, EEG recording and signal processing, and finally, experimental procedure, respectively. The experimental results and discussion are presented in section 3. Finally, section 4 concludes the paper.
This section first introduces the data set used in the study. Then, the classical 2D and proposed 3D paradigms used in the study are defined.
2.1 Dataset
EEG signals used in the study were recorded in two sessions using 2D and 3D paradigms. A total of ten healthy participants, five male (mean age 28 ± 4.84) and five female (mean age 27 ± 4.15), were included. All participants were right-handed and without any visual or neurological disorders. In both recording sessions, 60 target characters were presented to the participants, while the brain's electrical activity was recorded.
2.2 Paradigm
BCI systems are generally based on the row-column paradigm model developed by Farwell and Donchin [35]. This widely used approach is called the classical paradigm, and it is based on the two-dimensional row-column (2D-RC) P300 typing approach. During the save of the dataset, a new three-dimensional column-based (3D-C) paradigm was also developed. Experiments were carried out with both paradigms in two sessions to reveal the difference.
2.2.1 Classic 2D-RC paradigm
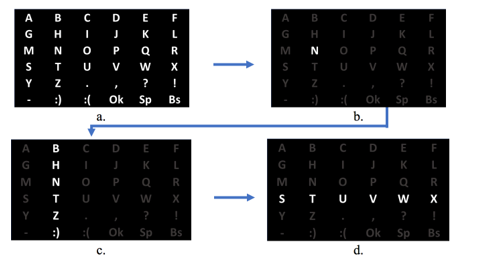
In the classical 2D-RC paradigm, a 6x6 character matrix of letters, shown in Figure 1. a, is presented to the participants. They are first asked to focus on a specific character, as shown in Figure 1. b. Then the columns and rows of the matrix are flashed randomly in a column followed by a row and a row followed by a column sequence (see Figure 1. c-d). All subjects are asked to silently count the number of flashes of the target character to ensure their increased concentration. A total of 12 consecutive flashes with one row and one column target flashings, formed by six-row flashings and six column flashings, are called a "trial". A total of 15 attempts, called a "run", are made for each target character detection. Therefore, a run performed for a target character consists of 180 (12x15) flashes.
Figure 1. Images used in the 2D-RC paradigm
2.2.2 Proposed 3D-C paradigm
The proposed 3D-C paradigm consists of the combination of two paradigms given in the literature. Ramirez-Quintana et al. [36] showed that only column-based flashes increase BCI performance. Qu et al., on the other hand, designed an effective BCI system with a 3D flashing of a single character. Korkmaz et al. developed the 3D-C paradigm as a combination of these two [27]. Because the new paradigm includes both the column-only approach and 3D flashing, it has been named the 3D-C paradigm.
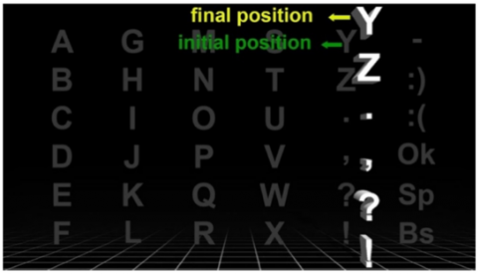
The 3D-C paradigm has some crucial differences from the classical 2D-RC paradigm. First, the stimuli presentation's flashes are realized with a three-dimensional effect. The flashing example used in the study and showing this 3D effect is shown in Figure 2. In this figure, the basic character matrix is shown in the background with a pale color, while the flashed column with a three-dimensional effect is shown in the foreground. To better highlight the difference, the initial and final positions of the flashed column are presented together.
Figure 2. Flashing example showing the 3D effect
Another difference between the proposed 3D-Cparadigm and the classical 2D-RC paradigm is that flashings of the character matrix are in the form of column flashings only. Here a column is flashed in a 2D-RC manner first. Then, by transposing the rows, new columns are obtained, and one among these new columns are flashed again. The idea of column-only flashing is based on the fact that the amplitude of the P300 wave using columns is more significant than using rows due to westerners' habit of reading text horizontally [37]. On the other hand, Orlandi and Proverbio showed that 3D visuals increase the brain's ERP response [34]. Based on these ideas, this new paradigm utilizes 3D and column-only flashing to increase ERP responses and develop a more efficient and faster BCI application. Examples of column flashing performed in the proposed paradigm are shown in Figure 3. First, the entire character matrix is shown as shown in Figure 3. a. Then the target character is displayed (Figure 3. b.), and column flashing operations are performed. In Figure 3. c., column flashing that includes the target character is shown. After completing the column flashings, a new character matrix is obtained by transposing the character matrix (Figure 3. d.). Then, the same target character is displayed (Figure 3.e), and six-column flashings are performed again. Figure 3. f. shows the same target character in the new column location. A sample video of such a process can be accessed through https://youtu.be/mJbak5xPB7w.
Figure 3. Images used in the 3D-C paradigm
2.3 EEG recording
The Data recording procedure was approved by Atatürk University Health Sciences Institute Ethics Committee. All volunteer participants signed the Board-approved Consent Form before the experiment. Both paradigms were shown to the participants on a 1920 x 1080 resolution LED display. EEG data were recorded while the participants were sitting in a comfortable chair located 1 m away from the screen. During the experiments, subjects were instructed to avoid unnecessary movements, including blinking, to pay attention to the target character, and quietly count the number of flashes of the target character.
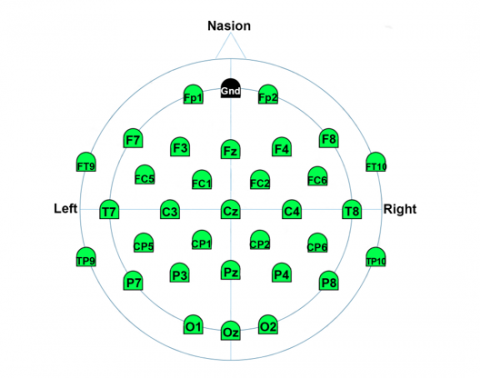
EEG data were obtained on 32 channels with the actiCHamp (Brain Products GmbH, Gilching, Germany) device consistent with the international 10-20 EEG system. The data was collected with a sampling frequency of 250 Hz using the 'Fz' as the reference electrode and the ground electrode placed on the forehead area. During the experiments, the impedances of all electrodes were kept below 5 kW. The arrangement of the electrodes used in data acquisition is shown in Figure 4.
Figure 4. EEG electrodes placed according to the international 10-20 system
2.4 Experimental procedure
2D-RC paradigm experiment is composed of 15 trials for each target character. Since each trial is a set of 12 flashings, as described previously, there exist 180 flashings for each character. The 3D-C paradigm, on the other hand composed of 180 flashings but in a different manner. Following the target character displayed to the participant, all six columns are randomly flashed first. This process is defined as the column trial flashing. 15 column trials similar to 2D-RC resulted in 90 flashings. Then a similar procedure is repeated for the transpose of the character matrix, forming another set of 90 flashings. As a result, the same 180 flashes are performed for each target character.
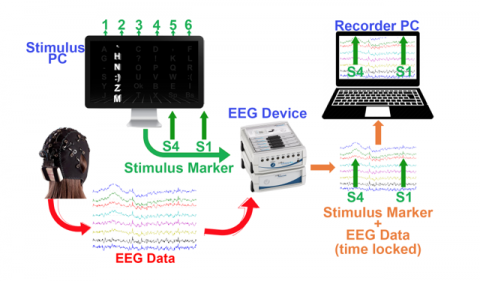
The data collection setup consists of two separate computers, one for visual stimulus presentation, another for data recording, and an EEG device by which brain responses are measured during visual stimulus presentation. Here, stimulus presentation is performed using MATLAB software. The index information of flashed row or column and the obtained brain electrical activity detected on the electrodes are combined by the EEG device and sent to the recording computer. Thus, EEG data and visual stimulus index are recorded with a time lock. This data collection setup is shown in Figure 5.
Figure 5. The experimental setup
2.5 EEG Signal processing
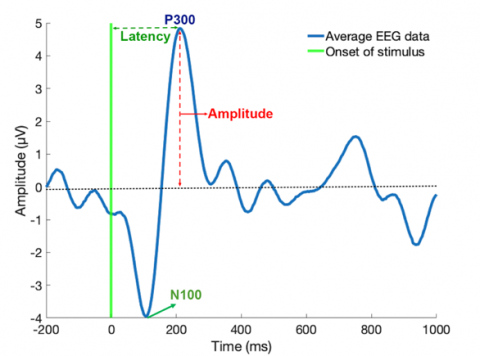
The signal-to-noise ratio of event-related potentials occurring in a single trial flashing is very low. For this reason, multiple trial flashings are performed and averaged, resulting in a higher signal-to-noise ratio and, thus, more specific event-related potentials. The most commonly used event-related potential is the P300 signal. The positive amplitude value that occurs approximately 300ms after the target stimulus defines this name. In the same manner, there exist similar event-related potentials. For example, negative peaks occurring at 100ms and 400ms are called N100 and N400, respectively. Positive peaks appearing at 200ms and 600ms are called P200 and P600, respectively.
The P300 signal has two different characteristics: Amplitude and latency. Both features may vary depending on the type of paradigm applied. The amplitude, measured in mV, and the latency, the time between the stimulus and P300 signal and measured in ms, are shown in Figure 6.
Figure 6. Amplitude and latency values of the P300 signal
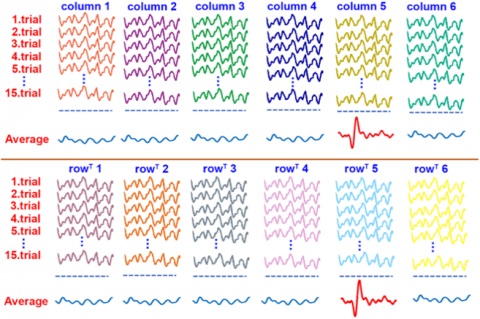
Four-stage data processing steps are applied to the obtained EEG signals. These are preprocessing, segmentation, baseline removal, and averaging. Since the P300 waves in the EEG data, obtained from 31 channels in the study, have low-frequency components [38], a 0.1-10Hz bandpass filtering is applied in the preprocessing step for noise removal. In the segmentation step, the EEG data is partitioned in time windows starting 1000ms before the P300 and ending 200 ms after the P300. Figure 7 shows representative images of EEG fragments of 1.2s (1000ms + 200ms). In the baseline removal step, the baseline is determined using 200ms-long data of each 1.2s EEG segment before the target stimulus arrives. The following 1000ms data after the stimulus is adjusted to remove the detected baseline level. In the averaging step, the event-related potentials (ERPs) are obtained by averaging the three-step processed signals. A demonstration of the averaging is shown in Figure 7. Here the target character ‘?’, located in the 5th column and 5th [row]T, results in an ERP after averaging for column 5 and [row]T 5 while nothing is observable for all other columns or [row]T averages.
Figure 7. Representative mean EEG signals of the column and [row]T flashes
The percent increase value between the 3D and 2D paradigms for the amplitude and latency values obtained is obtained using the following equation.
$P I=\frac{(3 D-2 D) * 100}{2 D}$ (1)
where, PI represents percent increase, 3D represents the amplitude or latency value of the P300 signal obtained using the 3D-C paradigm while 2D represents that of the 2D-RC paradigm.
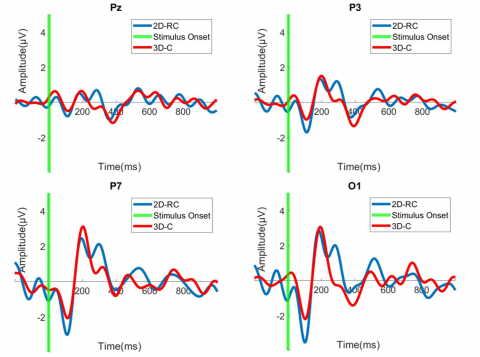
The ERPs obtained using EEG signals recorded in experiments with 2D-RC and 3D-C paradigms are shown in Figure 8. The comparison process was performed by calculating the average of the ERPs obtained from all subjects and plotting them on the electrodes of the parietal (Pz, P3, P4, P7, and P8) and occipital (Oz, O1, and O2) regions. In Figure 8, blue lines show the 2D-RC paradigm results, red lines show the 3D-C paradigm results, and the green vertical line indicates the moment of stimulus arrival.
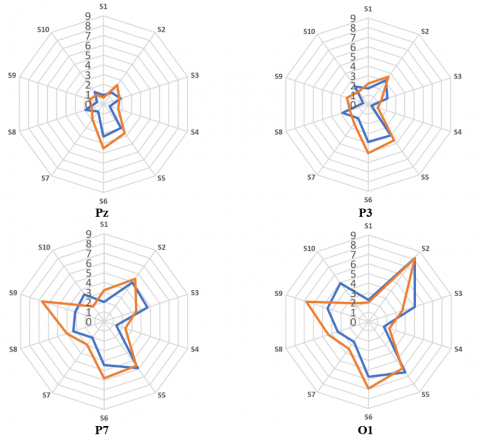
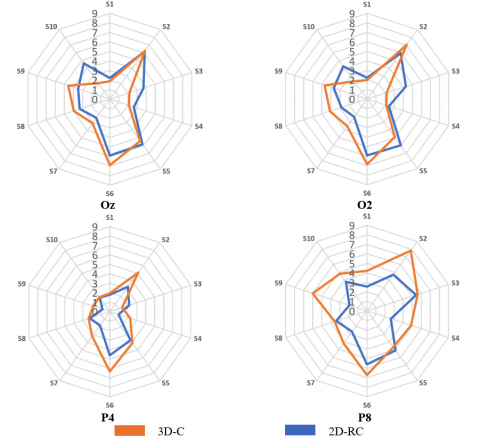
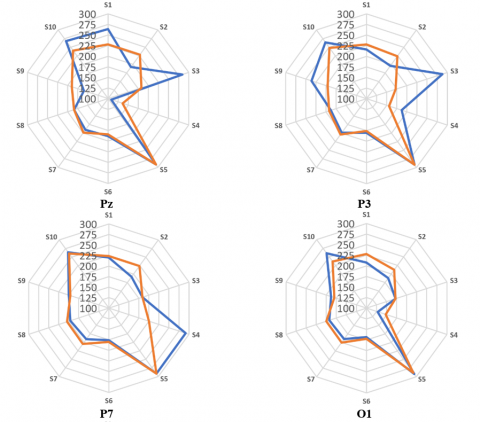
From the examination of the results, it is observed that there is a noticeable increase in the P300 amplitude of the 3D-C paradigm, especially in the P4, P7, and P8 channels. It is also clear that there is a decrease in N100 amplitude almost for all channels. Tables in Figure 9 and Figure 10 were constructed for a detailed evaluation of the amplitude and latency changes, which are roughly observable in Figure 8. In Figure 9, amplitudes for different channels of P300 signals are presented for 2D-RC and 3D-C paradigms of all subjects indicated as S1-S8. Here, the orange bars show the amplitude values of the 3D-C paradigm, and the blue bars show that of the 2D-RC paradigm. These tables suggest that the P300 amplitude values of the 3D-C paradigm are generally higher than the 2D-RC paradigm.
Figure 8. Comparisons of P300 signals of 2D and 3D paradigms for different channels
Figure 9. P300 amplitude values 2D and 3D paradigms for different channels and subjects
Figure 10. P300 Latency values 2D and 3D paradigms for different channels and subjects
Levels on the radar chart in Figure 9, represent amplitude in mV. In addition, the corners of the radar graphs show the P300 amplitude values of individuals for both paradigms. Similarly, levels on the radar chart in Figure 10, represent latency in ms. In addition, the corners of the radar graphs show the P300 latency values of individuals for both paradigms.
Figure 11 was obtained for a detailed evaluation of Figure 9 results by averaging the magnitude values of all persons for all channels.
Figure 11. Averaged amplitude values of all channels
From the evaluation of this table, the average P300 amplitude of the 3D-C paradigm is higher than the average P300 amplitude of the 2D-RC paradigm in all channels except the Oz and O2 channels, for which the amplitudes are almost the same. Also, the highest average P300 amplitude for the 3D-C paradigm was obtained on the P8 channel with 5.25 mV. The most significant difference between the P300 amplitudes of both paradigms is also obtained on the same P8 channel with an increase of 1.47 mV.
Figure 10, on the other hand, shows the latency values of the P300 signals of the 2D-RC and 3D-C paradigms for different channels and subjects. Here, the orange bars show the latency values of the 3D-C paradigm, and the blue bars show the latency values of the 2D-RC paradigm. This figure suggests that the P300 latency values of the 3D-C paradigm are generally lower than the 2D-C paradigm.
Figure 10 results are averaged over all subjects and presented in Figure 12.
Figure 12. Average latency values of all channels
From the evaluation of Figure 12, the average P300 latency of the 3D-C paradigm is lower than the average P300 latency of the 2D-RC paradigm in all channels except the occipital region channels, namely O1, Oz, and O2. The most significant difference between both paradigms' P300 latency is obtained on the P3 channel with 16ms.
Table 1. P300 amplitude and latency increments per channel
|
Channel |
Amplitude increase (%) |
Latency increase (%) |
|
Pz |
24.69 |
-3.29 |
|
P3 |
16.81 |
-7.11 |
|
P4 |
31.60 |
-1.45 |
|
P7 |
17.61 |
-1.81 |
|
P8 |
38.89 |
-3.79 |
|
Oz |
-4.71 |
2.60 |
|
O1 |
2.91 |
2.51 |
|
O2 |
-0.25 |
2.59 |
|
Average |
15.94 |
-1.22 |
Considering the Figure 11 and Figure 12 values, percent amplitude and latency increment for all channels are presented in Table 1. From this table, it is clear that there is an amplitude increase in all of the parietal region electrodes when the 3D-C paradigm is employed, while there is an amplitude increase only in the O1 channel. Based on all channels' averages, an average amplitude increment of 15.94% is observable. When the latency values are examined, on the other hand, there is a decrease on all of the parietal region electrodes and an increase on the occipital region electrodes when the 3D-C paradigm is used. When such latency values are averaged over all channels, it is observed that there is a decrease of -1.22% with the use of the 3D-C paradigm.
The literature reported that the mean P300 amplitude is smaller, and the latency is more significant for the use of more complex tasks [39, 40]. Based on their findings, the proposed paradigm suggests an easy task compared to the traditional 2D-RC with higher P300 amplitude and lower latency values, especially for parietal region electrodes, using the 3D-C paradigm. In other words, it provides higher performance.
In P300-based BCI applications, studies are carried out on how different stimuli affect system performance. These studies often include research on how it affects classification accuracy. In the literature, Korkmaz et al. [33] showed that the three-dimensional and column-flash-based paradigm provides a higher classification accuracy than the classical two-dimensional row-column flash-based paradigm without clearly indicating how the three-dimensional and column flashing causes a change in the P300 response. Using the dataset created by Korkmaz et al., it has been shown in this study how the proposed visual paradigm causes a change in the event-related potentials produced by the human brain. In this sense, the P300 signals’ amplitude and latency values were investigated in the study.
Based on the obtained results, both paradigms' values show a noticeable increase in P300 amplitude in the ERP signals received from the Pz, P3, P4, P7, P8, Oz, O1, and O2 channels. This difference between both paradigms is most visible on the P8 channel. In addition, it is observed that there is a decrease in N100 amplitude in the ERPs obtained using the 3D-C paradigm. The mean P300 amplitude and latency values obtained for both paradigms are shown in Figure 11 and 12. Figure 11 shows that the amplitude of P300 received using the 3D-C paradigm is higher than that of the P300 obtained using the 2D-RC paradigm. Figure 12, on the other hand, shows that the P300 latency obtained using the 3D-C paradigm is lower than the P300 latency obtained using the 2D-RC paradigm. From the evaluation of literature studies, it is proposed that high P300 amplitude and low latency values are related to easy tasks. Hence, the proposed 3D-C paradigm suggests an easy-to-use paradigm to be employed in BCI systems compared to the classical 2D-RC paradigm. Therefore, it provides higher performance in such systems.
From a scientific point of view, it has been demonstrated why the 3D paradigm provides more performance in ERP-based studies and is suitable for BCI applications to be used in daily life. By revealing the difference between 2D and 3D paradigms, it has been shown by the experimental study that the 3D paradigm is more suitable for ERP-based BCI applications. In this way, a more performance paradigm has been developed for practical applications.
The study was approved by the ethics committee of Ataturk University of Health Sciences Institute.
This study was supported by the Inter Computer Electronics Ltd., Brain Products GmbH, and the Atatürk University Scientific Research Projects Coordination Unit with the project number: FOA-2018-6524. The data used in this study were recorded at Ataturk University Sports Sciences Application and Research Center.
[1] Cecotti, H., Rivet, B., Congedo, M., Jutten, C., Bertrand, O., Maby, E., Mattout, J. (2010). Sélection de capteurs pour interfaces cerveau-ordinateur de type P300. Traitement du Signal, 27(6): 515-540. https://doi.org/10.3166/ts.27.515-540
[2] Eva, O.D., Lazar, A.M. (2019). Amplitude modulation index as feature in a brain computer interface. Traitement du Signal, 36(3): 201-207. https://doi.org/10.18280/ts.360301
[3] Aggarwal, S., Chugh, N. (2022). Review of machine learning techniques for EEG based brain computer interface. Archives of Computational Methods in Engineering, 1-20. https://doi.org/10.1007/s11831-021-09684-6
[4] Ieracitano, C., Mammone, N., Hussain, A., Morabito, F. C. (2022). A novel explainable machine learning approach for EEG-based brain-computer interface systems. Neural Computing and Applications, 34(14): 11347-11360. https://doi.org/10.1007/s00521-020-05624-w
[5] Kohli, V., Tripathi, U., Chamola, V., Rout, B.K., Kanhere, S.S. (2022). A review on virtual reality and augmented reality use-cases of brain computer interface based applications for smart cities. Microprocessors and Microsystems, 88: 104392. https://doi.org/10.1016/j.micpro.2021.104392
[6] Nojima, I., Sugata, H., Takeuchi, H., Mima, T. (2022). Brain–computer interface training based on brain activity can induce motor recovery in patients with stroke: A meta-analysis. Neurorehabilitation and Neural Repair, 36(2): 83-96. https://doi.org/10.1177/15459683211062895
[7] Arpaia, P., Esposito, A., Natalizio, A., Parvis, M. (2022). How to successfully classify EEG in motor imagery BCI: a metrological analysis of the state of the art. Journal of Neural Engineering. https://doi.org/10.1088/1741-2552/ac74e0
[8] Kevric, J., Subasi, A. (2017). Comparison of signal decomposition methods in classification of EEG signals for motor-imagery BCI system. Biomedical Signal Processing and Control, 31: 398-406. https://doi.org/10.1016/j.bspc.2016.09.007
[9] Stephe, S., Kumar, K.V. (2022). Motor Imagery EEG Recognition using Deep Generative Adversarial Network with EMD for BCI Applications. Tehnički Vjesnik, 29(1): 92-100. https://doi.org/10.17559/TV-20210121112228
[10] Kleih, S.C., Kübler, A. (2013). Empathy, motivation, and P300 BCI performance. Frontiers in Human Neuroscience, 7: 642. https://doi.org/10.3389/fnhum.2013.00642
[11] Sellers, E.W., Krusienski, D.J., McFarland, D.J., Vaughan, T.M., Wolpaw, J.R. (2006). A P300 event-related potential brain–computer interface (BCI): The effects of matrix size and inter stimulus interval on performance. Biological Psychology, 73(3): 242-252. https://doi.org/10.1016/j.biopsycho.2006.04.007
[12] Won, K., Kwon, M., Ahn, M., Jun, S.C. (2022). EEG dataset for RSVP and P300 speller brain-computer interfaces. Scientific Data, 9(1): 1-11. https://doi.org/10.1038/s41597-022-01509-w
[13] Xu, M., Qi, H., Wan, B., Yin, T., Liu, Z., Ming, D. (2013). A hybrid BCI speller paradigm combining P300 potential and the SSVEP blocking feature. Journal of Neural Engineering, 10(2): 026001. https://doi.org/10.1088/1741-2560/10/2/026001
[14] Jalilpour, S., Sardouie, S.H., Mijani, A. (2020). A novel hybrid BCI speller based on RSVP and SSVEP paradigm. Computer Methods and Programs in Biomedicine, 187: 105326. https://doi.org/10.1016/j.cmpb.2020.105326
[15] Muller-Putz, G.R., Pfurtscheller, G. (2007). Control of an electrical prosthesis with an SSVEP-based BCI. IEEE Transactions on Biomedical Engineering, 55(1): 361-364. https://doi.org/10.1109/TBME.2007.897815
[16] Wu, Z., Lai, Y., Xia, Y., Wu, D., Yao, D. (2008). Stimulator selection in SSVEP-based BCI. Medical Engineering & Physics, 30(8): 1079-1088. https://doi.org/10.1016/j.medengphy.2008.01.004
[17] McFarland, D.J., Krusienski, D.J., Sarnacki, W.A., Wolpaw, J.R. (2008). Emulation of computer mouse control with a noninvasive brain–computer interface. Journal of Neural Engineering, 5(2): 101. https://doi.org/10.1088/1741-2560/5/2/001
[18] Cao, L., Li, G., Xu, Y., Zhang, H., Shu, X., Zhang, D. (2021). A brain-actuated robotic arm system using non-invasive hybrid brain–computer interface and shared control strategy. Journal of Neural Engineering, 18(4): 046045. https://doi.org/10.1088/1741-2552/abf8cb
[19] Palumbo, A., Gramigna, V., Calabrese, B., Ielpo, N. (2021). Motor-imagery EEG-based BCIs in wheelchair movement and control: A systematic literature review. Sensors, 21(18): 6285. https://doi.org/10.3390/s21186285
[20] Yin, E., Zhou, Z., Jiang, J., Yu, Y., Hu, D. (2014). A dynamically optimized SSVEP brain–computer interface (BCI) speller. IEEE Transactions on Biomedical Engineering, 62(6): 1447-1456. https://doi.org/10.1109/TBME.2014.2320948
[21] Li, M., Li, F., Pan, J., Zhang, D., Zhao, S., Li, J., Wang, F. (2021). The mindgomoku: An online P300 BCI game based on Bayesian deep learning. Sensors, 21(5): 1613. https://doi.org/10.3390/s21051613
[22] Ahmad, M.M., Ahuja, K. (2022). Role of 5G communication along with blockchain security in brain-computer interfacing: A review. Futuristic Design and Intelligent Computational Techniques in Neuroscience and Neuroengineering, 65-85. https://doi.org/10.4018/978-1-7998-7433-1.ch004
[23] Loizidou, P., Rios, E., Marttini, A., Keluo-Udeke, O., Soetedjo, J., Belay, J., Speier, W. (2022). Extending brain-computer interface access with a multilingual language model in the P300 speller. Brain-Computer Interfaces, 9(1): 36-48. https://doi.org/10.1080/2326263X.2021.1993426
[24] Aydemir, O., Saka, K., Ozturk, M. (2022). Investigating the effects of stimulus duration and inter-stimulus interval parameters on P300 based BCI application performance. Computer Methods in Biomechanics and Biomedical Engineering, 25(14): 1545-1553. https://doi.org/10.1080/10255842.2021.2022127
[25] Obeidat, Q.T., Campbell, T.A., Kong, J. (2015). Introducing the edges paradigm: A P300 brain–computer interface for spelling written words. IEEE Transactions on Human-Machine Systems, 45(6): 727-738. https://doi.org/10.1109/THMS.2015.2456017
[26] Fazel-Rezai, R., Abhari, K. (2009). A region-based P300 speller for brain-computer interface. Canadian Journal of Electrical and Computer Engineering, 34(3): 81-85.
[27] Qu, J., Wang, F., Xia, Z., Yu, T., Xiao, J., Yu, Z., Li, Y. (2018). A novel three-dimensional P300 speller based on stereo visual stimuli. IEEE Transactions on Human-Machine Systems, 48(4): 392-399. https://doi.org/10.1109/THMS.2018.2799525
[28] Zhang, X., Jin, J., Li, S., Wang, X., Cichocki, A. (2021). Evaluation of color modulation in visual P300-speller using new stimulus patterns. Cognitive Neurodynamics, 15(5): 873-886. https://doi.org/10.1007/s11571-021-09669-y
[29] De Venuto, D., Mezzina, G. (2021). A single-trial P300 detector based on symbolized EEG and autoencoded-(1D) CNN to improve ITR performance in BCIs. Sensors, 21(12): 3961. https://doi.org/10.3390/s21123961
[30] Kshirsagar, G.B., Londhe, N.D. (2019). Weighted ensemble of deep convolution neural networks for single-trial character detection in devanagari-script-based P300 speller. IEEE Transactions on Cognitive and Developmental Systems, 12(3): 551-560. https://doi.org/10.1109/TCDS.2019.2942437
[31] Wu, Y., Zhou, W., Lu, Z., Li, Q. (2020). A spelling paradigm with an added red dot improved the P300 speller system performance. Frontiers in Neuroinformatics, 14: 589169. https://doi.org/10.3389/fninf.2020.589169
[32] Lu, Z., Li, Q., Gao, N., Yang, J. (2020). The self-face paradigm improves the performance of the P300-speller system. Frontiers in Computational Neuroscience, 13: 93. https://doi.org/10.3389/fncom.2019.00093
[33] Korkmaz, O.E., Aydemir, O., Oral, E.A., Ozbek, I.Y. (2022). An efficient 3D column-only P300 speller paradigm utilizing few numbers of electrodes and flashings for practical BCI implementation. PloS One, 17(4): e0265904. https://doi.org/10.1371/journal.pone.0265904
[34] Orlandi, A., Proverbio, A.M. (2019). Left-hemispheric asymmetry for object-based attention: An ERP study. Brain Sciences, 9(11): 315. https://doi.org/10.3390/brainsci9110315
[35] Farwell, L.A., Donchin, E. (1988). Talking off the top of your head: toward a mental prosthesis utilizing event-related brain potentials. Electroencephalography and clinical Neurophysiology, 70(6): 510-523. https://doi.org/10.1016/0013-4694(88)90149-6
[36] Ramirez-Quintana, J.A., Madrid-Herrera, L., Chacon-Murguia, M.I., Corral-Martinez, L.F. (2021). Brain-computer interface system based on P300 processing with convolutional neural network, novel speller, and low number of electrodes. Cognitive Computation, 13(1): 108-124. https://doi.org/10.1007/s12559-020-09744-2
[37] Brysbaert, M. (2019). How many words do we read per minute? A review and meta-analysis of reading rate. Journal of Memory and Language, 109: 104047. https://doi.org/10.1016/j.jml.2019.104047
[38] Rakotomamonjy, A., Guigue, V. (2008). BCI competition III: dataset II-ensemble of SVMs for BCI P300 speller. IEEE Transactions on Biomedical Engineering, 55(3): 1147-1154. https://doi.org/10.1109/TBME.2008.915728
[39] Kim, K.H., Kim, J.H., Yoon, J., Jung, K.Y. (2008). Influence of task difficulty on the features of event-related potential during visual oddball task. Neuroscience Letters, 445(2): 179-183. https://doi.org/10.1016/j.neulet.2008.09.004
[40] Polich, J. (1987). Task difficulty, probability, and inter-stimulus interval as determinants of P300 from auditory stimuli. Electroencephalography and Clinical Neurophysiology/Evoked Potentials Section, 68(4): 311-320. https://doi.org/10.1016/0168-5597(87)90052-9