Tong Zhao | Lihao Huang | Junpu Wang | Bocheng Cui | Xiaohu Li | Xicun Zhu*
© 2022 IIETA. This article is published by IIETA and is licensed under the CC BY 4.0 license (http://creativecommons.org/licenses/by/4.0/).
OPEN ACCESS
As an important part of the ecosystem, green vegetation coverage is crucial to people’s sensory and mental health. Using reliable data sets to classify and identify the green vegetation cover on the land surface and explore its spatial distribution law can provide important reference for the work of regional ecosystem managers and urban planners. The optimization of effective screening methods for green vegetation coverage areas is an important requirement to measure the surface vegetation status. UAV aerial images feature high definition, large scale, small area and high up-to-dateness. However, at present, there are few studies based on the reliable UAV aerial image system to identify green vegetation cover and further explore its spatial changes. In this study, 701 residential neighborhoods in Beijing were taken as the research objects, and the green vegetation of 7,695 sample points was identified by UAV. The green vegetation coverage was measured, and the spatial distribution pattern of green vegetation in different land surface areas was quantitatively compared. The results show that the image processing method proposed in this paper can effectively detect the boundary of green vegetation cover area from UAV aerial images, the correlation of texture segmentation is good, and the segmentation performance is better than other methods. The distribution of green vegetation cover in the research target area is uneven, with 63.79% of the research area having relatively low (Level 2) and medium (Level 3) green vegetation coverage, which indicates that the green vegetation coverage area in the research area is insufficient to meet the needs of regional ecosystem development. The characteristics of green vegetation cover in 16 districts in the study area are different, showing different spatial distribution patterns; except Xicheng District, there are 211 points without landscape in the area covered by green vegetation in 15 districts. The results can provide support for urban land surface planning and management.
green vegetation coverage, image texture segmentation, land surface, UAV image
Arbors, shrubs, vines, herbs, bamboos, lawns and other green vegetation on the land surface have become an important part of the ecosystem. Green vegetation coverage is vital to people’s sensory and mental health [1-6]. Since 2019, the rapid prevalence of novel coronavirus disease (COVID-19) has brought a profound impact on people’s work and life. The green vegetation coverage on the land surface effectively alleviates the residents’ psychological pressure and depression through its visual effect. If the green vegetation cover on the land surface is uneven in the area, it is easy to be destroyed or removed due to private occupation. The use of reliable data sets to classify and identify the green vegetation cover on the land surface and explore its spatial distribution can provide important reference for the work of regional ecosystem managers and urban planners [7-13].
Conventional green vegetation coverage survey includes field survey and remote sensing monitoring [14-18]. Since the greening situation calculated based on satellite remote sensing images only roughly extracts and characterizes the features and conditions of green vegetation canopy, which is in low consistency with the actual situation [19-22]. In addition, most of the commonly used remote sensing images are acquired by passive detection technology. The image volume is large and the data types are diverse, which may have display problems or be interfered by entities such as cloud, precipitation and haze. In contrast, UAV aerial images have the advantages of high definition, large scale, small area and high up-to-dateness.
Meyer and Okin [23] tested the performance of spectral mixture analysis (SMA) and multiple endmember spectral mixture analysis (MESMA) to estimate heterogeneous and non-photosynthetic vegetation (NPV) and soil composition. The savanna with complicated structure in the Western Kalahari was studied with the reflection adjustment product based on the Nadir bidirectional reflection distribution function with moderate resolution imaging spectroradiometer (MODIS). Vegetation plays an important role in the exchange of carbon, water and energy on the land surface. Vegetation coverage is one of the most important variables in surface simulation. In literature [24], more attention is paid to green vegetation coverage, and strict geometric and radiation pretreatment ensures the necessary accuracy of HJ-1 CCD data. After that, the linear spectral hybrid model and NDVI-based model were used to generate the vegetation fraction image. According to the obtained map, the spatial pattern of vegetation coverage was explained. Ling et al. [25] proposed a semantic segmentation method for UAV aerial remote sensing image based on deep learning. The improved coding-decoding network gradually enhances the extraction of details and reduces the number of parameters. Based on ISegNet network, five classification problems are transformed into five binary classification problems for network training to obtain high-precision image semantic segmentation results. In recent years, UAV remote sensing images with high spatial resolution have been widely used to estimate the physical and chemical parameters of crops. The purpose of Deng [26] is to explore whether background pixel removal is used to improve the inversion accuracy of crop chlorophyll content and leaf area index. The spectral information of vegetation pixels is extracted to build the estimation model of physical and chemical parameters of winter wheat. The high-resolution UAV multispectral image is adopted to perform the vegetation index threshold segmentation to further improve the inversion accuracy of SPAD, LAI and CCC. The results can provide technical support for growth monitoring and yield prediction of winter wheat. Sharma and Verma [27] propose a method to estimate the size of flood area by analyzing aerial images acquired from unmanned aerial vehicles (UAVs). The method calculates two parameters: one is based on unsupervised image segmentation, and the other is based on the image similarity between input and submerged images. The literature uses these parameters to establish models to estimate flood magnitude in aerial images. The proposed method was evaluated with the FloodNet dataset and a FI score of 0.90 was obtained. The robustness of the algorithm is proved.
At present, few studies identify green vegetation cover based on reliable UAV aerial image system and further explore its spatial changes. Taking appropriate methods according to the actual conditions of different green vegetation coverage areas will be more helpful to the high-precision screening of green vegetation coverage areas and the identification of their boundaries, and further realize their texture segmentation. Therefore, this paper studies the effective screening and texture segmentation of green vegetation coverage area based on UAV images. In Chapter 2, the boundary detection of green vegetation coverage area is carried out, the detection process is provided, and the scientific loss function is constructed. In Chapter 3, the paper studies the green vegetation coverage area segmentation technology based on deep learning, optimizes the performance of the constructed model by adjusting its structure and parameters, and finally realizes the green vegetation coverage area segmentation on the land surface based on pixel level. The experimental results verify the validity of the model and present the analysis results of the study area. The results can provide support for urban land surface planning and management.
The boundary detection of the green vegetation covered area is mainly used to distinguish the green vegetation covered area and the non-green vegetation coverage area in the current target area, so as to realize the prediction of the green vegetation coverage degree, which plays an indispensable role in the analysis of the vegetation coverage evolution law.
Now the input UAV aerial image A is provided. Assuming that the constructed detection model can support the detection of D boundaries of the green vegetation covered areas at most, the input UAV aerial image is divided into f rectangles with a width of 1 pixel, and each rectangle is divided into θ rectangles. The classifier is represented by gij(.) and can output the position of the rectangle where the $i(i \in[1, D])_{\text {th }}$ boundary of the green vegetation coverage area is located from the $j \in[1, f]_{\text {th }}$ rectangle. Then the probability that the pixel of the jth rectangle sample in the UAV aerial image belongs to the jth area can be calculated by the following formula:
$T_{i, j}=g^{i j}(A), i \in[1, D], j \in[1, f]$ (1)
The obtained Ti,j is a vector of θ+1. When all rectangles in a row do not belong to the ith boundary of the green vegetation covered area, θ elements before Ti,j are all zero and the (θ+1) th element is 1.
Based on the above analysis, the tag Pi,j of this task is the independent heat vector of θ+1 dimension. The realization of the boundary detection task of the green vegetation covered area based on the constructed detection model is to continuously minimize the classification loss function SQUT. Assuming that the cross entropy loss function is represented by SQDO, then:
$S Q_{U T}=\sum_{i=1}^D \sum_{j=1}^f S Q_{D O}\left(T_{i, j}, P_{i, j}\right)$ (2)
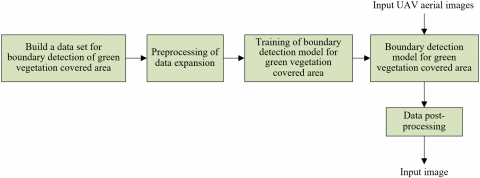
The whole process of boundary detection of green vegetation covered area is as follows: first, build a data set for boundary detection of green vegetation covered area. In view of the problems such as insufficient number and poor quality of the data set, the original input UAV aerial images that complete label matching need to be pre-processed for data expansion. Only the geometric characteristics and texture structure of the original input UAV aerial images are changed, so as to improve the model performance.
Figure 1. Boundary detection process of green vegetation covered area
Figure 1 shows the boundary detection process of green vegetation covered area. In the boundary detection task of the green vegetation covered area, the input UAV aerial image will eventually output a list when passing through the neural model. The items in the list are the confidence scores of the input UAV aerial image belonging to a certain category, which are represented by ci. In order to improve the intuitiveness of the numerical value, it is transformed in the form of probability in this paper. The formula is as follows:
$w_i=\frac{\exp \left(c_i\right)}{\sum_{j=1}^L \exp \left(c_j\right)}$ (3)
The cross entropy loss function can be calculated based on the tag value and the predicted value of the input sample:
$S Q=-\sum_{i=1}^L J C_i \log w_i$ (4)
Assuming that the real label is represented by Ω, JCi satisfies:
$J C_i=\left\{\begin{array}{l}1, \text { if }(i=\Omega) \\ 0, \text { if }(i \neq \Omega)\end{array}\right.$ (5)
The optimal prediction probability distribution ci of the model output is given by the following formula:
$C_i=\left\{\begin{array}{l}+\infty, \text { if }(i=\Omega) \\ 0, \text { if }(i \neq \Omega)\end{array}\right.$ (6)
Assuming that σ is a small hyper-parameter. The distribution of prediction probability GU'I of model output after preprocessing is given by the following formula:
$G U_i^{\prime}=\left\{\begin{array}{l}(1-\sigma), \text { if }(i=\text { target }) \\ \frac{\sigma}{L-1}, \text { if }(i \neq \text { target })\end{array}\right.$ (7)
The cross entropy loss function SQ' after change can be calculated by the following formula:
$S Q^{\prime}=\left\{\begin{array}{l}(1-\sigma)^* S Q, \text { if }(i=\text { target }) \\ \sigma^* S Q, \text { if }(i \neq \text { target })\end{array}\right.$ (8)
Assuming that β is an arbitrary real number, the following formula gives the corresponding optimal prediction probability distribution expression:
$C_i^{\prime}=\left\{\begin{array}{l}\log \frac{(l-1)(1-\sigma)}{\sigma+\beta}, \text { if }(i=\text { target }) \\ \beta, \text { if }(i \neq \text { target })\end{array}\right.$ (9)
Finally, the performance of the boundary detection model of green vegetation covered area was improved by modifying the loss function, which significantly reduced the output difference of the positive and negative samples of the predicted UAV aerial images, and effectively solved the defects of the built model such as over fitting and poor generalization ability.
The constructed detection model regards the boundary detection problem of green vegetation covered area as a line search problem based on the characteristics of the global UAV aerial image, which is actually to define multiple line coordinates in the UAV aerial image in advance, and divide each line into multiple cells. By predicting whether there are green vegetation coverage area boundaries in each cell and the probability of each boundaries of the green vegetation covered area in the label, the boundary detection of the green vegetation covered area is realized.
At the same time, in order to constrain the shape of the boundary of the green vegetation covered area, the following two auxiliary loss functions are added:
1) Most of the boundaries of green vegetation covered areas in UAV aerial images are continuous and cannot be mutated, which requires that the cell number of the same boundary of green vegetation covered area in adjacent rectangles will not change too much. It is assumed that the number of boundaries of green vegetation covered area of the input UAV aerial image is represented by D and the number of rectangles is represented by f. In this paper, the similarity loss function is used to characterize the difference between adjacent rectangular classification vectors:
$K_{S I M}=\sum_{i=1}^D \sum_{j=1}^{f-1}\left\|T_{i, j}-T_{i, j+1}\right\|_1$ (10)
2) Because the boundary shape of the green vegetation covered area is mainly curve, the second-order difference equation is used to constrain the shape characteristics of the curve. It is assumed that the variable value corresponding to the maximum value of the function is represented by the function argmax(.), and the number of cells divided by each rectangle is represented by θ. For the ith boundary of the green vegetation covered area in the jthrectangle, the position PLAi,j of the boundary point in the green vegetation covered area can be calculated by the following formula:
$P L A_{i, j}=\underset{l}{\operatorname{argmax}} G U_{i, j, l}, l \in[1, \theta]$ (11)
Since the operation of the function argmax (.) is non-differentiable, the expected value of the prediction vector is approximately equivalent to the boundary point position of the green vegetation covered area. First, normalize the boundary prediction vector of the green vegetation covered area based on the softmax function to obtain the probability characteristic PGUi,j:
$P G U_{i, j}=\operatorname{softmax}\left(G U_{i, j, 1: \theta}\right)$ (12)
Then, the expectation is approximated to obtain the position PLAi,j of the boundary point in the green vegetation coverage area.
$P L A_{i, j}=\sum_{l=1}^\theta l \cdot P G U_{i, j, l}$ (13)
Finally, the shape loss function SQTR can be obtained by performing second-order difference on the boundary point position of the green vegetation covered area:
$S Q_{T R}=\sum_{i=1}^D \sum_{j=1}^{f-2}\left\|\left(P L A_{i, j}-S Q_{i, j+1}\right)-\left(P L A_{i, j+1}-S Q_{i, j+2}\right)\right\|_1$ (14)
The use of second-order difference can make the shape feature constraint of the curve less strong, and when the boundary of the green vegetation covered area is highly irregular, the prediction model can also handle it well. It is assumed that the similarity loss function using the first-order difference is represented by SQSIM, the shape loss function using the second-order difference is represented by SQSHA, the structural loss function is represented by SQST, and the hyper-parameters adjusted during the training of the prediction model are represented by μ. SQST can be generated by combining the linear changes of SQSIM and SQSHA, that is:
$S Q_{S T}=S Q_{S I M}+\mu S Q_{S H A}$ (15)
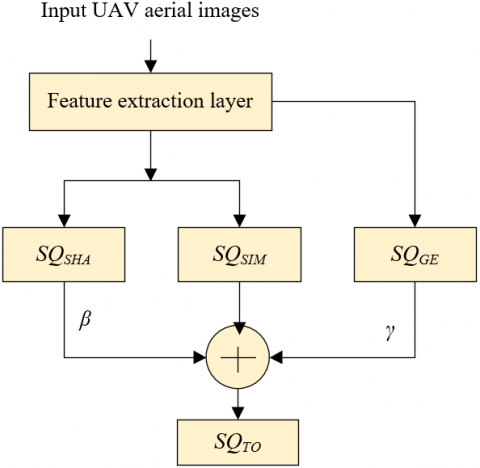
It is assumed that the overall loss function of the model is represented by SQTO, the division loss of the green vegetation covered area is represented by SQGE, and the super parameter is represented by β and γ, SQTO can be generated by combining the linear changes of SQSIM, SQSHA and SQGE, that is:
$S Q_{T O}=S Q_{S I M}+\beta S Q_{S H A}+\gamma S Q_{G E}$ (16)
Figure 2 shows the loss function of the detection model for the boundary of the green vegetation covered area.
Figure 2. Loss function of boundary detection model of green vegetation covered area
In this paper, the segmentation technology of green vegetation covered area based on deep learning is studied. By adjusting the constructed model structure and parameters, the performance of the model is optimized, and finally the green vegetation coverage area segmentation on the land surface based on pixel level is carried out.
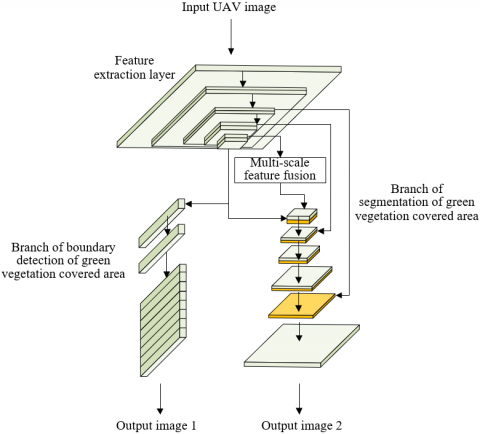
Figure 3. Multi-task model structure framework
In this paper, two tasks of boundary detection and segmentation of the green vegetation covered area are selected for multi-task learning, and a multi-task model framework is built based on the hard parameter sharing mechanism. Figure 3 shows the structural framework of the multitasking model. In the model, the feature sharing of two tasks is realized by sharing a feature filtering layer. In the deep layer of the model, the two tasks are divided into the branches of processing the feature map provided by the bottom layer, thus realizing the boundary detection and segmentation of the green vegetation covered area. This paper mainly uses ResNet18 and RepVGG as the feature sharing module architecture. For the design of the model structure built by the branch task, this paper modifies the UFLD network architecture to achieve the segmentation of green vegetation covered area.
The relationship between the two tasks of boundary detection and segmentation of the green vegetation coverage area in the built multi-task model is realized by the loss function, which further completes the end-to-end training of the model. The weight of each task loss function has a great impact on the performance of the multi-task model. Therefore, how to reasonably weight the two tasks is very critical to the learning mode of the multi task model. In order to improve the training efficiency of the constructed model, the loss function strategy adopted in this paper is manually weighted at the initial stage and automatically weighted at the later stage. The automatic weighting method introduces noise parameters the same as the number of tasks, and can automatically adjust the weights of the two task loss functions based on the maximization of Gaussian likelihood estimation. It is assumed that the loss function of the green vegetation coverage area boundary detection task is represented by PG1 (Q) and the loss function of the green vegetation coverage area segmentation task is represented by PG2(Q). The following formula presents the joint loss expression of the constructed multi task model:
$S D=\frac{1}{2 \varepsilon_1^2} P G_1(Q)+\frac{1}{\varepsilon_2^2} P G_2(Q)+\log \varepsilon_1+\log \varepsilon_2$ (17)
The optimization process of the constructed model is to find the optimal values of Q, ε1 and ε2.
4.1 Data collection overview
The research area of this paper covers 16 districts in Beijing: Changping District (hereinafter referred to as CP), Chaoyang District (CY), Dongcheng District (DC), Daxing District (DX), Fangshan District (FS), Fengtai District (FT), Haidian District (HD), Huairou District (HR), Mentougou District (MTG), Miyun District (MY), Pinggu District (PG), Shijingshan District (SJS), Shunyi District (SY), Tongzhou District (TG), Xicheng District (XC) and Yanqing District (YQ), with a total area of 16,396.54 km2. In order to screen the green vegetation coverage of the land surface in the study area and compare its spatial diversity, all the land surfaces covered by UAV aerial images in the study area were identified. The total length of the road network in the study area is 79.40 km. In consideration of the visible distance within the neighborhood, the minimum distance between two adjacent sampling points is taken as 100 m, and 7,940 sampling points are randomly selected in the road network. Then all sampling points are checked to ensure that the aerial images of UAV can be used for research, and 245 candidate sampling points that are too close to other stations at the intersection are removed. Finally, 7,695 sampling points are obtained and encoded with sequence BSV-ID (0-7694). See Table 1 for details.
Table 1. Coded experimental data
|
Area number |
Number of sub-area |
Number of sampling point |
Area number |
Number of sub-area |
Number of sampling point |
|
CP |
92 |
1062 |
MTG |
8 |
47 |
|
CY |
107 |
1376 |
MY |
22 |
266 |
|
DC |
22 |
227 |
PG |
27 |
179 |
|
DX |
33 |
426 |
SJS |
49 |
467 |
|
FS |
27 |
280 |
SY |
14 |
228 |
|
FT |
94 |
1028 |
TZ |
75 |
884 |
|
HD |
68 |
689 |
XC |
24 |
165 |
|
HR |
30 |
294 |
YQ |
9 |
77 |
4.2 Verification of experimental results
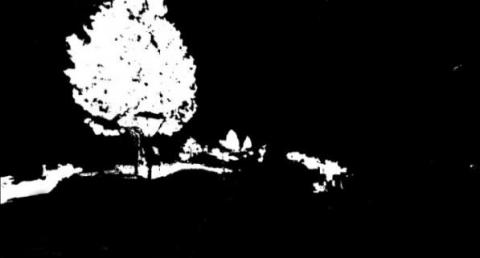
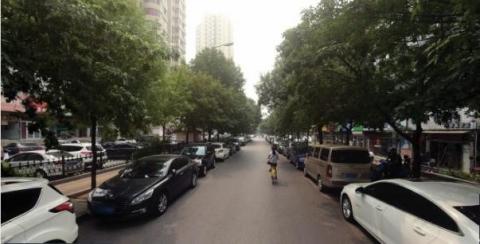
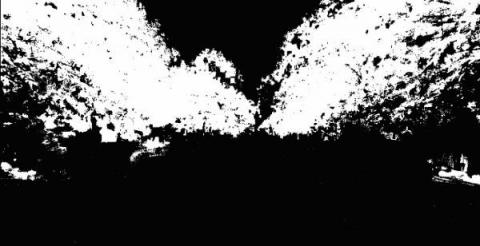
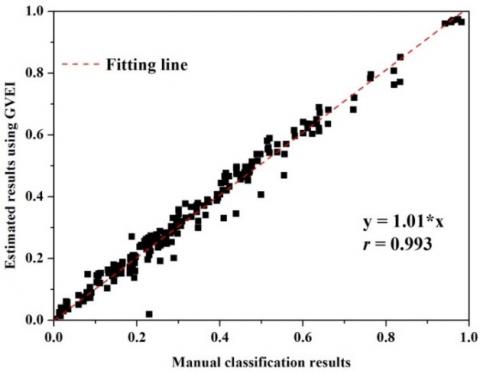
The constructed image segmentation model is applied to 7,695 UAV aerial images, and the results are stored in GIS database for further analysis. The green vegetation coverage of two randomly selected UAV aerial images is shown in Figure 4. The green vegetation in the aerial image of UAV is classified, which is represented by white and other features are represented by black. It can be found that the constructed model can better identify the green vegetation in UAV aerial images. In order to further verify the classification accuracy, 200 UAV aerial images are randomly selected from the UAV aerial image data set to calculate the classification accuracy, and the green vegetation recognition result (dependent variable) is compared with the manual description result (independent variable). The results show that, compared with other models, the accuracy of recognition of the green vegetation cover of the model built in this paper improved by 18%, which is more suitable for green vegetation cover recognition in UAV aerial images The fitting results are shown in Figure 5, where the red dotted line is the fitting dotted line between the independent variable and the dependent variable. The Pearson’s r=0.993 and P=0.000 of the fitting results indicate that the regional classification of green vegetation based on the model constructed in this paper is closely related to the reference classification.
(a)
(b)
(c)
(d)
Figure 4. Comparison of green vegetation classification results of different UAV aerial images
Figure 5. Regression analysis results of the constructed model
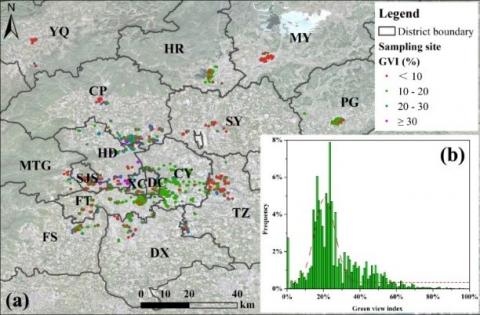
The green scene index of each sampling point and the frequency calculation results of corresponding levels are shown in Figure 6. The color of the points represents the percentage of green vegetation at each sampling point. A large number of sampling points are warm (red and orange), indicating that the green vegetation coverage in the study area is low and relatively low. The green and blue dots represent the medium and high distribution of green vegetation, which does not seem to be widespread in the study area.
Figure 6. Regression analysis results of the constructed model
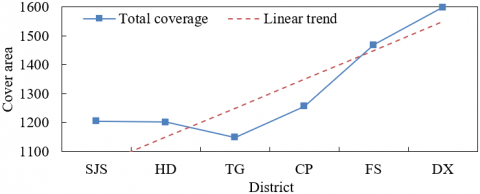
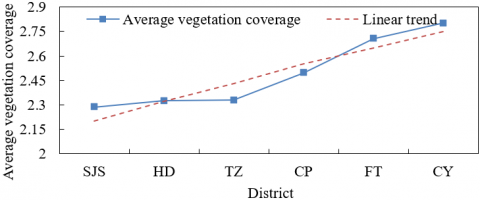
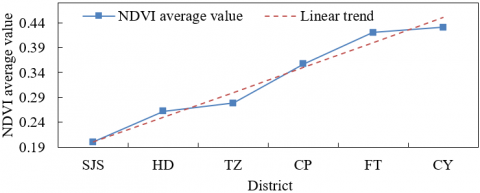
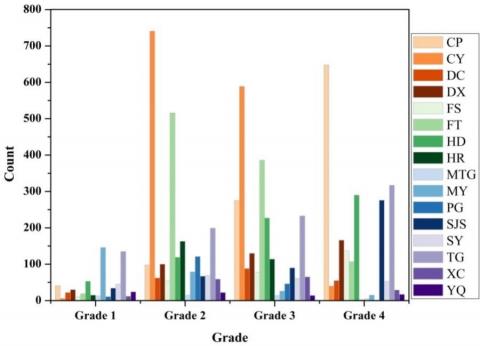
There are differences in vegetation greening in 16 regions, showing different (or unequal) spatial distribution patterns, which can be divided into three categories. In the CP area, SJS area, FS area, HD area, DX area and TG area, the prevailing green scene index levels are grade 4 (green scene index≥30%) and grade 3 (green scene index∈(20%, 30%). Figure 7 shows the green vegetation coverage area, average vegetation coverage and NDVI average of the corresponding areas. Residents living in these areas may encounter more visible green vegetation when standing or walking on the roads in the community. In CY, DC, FT, HR, MTG, PG, SY and XC, the main level of green landscape index is level 3 (green landscape index∈[20%, 30%) and level 2 (green landscape index∈[10%, 20%). The greening degree of residential communities in these eight districts is lower than that in the first six districts. See the statistical results of greening landscape index grading of each district shown in Figure 8 for details. MY and YQ on the left are mainly on level 1 (the green landscape index is less than 10%) and level 2. The residential communities in these two areas lack maintenance and planning of green vegetation.
(a)
(b)
(c)
Figure 7. Change Trend of green vegetation cover area, average vegetation coverage and average NDVI value
Figure 8. Statistical results of green landscape index grading in each district
4.3 Discussion
This research builds a multi-task model based on the hard parameter sharing mechanism for the first time, and realizes the recognition and spatial change monitoring of green vegetation cover on the land surface. The results show that the model can filter additional spectral information from aerial images of UAV without near-infrared information to improve the classification and evaluation accuracy of green vegetation cover. The distribution of green vegetation in the study area is uneven, and there are differences among districts, showing different spatial distribution patterns.
Different from traditional satellite remote sensing images, UAV aerial images can not only capture and record images from people’s profile perspective, but also measure green vegetation coverage from the perspective of people standing on the road or walking on the road. As a promising information source, UAV aerial images are used to detect and evaluate the green vegetation coverage in different areas of the city. Therefore, compared with satellite remote sensing images, UAV aerial images are more valuable in residential community planning and management.
The traditional method uses the grid cover method to manually identify and quantify the urban street greening vegetation from the profile, which is time-consuming and labor-consuming. With the development of remote sensing images and the introduction of multispectral classification methods, the efficiency and accuracy of green vegetation recognition based on remote sensing image data sets are improved. However, due to the lack of spectral overlap in the near-infrared band and R, G and B bands, the traditional monitoring method can directly misclassify the green vegetation cover and other common features in UAV aerial images. Compared with traditional monitoring methods, the model constructed in this paper can effectively obtain additional useful spectral information from UAV aerial images, thus improving the accuracy of green vegetation recognition.
The planning policy of urban population growth and urban concentration may promote the transformation of green vegetation covered areas to residential land, which is more serious in China. This paper further screens some areas of Beijing and explores the distribution pattern of green vegetation. The results show that more than 60% of the research sites have lower green sight index.
Although the UAV aerial images and the built model can accurately identify the green vegetation cover in the study area, there are some limitations in this study. First, due to the impact of COVID-19, it is temporarily impossible to interview community residents and ask them for their suggestions on the green landscape index grading and research results. It needs to be explored through more interviews and inspections in future studies. Secondly, in the study area, the spectral changes of trees and grasses are the same, and their effects on people’s happiness are similar, and they are not separately distinguished; further studies will focus on their changes in other seasons.
In this paper, the effective screening and texture segmentation of green vegetation coverage based on UAV images are studied. In Chapter 2, the boundary detection of green vegetation coverage area is carried out, the detection process is given, and the scientific loss function is constructed. In Chapter 3, the paper studies the green vegetation coverage area segmentation technology based on deep learning, and optimizes its performance by adjusting the model structure and parameters, and finally realizes the green vegetation coverage area segmentation on the land surface based on pixel level. The results of green vegetation classification of aerial images obtained by different UAVs are compared with experiments. It can be found that the model can better identify the green vegetation in UAV aerial images. The regression analysis results of the model are provided, which verifies that the regional classification of green vegetation based on the constructed model is closely related to the reference classification. The green landscape index and the frequency calculation results of the corresponding grade of each sampling point, the classification statistical results of the green landscape index of each district, and the green vegetation coverage area, the average vegetation coverage and the NDVI mean change trends in some areas are given, showing the spatial distribution pattern differences of the vegetation greening in 16 regions. The relevant research results can provide support for urban land surface planning and management.
[1] Ding, Y., Wang, F., Mu, Q., et al. (2021). Estimating land use/land cover change impacts on vegetation response to drought under ‘Grain for Green’in the Loess Plateau. Land Degradation & Development, 32(17): 5083-5098. https://doi.org/10.1002/ldr.4093
[2] Dai, J., Roberts, D.A., Stow, D.A., An, L., Zhao, Q. (2020). Green vegetation cover has steadily increased since establishment of community forests in western Chitwan, Nepal. Remote Sensing, 12(24): 4071. https://doi.org/10.3390/rs12244071
[3] Xu, D., Pu, Y., Guo, X. (2020). A semi-automated method to extract green and non-photosynthetic vegetation cover from RGB images in mixed grasslands. Sensors, 20(23), 6870. https://doi.org/10.3390/s20236870
[4] He, Y., Yang, J., Guo, X. (2020). Green vegetation cover dynamics in a heterogeneous grassland: Spectral unmixing of landsat time series from 1999 to 2014. Remote Sensing, 12(22): 3826. https://doi.org/10.3390/rs12223826
[5] Filipponi, F., Valentini, E., Nguyen Xuan, A., et al. (2018). Global MODIS fraction of green vegetation cover for monitoring abrupt and gradual vegetation changes. Remote Sensing, 10(4): 653. https://doi.org/10.3390/rs10040653
[6] Van de Voorde, T. (2017). Spatially explicit urban green indicators for characterizing vegetation cover and public green space proximity: A case study on Brussels, Belgium. International Journal of Digital Earth, 10(8): 798-813. https://doi.org/10.1080/17538947.2016.1252434
[7] Trisakti, B. (2017). Vegetation type classification and vegetation cover percentage estimation in urban green zone using pleiades imagery. IOP Conference Series: Earth and Environmental Science, 54(1): 012003. https://doi.org/10.1088/1755-1315/54/1/012003
[8] Mayes, M., Mustard, J., Melillo, J., Neill, C., Nyadzi, G. (2017). Going beyond the green: Senesced vegetation material predicts basal area and biomass in remote sensing of tree cover conditions in an African tropical dry forest (miombo woodland) landscape. Environmental Research Letters, 12(8): 085004. https://doi.org/10.1088/1748-9326/aa7242
[9] Bian, J., Li, A., Zhang, Z., et al. (2017). Monitoring fractional green vegetation cover dynamics over a seasonally inundated alpine wetland using dense time series HJ-1A/B constellation images and an adaptive endmember selection LSMM model. Remote Sensing of Environment, 197: 98-114. https://doi.org/10.1016/j.rse.2017.05.031
[10] Thomsit-Ireland, F., Essah, E.A., Hadley, P., Blanuša, T. (2020). The impact of green facades and vegetative cover on the temperature and relative humidity within model buildings. Building and Environment, 181: 107009. https://doi.org/10.1016/j.buildenv.2020.107009
[11] Potter, C. (2019). Changes in vegetation cover of the arctic national wildlife refuge estimated from Modis greenness trends, 2000–18. Earth Interactions, 23(4): 1-18. https://doi.org/10.1175/EI-D-18-0018.1
[12] Wang, Z., Kim, Y., Seo, H., Um, M.J., Mao, J. (2019). Permafrost response to vegetation greenness variation in the Arctic tundra through positive feedback in surface air temperature and snow cover. Environmental Research Letters, 14(4): 044024. https://doi.org/10.1088/1748-9326/ab0839
[13] Song, W., Mu, X., Yan, G., Huang, S. (2015). Extracting the green fractional vegetation cover from digital images using a shadow-resistant algorithm (SHAR-LABFVC). Remote Sensing, 7(8): 10425-10443. https://doi.org/10.3390/rs70810425
[14] Yoon, S., Kim, T. (2022). Tin-based robust mosaicking of UAV images with consecutive image connection. The International Archives of Photogrammetry, Remote Sensing and Spatial Information Sciences, 43: 423-430. https://doi.org/10.5194/isprs-archives-XLIII-B1-2022-423-2022
[15] Sangjan, W., McGee, R.J., Sankaran, S. (2022). Optimization of UAV-based imaging and image processing orthomosaic and point cloud approaches for estimating biomass in a forage crop. Remote Sensing, 14(10): 2396. https://doi.org/10.3390/rs14102396
[16] Lalak, M., Wierzbicki, D. (2022). Methodology of detection and classification of selected aviation obstacles based on UAV dense image matching. IEEE Journal of Selected Topics in Applied Earth Observations and Remote Sensing, 15: 1869-1883. https://doi.org/10.1109/JSTARS.2022.3149105
[17] Chakhvashvili, E., Siegmann, B., Muller, O., Verrelst, J., Bendig, J., Kraska, T., Rascher, U. (2022). Retrieval of crop variables from proximal multispectral UAV image data using PROSAIL in maize canopy. Remote sensing, 14(5) 1247. https://doi.org/10.3390/rs14051247
[18] Liu, Z., Su, B., Lv, F. (2022). Intelligent identification method of crop species using improved u-net network in UAV remote sensing image. Scientific Programming, 2022: 9717843. https://doi.org/10.1155/2022/9717843
[19] Fu, B., Zuo, P., Liu, M., et al. (2022). Classifying vegetation communities karst wetland synergistic use of image fusion and object-based machine learning algorithm with Jilin-1 and UAV multispectral images. Ecological Indicators, 140: 108989. https://doi.org/10.1016/j.ecolind.2022.108989
[20] Gu, L., Meng, J. (2022). Wireless sensor system of UAV infrared image and visible light image registration fusion. Journal of Electrical and Computer Engineering, 2022: 9245014. https://doi.org/10.1155/2022/9245014
[21] Qi, J., Chen, H., Chen, F. (2022). Extraction of landslide features in UAV remote sensing images based on machine vision and image enhancement technology. Neural Computing and Applications, 34(15): 12283-12297. https://doi.org/10.1007/s00521-021-06523-4
[22] Cui, D., Chen, L., Ou, C. (2021). Application of image processing technology in target recognition by UAV. In International Conference on Machine Learning and Big Data Analytics for IoT Security and Privacy, Shanghai, China, pp. 276-283. https://doi.org/10.1007/978-3-030-89511-2_35
[23] Meyer, T., Okin, G.S. (2015). Evaluation of spectral unmixing techniques using MODIS in a structurally complex savanna environment for retrieval of green vegetation, nonphotosynthetic vegetation, and soil fractional cover. Remote Sensing of Environment, 161: 122-130. https://doi.org/10.1016/j.rse.2015.02.013
[24] Liu, S., Li, Q. (2011). A study on green vegetation cover fraction based on HJ-1 CCD image. In 2011 19th International Conference on Geoinformatics, Shanghai, China, pp. 1-4. https://doi.org/10.1109/GeoInformatics.2011.5980783
[25] Ling, M., Cheng, Q., Peng, J., Zhao, C., Jiang, L. (2022). Image semantic segmentation method based on deep learning in UAV aerial remote sensing image. Mathematical Problems in Engineering, 2022: 5983045. https://doi.org/10.1155/2022/5983045
[26] Deng, S.Q., Zhao, Y., Bai, X.Y., et al. (2022). Inversion of chlorophyll and leaf area index for winter wheat based on UAV image segmentation. Transactions of the Chinese Society of Agricultural Engineering, 38(3): 136-145.
[27] Sharma, A., Verma, U. (2021). Flood magnitude assessment from UAV aerial videos based on image segmentation and similarity. In TENCON 2021-2021 IEEE Region 10 Conference (TENCON), Auckland, New Zealand, pp. 476-481. https://doi.org/10.1109/TENCON54134.2021.9707250