Yang Tang | Chenping Xi | Zhen Gong | Lin Li*
© 2022 IIETA. This article is published by IIETA and is licensed under the CC BY 4.0 license (http://creativecommons.org/licenses/by/4.0/).
OPEN ACCESS
In recent years, the incidence of scoliosis is rising among adolescents. Considering the radiation hazards of X-ray detection, this paper intends to develop an effective non-radiation detection method for scoliosis. The research method consists of the following steps: (1) Collect clear an image of the back of the patient with a high-resolution digital camera, and optimize the image through preprocessing; (2) Segment the region of interest (ROI) of the back and spine to reduce the complexity of subsequent calculations; (3) Extract the back contour and mark the feature points; (4) Extract features according to the grayscale change of the spine ROI, and fit the spine midline according to the feature points; (5) Evaluate the degree of scoliosis according to the symmetry of the posture features and the Cobb angle of the spine midline. Finally, experimental results were analyzed, which indicate that the proposed scoliosis detection method can preliminarily evaluate the posture features. The scoliosis detection error fell in the reasonable range (0-4 degrees), when the subjects had a Cobb angle between 0 and 30 degrees. Hence, our algorithm is accurate and effective, and provides a low-cost, efficient solution for scoliosis detection.
digital image processing, region of interest (ROI), feature extraction, Cobb angle, curve fitting, scoliosis
In recent years, the incidence of scoliosis in adolescents has been increasing year by year. The disease poses a serious threat to the physical and mental health of adolescents. If it cannot be detected and corrected early, scoliosis may develop into deformity in the long run. In severe cases, it may lead to cardiopulmonary dysfunction, paralysis, and death [1]. Scoliosis refers to the three-dimensional deformity of the spine: the vertebral bodies of the spine curve laterally, possibly accompanied by anteroposterior protrusion of the vertebrae in the sagittal plane and rotation of the vertebrae [2]. The International Society on Scoliosis Orthopaedic and Rehabilitation Treatment defined scoliosis as follows: After an X-ray image is taken of an upright spine, the curvature of the spine is measured by the Cobb angle method. If the measured angle is greater than 10°, it is called scoliosis [3].
Adolescent idiopathic scoliosis (AIS) is the most common spinal disease in adolescents, with a worldwide prevalence of 0.5-5.2% [4]. It is the fifth most common disease, after vision disorder, obesity, phimosis, and psychosocial disorder [5]. Scoliosis in children or adolescents is mainly screened by manual physical detection or X-ray detection [6]. Manual physical detection is inefficient and dependent on the clinical experience of doctors. It is difficult to analyze the spine condition of the patient fully or systematically, and may lead to misdiagnosis. X-ray detection the standard way to define scoliosis. It measures the Cobb angle of scoliosis based on the upright back X-ray of the human body. The disadvantage is that X-rays are radioactive, which brings radiation damages to adolescents and children. Therefore, both methods cannot be easily applied to a large group of people, not to mention the routine physical examinations of adolescents. Meanwhile, D'Osualdo et al. [7] pointed out a major limitation of X-ray detection: it can only detect the curvature of the coronal plane of the spine, failing to capture the rotation of the vertebral body.
In response to the above problems, scholars at home and abroad have developed image detection methods through extensive research. In 2004, Ramirez et al. used a laser scanner to obtain the three-dimensional information of the depth image on the back of the human body, and extracted image features through symmetrical back extraction. The recognition rate was as high as 85% [8]. From 2001 to 2008, Kim et al. [9-11] calculated and judged the Cobb angle of scoliosis repeatedly, using the asymmetry of the Moiré fringes on the back. In 2008, Berryman et al. [12] obtained three-dimensional data under rectangular structured light, and used the data to reconstruct the back of the human body in a three-dimensional manner. The degree of scoliosis was evaluated based on the back symmetry features in the three-dimensional model. The above studies show that the image detection method is superior to manual physical detection and X-ray detection.
In 2016, the German spine analysis system DIERS [13] utilized moiré topography and optical triangulation to irradiate visible light to the patient's back through a grating plate, producing parallel and equal distance spectra. Then, three-dimensional scanning was performed to reconstruct the spectra of the patient's back. After that, the three-dimensional live image of the spine was generated by a biomechanical model. The DIERS four-dimensional motion system [14] can continuously scan the three-dimensional contour of the person's back during exercise, such as to calculate the degree of scoliosis during exercise, the degree of pelvic tilt, etc. Studies have shown that the DIERS scoliosis measurement system can achieve harmless and rapid measurement. However, only a few large hospitals have introduced the system, owing to its high price. Hence, it is impossible to replace the traditional scoliosis detection with the DIERS in practice.
This paper presents an economical and convenient solution, which overcomes the tedious operations and low efficiency of manual physical detection, and the radiation damages of X-ray detection, facilitating the large-scale scoliosis survey of adolescents. Specifically, image detection was adopted to process the extracted back image, and label the feature points of the back and the midline of the spine. In addition, the Cobb angle of the spine midline was solved to judge whether the spine bends laterally. Finally, the experimental results were compared with the detection results of DIERS formetric III 4D. The comparison demonstrates the effectiveness and accuracy of the proposed method.
The remainder of this paper is organized as follows: Section 2 introduces the acquisition and preprocessing of the back image, including transformation of the original image into a gray image, and segmentation of region of interest (ROI) in the back. Section 3 describes the extraction of back feature points, including the feature points of back contour and those of spine midline. Section 4 illustrates the scoliosis detection algorithm based on ROI feature extraction. Section 5 presents the experimental results of the proposed algorithm, and analyzes the results.
2.1 Image acquisition
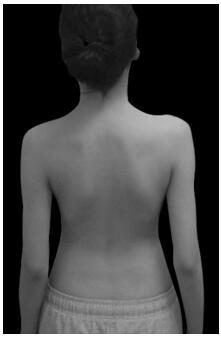
Figure 1. Example on image shooting
To ensure the accuracy of detection and processing results, the first step is to collect a complete and clear back image with good contrast, using a high-resolution digital camera. In addition, a fill light was needed at the site to provide sufficient, uniform and strong light. The contrast was increased by using a piece of black background cloth. During image acquisition, the patient was asked to stand still on the ground or on rest his/her feet on a stop marker, with his/her back to the camera. The doctor should try not to correct or fix the patient's posture as much as possible. For example, the doctor should avoid issuing instructions like straightening the legs, raising the head, or relaxing. In this way, the patient maintained a still standing state in a normal relaxed posture. It is very important that the patient's posture is natural during the measurement. The results could only be evaluated easily, when the measurements reflect the normal posture. In addition, the patient must pay attention to the following issues:
(1) Remain in the standing position with a bare back, and trousers pulled below the waist.
(2) Tie the hair in an appropriate way to expose the neck under the hairline.
(3) Pick up rings, watches, and necklaces to prevent them from reflecting the gratings, and eliminate any artificial curvature change. Figure 1 provides an example on image shooting.
2.2 Transformation of color image into gray image
In the previous step, the digital camera collected a color image, where any pixel has R, G and B components. The amount of data is huge. To facilitate subsequent image processing and reduce the computing load, the color image should be turned into a gray image, i.e., the R, G and B components should be converted into one channel [15]. The most popular way of gray image transform is the weighted average method:
I(x,y) = 0.3 * I_R(x,y) +0.59 * I_G(x,y)+ 0.11 * I_B(x,y) (1)
where, I_R(x, y), I_G(x, y), and I_B(x, y) are the image information of the red, green, and blue channels, respectively; I(x,y) is the calculated gray image information; 0.3, 0.59, and 0.11 are weighting coefficients configured according to the brightness perception system of humans, and popular standardization parameters in gray transform algorithms. According to the principle of television and the theory of modern television systems, the three primary color signals follow the relationship of Y=0.3R+0.59G+0.11B, in order to transform them into luminance Y by a certain ratio.
2.3 ROI segmentation
2.3.1 Back contour segmentation
In the gray image, if the histogram has two peaks and an obvious valley, then the gray value at the valley can be taken as the threshold T. Using this threshold, the target can be separated from the image [16]. The gray image f(x,y) has a grayscale range of [0, L]. The gray threshold T is selected between 0 and L. Then, the image segmentation method can be described by:
$g(x, y)=\left\{\begin{array}{l}255, f(x, y) \geq T \\ 0, f(x, y)<T\end{array}\right.$ (2)
The image g(x,y) thus obtained is binary. The binary image acquired through thresholding has some defects. There may be some noise in the edges, and there are some small gaps or holes in the back area of the image. To solve these problems, it is necessary to adopt mathematical morphological operations, such as dilation and erosion.
The basic idea of mathematical morphology is to measure and extract the corresponding shape in the image with structural elements of a certain shape, laying the basis for image analysis and recognition. Its application can simplify image data, keep their basic shape features, and remove irrelevant structures [17]. The expansion of grayscale image adopts the positive values of structural elements, and outputs an image brighter than the input. In this way, the dark details in the image can be reduced or eliminated. The corrosion of grayscale image adopts the positive values of structural elements, and outputs an image darker than the input. If the area of bright details in the input image is smaller than that of structuring elements, the brightening effect will be attenuated. The opening of grayscale image erodes the image before dilating it. It can remove relatively small bright details, without changing the overall gray level and large bright areas. By contrast, closing dilates the image before eroding it, and thus removes small dark details, while preserving the bright parts.
This paper adopts the structuring element b to perform grayscale corrosion on the input image f fΘb:
$(f \Theta b)(s, t)=\min \left\{\begin{array}{l}f(s+x, t+y)-b(x, y)(s+x), \\ (t+y) \in D_{f},(x, y) \in D_{b}\end{array}\right\}$ (3)
where, $D_{f}$ and $D_{b}$ are the domain of definition of f and b, respectively.
Grayscale dilation can be defined as:
$(f \oplus b)(s, t)=\min \left\{\begin{array}{l}f(s-x, t-y)+ \\ b(x, y)(s-x),(t-y) \in D_{f},(x, y) \in D_{b}\end{array}\right\}$ (4)
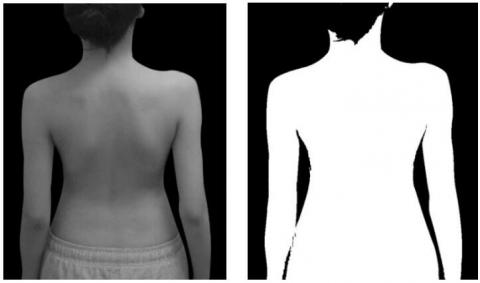
Firstly, the morphological erosion is performed to remove irrelevant parts in the image. The size of the structural element is 30*30 pixels. Since erosion will reduce the image size, the same structural element is used again for expansion after erosion, which basically restores the image size. Meanwhile, the small holes in the back area are completely filled, the noise points in the background area are deleted, the small protruding burrs are removed, the back contour is smoothed, and a complete and smooth back target image is extracted without holes. The processing effect is shown in Figure 2.
Figure 2. Effect of back thresholding
2.3.2 Spine ROI segmentation
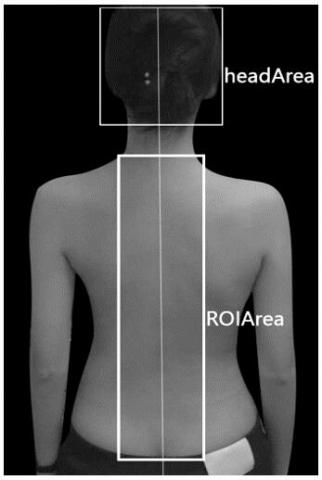
According to the structural law of the human body [18], the head was used as a measurement unit (a) to mark the proportional relationship between the whole body and the head. For example, the body height is about 7a, the upper body is about 2.5a, the lower body is about 3.5a, and the shoulder width is about 2a; there is a certain relationship between the contour area of back spine and the position and size of the head. Hence, it is possible to define the spine contour area of the patient according to his/her head area, before segmenting the image. Medically, it is believed that the distance between the medial border of the scapula and the spine is about 6-7cm. In the thresholded binary image obtained in the previous step, the connected domain algorithm [19] was adopted to divide the obtained connected domain into the box of the patient's head (headArea) and mark the area (Figure 3). The back midline was calculated by adding up the left and right coordinates of the head and dividing the sum by two. Then, the back spine area was obtained by extending the back midline 3.5 cm to the left and right sides. The specific algorithm is as follows:
Step 1. Solve the horizontal coordinates of the back midline by (headArea.left + headArea.right)/2.
Step 2. Move vertical center coordinates at the bottom of headArea down vertically by headArea.height*1/5, and take the new coordinates as the center coordinates of the upper edge of the spine contour ROI area (ROIArea).
Step 3. Determine the width of ROIArea as headArea.width*0.68, and the height as headArea.height* 2.5.
Figure 3. Segmentation effect of back spine region
3.1 Extraction of feature points of back contour
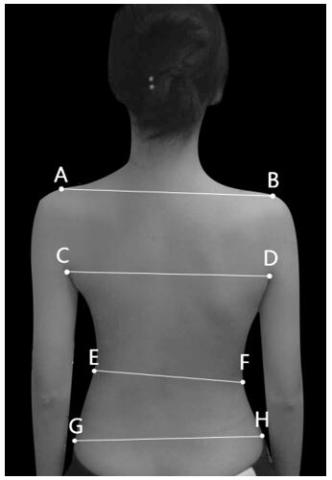
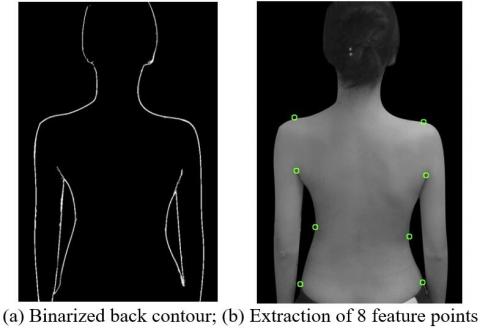
Scoliosis can cause asymmetry in external posture. When the patient is standing, the asymmetry is manifested as unequal shoulder height, unequal armpit height, lumbar fossa tilt, and pelvic tilt. When the patient bends over, the asymmetry is mainly reflected by back asymmetry [20]. After obtaining the binary contour map, it is necessary to extract the eight feature points of the shoulders, armpits, waist, and hip (Figure 4). The asymmetry of these features needs to be analyzed to preliminarily evaluate the degree of scoliosis.
Figure 4. Eight feature points of back contour
Figure 5. Extraction of back contour feature points
This paper uses the depth-first search algorithm [21] to extract feature points. The depth-first image traversal firstly finds the initial node A, and then performs depth-first traversal of the image starting from an adjacent node of A, which is not visited yet. If a node has not been visited, a new round of depth-first traversal will start from that node. The above process is repeated until all nodes connected to A have been visited once. Stacking and recursion are two ways to implement the depth-first algorithm. After comparing the running time, this paper chooses the time-efficient recursion algorithm. The depth-first search algorithm can remove the influence of some noise points, and obtain a connected binary contour map (Figure 5(a)). The 8 feature points are extracted in the following manner:
(1) Left (right) armpit point
Find the center point of the circumscribed box of the binarized back contour of the human body. Then, search from the center point to the left (right), and start traversal from the first point whose pixel value is nonzero. The traversal condition is that at least one point of the five coordinate points directly above the point is nonzero, i.e., a white pixel. If the traversal condition does not hold, the current point is the armpit point. Otherwise, find the white pixel close to the left (white) among the four coordinate points, and continue to traverse upward from this pixel point as the reference point.
(2) Shoulder points
Traverse up from the left and right armpit points separately to determine whether the pixel value is 0. If yes, the point is considered as a shoulder point. Otherwise, continue to search upward until finding a zero point.
(3) Waist point and hip point:
There is a key difference between the extraction of waist/hip point and that of armpit points: the inflection point transform of waist/hip point is not as obvious as that of armpit points. Hence, the extraction algorithm cannot use simple contour traversal search. In this paper, the eight feature points are extracted by an algorithm designed based on the curvature changes of waist contour (Figure 5(b)).
3.2 Feature point extraction of spine midline
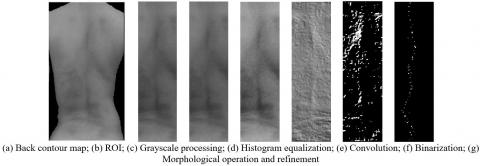
There is a key step in the extraction and trend fitting of spine midline based on feature points: the curve fitting of image contour requires the identification of the feature points that reflect the shape information of the image and reliably match the image. After the previous spine contour ROI segmentation, the feature points of the spine midline were extracted in the following steps to facilitate the fitting of spine midline: (1) grayscale normalization of ROI; (2) enhancing the image through histogram equalization to increase image contrast and highlight image details; (3) extracting features by sharpening convolution kernels; (4) binarizing image thresholding algorithm; (5) denoising and image refinement through the mathematical morphological operations of opening and closing, producing the feature map. The processing flow and effect are shown in Figure 6.
Figure 6. Feature point extraction of spine midline
4.1 Evaluation of degree of scoliosis based on posture asymmetry
According to the eight feature points in Figure 4, the degree of asymmetry of posture characteristics was calculated, namely, shoulder tilt, armpit tilt, lumbar tilt, and pelvis tilt.
(1) Shoulder tilt
shoulderAngle $=\arctan \frac{B . y-A . y}{B . x-A . x}$ (5)
where, shoulderAngle is shoulder tilt; A and B are two points of left and right shoulders, respectively.
(2) Armpit tilt
armpitAngle $=\arctan \frac{D . y-C . y}{D . x-C . x}$ (6)
where, armpitAngle is armpit tilt; C and D are two points of left and right armpits, respectively.
(3) Lumbar tilt
lumbarAngle $=\arctan \frac{F . y-E . y}{F . x-E . x}$ (7)
where, lumbarAngle is lumbar tilt; E and F are two points of left and right lumbar, respectively.
(4) Pelvis tilt
pelvisAngle $=\arctan \frac{H . y-G . y}{H . x-G . x}$ (8)
where, pelvisAngle is pelvis tilt; G and H are the two points of left and right hips, respectively.
4.2 Cobb angle measurement based on spine midline
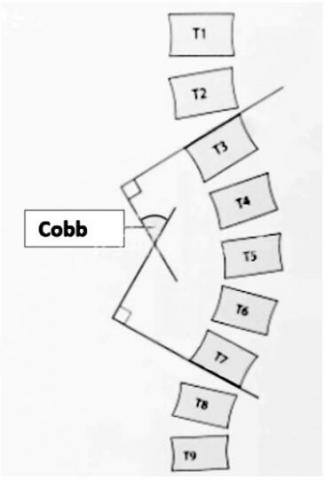
The Cobb angle is the most popular measure to evaluate and quantify the degree of scoliosis [22]. When the patient stands on an X-ray image, the Cobb angle vertebra refers to the vertebral bodies with the cephalic and caudal inclinations of scoliosis. As shown in Figure 7, T3 is the upper vertebra, and T7 is the lower vertebra. After drawing straight lines along the upper end plate of the upper vertebra and the lower end plate of the lower vertebra, the included angle of the two lines or the intersection angle of their vertical lines is the Cobb angle.
Figure 7. Definition of Cobb angle
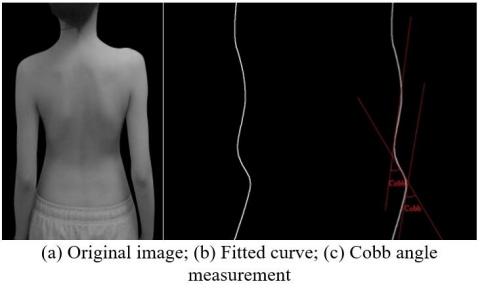
After the feature points of spine midline are extracted in 3.2, it is necessary to simulate the spine midline through curve fitting. The selection of feature points and the construction of appropriate control points are the keys to obtain high-precision fitting contours. Suppose n feature points are obtained after feature point detection, which are denoted as $P_{i}\left(x_{i}, y_{i}\right)$, with i=1,…,n. The next task is to complete the cubic Bézier curve fitting of the image contour [23]. In other words, any two adjacent feature points $P_{i}$ and $P_{i+1}$ need to be connected with a cubic Bézier curve segment sequentially. Finally, feature points $P_{1}$ and $P_{n}$ should also be connected with a cubic Bézier curve segment. Hence, the image contour can be fully represented by a closed cubic Bézier curve.
The control points are constructed as follows: To complete the least squares fitting of the image contour, it is a must to identify a set of discrete points between any two adjacent feature points on the contour curve of the original digital image. Next, the least squares method is used [24] to approximate the discrete points between any two adjacent corner points, using a cubic Bézier curve segment. In this way, a piecewise cubic Bézier curve representation can be obtained for the image contour. Then, the spine midline contour is fully fitted. After that, the contour curve is derived to calculate the slope of the curve, and then the slope is derived to obtain the maximum point of the slope and the tangent slopes $v_{1}$ and $v_{2}$. Then, the two extreme points of the slope are regarded as the upper and lower vertebrae, and the Cobb angle is solved by formula (9). Figure 8 shows the curve fitting effect and Cobb angle. If multiple measurements appear in the calculation of Cobb angle (Figure 8(c)), the most severe degree of scoliosis would be represented by the largest measurement:
$\alpha_{c o b b}=\frac{\arctan \left(\left(v_{1}-v_{2}\right) /\left(1+v_{1} \times v_{2}\right)\right) \times 360}{2 \pi}$ (9)
Figure 8. Cobb angle measurement based on spine midline
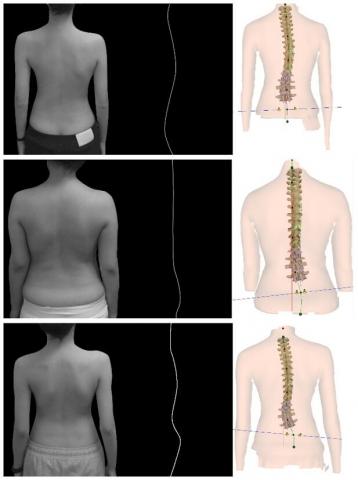
To verify its reliability and accuracy, our algorithm was compared with the detection results of DIERS formetric III 4D, a professional software for back shape analysis. The software device measures and records back images by the imaging-raster-stereoscopic method, and generate an accurate three-dimensional model of the back [25]. Compared with the traditional X-ray detection of scoliosis, DIERS formetric III 4D has several advantages: no radiation, automatic measurement, independence of doctor experience, and ability to capture deformity of all angles of the spine (spinal rotation). The weakness is the high cost. The high economic cost makes the software unsuitable for largescale screening.
The data of 100 cases (excluding obese patients) were collected during the experiment. After the diagnosis and measurement of professional doctors, 27 cases were determined as negative (Cobb angle less than 10 degrees), 45 cases as mildly positive (Cobb angle greater than 10 degrees and less than 30 degrees), and 28 cases as severely positive (Cobb angle greater than 30 degrees).
Based on the measurement points of body asymmetry (the eight feature points in Figure 4), specific marker points were identified in DIERS formetric III 4D, which can be verified by curvature charts or information display means. At the same time, the system also calculated the specific tilts. For example, the system's No. 0206 parameter Pelvic tilt DL-DR° represents the pelvis tilt. The angle obtained in Algorithm 4.1 in this paper was compared with the parameters given in the DIERS formetric III 4D. Table 1 presents the experimental results. The results show that more than 90% of the results were accurate, when the tolerance of 0-3 degrees, under four different pose asymmetry angles.
The above asymmetry angles cannot accurately reflect the degree of scoliosis. However, these data provide a reference for doctors to diagnose and treat physical feature variation. To evaluate scoliosis accurately, it is necessary to compare the accuracy of Cobb angle measurement. Figure 9 shows the spine midline of back image processing by our algorithm, and the three-dimensional reconstruction effect of DIERS formetric III 4D. The results of the two methods are highly similar.
To further validate the experimental results, the Cobb angles of scoliosis obtained by our algorithm were compared with those measured after three-dimensional reconstruction. The results are shown in Table 2. Among the 100 cases, when the measured Cobb angle was smaller than or equal to 30 degrees, the measured results of our algorithm were close to those of three-dimensional reconstruction. The error was very small, and the mean error approximated the minimum error. The reason is that most errors of the negative group fell between 0 and 3 degrees, and those of slight scoliosis belonged to the range of 0-5 degrees. When the measured Cobb angle was larger than 30 degrees, the error between the results measured by our algorithm and those of three-dimensional reconstruction was relatively large. The reason is that severely positive patients may have obvious shadows on one side of the scapula due to the large degree of spinal distortion on the back, and the skin folds on both sides of the waist or pelvis result in grayscale changes that are not related to the spine in the ROI. These grayscale changes will be mistaken by the algorithm as feature points.
Table 1. Experimental results
|
Error Asymmetry angle |
Tolerance (error range) |
Quantity |
Proportion |
|
Shoulder tilt |
0-3 degrees |
94 |
94% |
|
4-6 degrees |
6 |
6% |
|
|
7-10 degrees |
0 |
0% |
|
|
>10 degrees |
0 |
0% |
|
|
Armpit tilt |
0-3 degrees |
93 |
93% |
|
4-6 degrees |
6 |
6% |
|
|
7-10 degrees |
1 |
1% |
|
|
>10 degrees |
0 |
0% |
|
|
Lumbar tilt |
0-3 degrees |
90 |
90% |
|
4-6 degrees |
8 |
8% |
|
|
7-10 degrees |
1 |
1% |
|
|
>10 degrees |
1 |
1% |
|
|
Pelvis tilt |
0-3 degrees |
91 |
91% |
|
4-6 degrees |
4 |
4% |
|
|
7-10 degrees |
3 |
3% |
|
|
>10 degrees |
2 |
2% |
Figure 9. Experimental results
Table 2. Cobb angle comparison
|
Group |
Maximum error (degree) |
Minimum error (degree) |
Mean error (degree) |
|
Negative group (Cobb angle ≤10°) |
5 |
1 |
2.7 |
|
Slight scoliosis (10°<Cobb angle≤30°) |
7 |
3 |
4.4 |
|
Severe scoliosis (Cobb angle>30°) |
16 |
2 |
8.9 |
According to the data in Table 2, the maximum error, minimum error, and mean error were within reasonable ranges, for the research mainly aims for largescale scoliosis screening. The results meet the requirements of scoliosis screening. Despite the obvious error when the Cobb angle measurement was greater than 30°, the error does not affect the judgment of the obvious positive state. The result proves that our scoliosis detection scheme is effective and feasible.
Considering the lack of fast and effective scoliosis screening methods, this paper designs a scoliosis detection method based on ROI feature extraction. First, a back image localization and feature extraction algorithm was proposed according to the features and detection requirements of the back image. The algorithm was utilized successfully to extract the spine image from the back image. Next, two spine contour feature point extraction algorithms were developed. One of them was based on the outer contour of back spine, and the other grounded on gray feature difference. Finally, two scoliosis assessment methods were developed: one is based on the asymmetry of body features, and the other calculates the Cobb angle according to the fitted spine contour curve. Compared with manual detection and X-ray detection methods adopted by hospitals, our approach is fast, convenient, and radiation-free. Experimental results show that our algorithm can provide basic posture asymmetry angles, and measure the Cobb angle of scoliosis. It is a feasible way to diagnose scoliosis.
Of course, our algorithm has certain defects. For example, the spine ROI segmentation algorithm in 2.3.2 segments the region according to the body proportions of most people. Some images may be overlooked, and the regions may be extracted improperly, causing the lack of feature points for the spine. In addition, the obese patients were excluded from the subjects, for obesity will lead to inconspicuous back features. These patients may not be suitable for screening with our algorithm. These problems will be solved in future research.
[1] Hell, A.K., Tsaknakis, K., Lippross, S., Lorenz, H.M. (2020). Skoliose IM kindes-und jugendalter. Monatsschrift Kinderheilkunde, 168(10): 917-929. https://doi.org/10.1007/s00112-020-00977-x
[2] Grycuk, S., Mrozek, P. (2021). Numerical analysis of scoliosis brace. In The International Conference of the Polish Society of Biomechanics, pp. 44-54. https://doi.org/10.1007/978-3-030-86297-8_5
[3] Oetgen, M.E., Heyer, J.H., Kelly, S.M. (2021). Scoliosis screening. JAAOS-Journal of the American Academy of Orthopaedic Surgeons, 29(9): 370-379. https://doi.org/10.5435/JAAOS-D-20-00356
[4] Yang, J., Zhang, K., Fan, H., Huang, Z., Xiang, Y., Yang, J., Lin, H. (2019). Development and validation of deep learning algorithms for scoliosis screening using back images. Communications Biology, 2(1): 1-8. https://doi.org/10.1038/s42003-019-0635-8
[5] Motyer, G.S., Kiely, P.J., Fitzgerald, A. (2022). Adolescents’ experiences of idiopathic scoliosis in the presurgical period: A qualitative study. Journal of Pediatric Psychology, 47(2): 225-235. https://doi.org/10.1093/jpepsy/jsab095
[6] Vergari, C., Skalli, W., Gajny, L. (2020). A convolutional neural network to detect scoliosis treatment in radiographs. International Journal of Computer Assisted Radiology and Surgery, 15(6): 1069-1074. https://doi.org/10.1007/s11548-020-02173-4
[7] D'Osualdo, F., Schierano, S., Battistuzzi, E., Specogna, S. (2016). The decisional pathway of scoliosis. Medico e Bambino, 35(2): 103-110.
[8] Ramirez, L., Durdle, N.G., Raso, V.J., Hill, D.L. (2006). A support vector machines classifier to assess the severity of idiopathic scoliosis from surface topography. IEEE Transactions on Information Technology in Biomedicine, 10(1): 84-91. https://doi.org/10.1109/titb.2005.855526
[9] Kim, H.S., Ishikawa, S., Ohtsuka, Y., Shimizu, H., Shinomiya, T., Viergever, M.A. (2001). Automatic scoliosis detection based on local centroids evaluation on moire topographic images of human backs. IEEE Transactions on Medical Imaging, 20(12): 1314-1320. https://doi.org/10.1109/42.974926
[10] Kim, H., Ishikawa, S., Khalid, M., Otsuka, Y., Shimizu, H., Nakada, Y., Viergever, M. A. (2003). Automatic spinal deformity detection based on neural network. In International Conference on Medical Image Computing and Computer-Assisted Intervention, pp. 802-809. https://doi.org/10.1007/978-3-540-39899-8_98
[11] Kim, H., Ushijima, H., Tan, J. K., Ishikawa, S., Otsuka, Y., Shimizu, H., Shinomiya, T. (2007). Spinal deformity detection from moiré topographic image based on evaluating asymmetric degree. In World Congress on Medical Physics and Biomedical Engineering 2006, pp. 2308-2311. https://doi.org/10.1007/978-3-540-36841-0_582
[12] Berryman, F., Pynsent, P., Fairbank, J., Disney, S. (2008). A new system for measuring three-dimensional back shape in scoliosis. European Spine Journal, 17(5): 663-672. https://doi.org/10.1007/s00586-007-0581-x
[13] Lambert, A., Cole, A., Breakwell, L., Michael, A.R. (2016). The role of the DIERS 4D formetric system in objectively quantifying the deformity seen in adolescent idiopathic scoliosis (AIS). The Spine Journal, 16(4): S97-S98. https://doi.org/10.1016/j.spinee.2015.12.037
[14] Degenhardt, B.F., Starks, Z., Bhatia, S. (2020). Reliability of the DIERS Formetric 4D spine shape parameters in adults without postural deformities. BioMed Research International, 2020: 1796247. https://doi.org/10.1155/2020/1796247
[15] Prasetyo, H., Hsia, C.H. (2019). Lossless progressive secret sharing for grayscale and color images. Multimedia Tools and Applications, 78(17): 24837-24862. https://doi.org/10.1007/s11042-019-7710-5
[16] Tiwari, A., Bhattacharjee, K., Pant, M., Nowakova, J., Snasel, V. (2021). Evolutionary multi-level thresholding for breast thermogram segmentation. In International Conference on Intelligent Networking and Collaborative Systems, pp. 253-263. https://doi.org/10.1007/978-3-030-84910-8_27
[17] Bloch, I., Blusseau, S., Pino Pérez, R., Puybareau, É., Tochon, G. (2021). On some associations between mathematical morphology and artificial intelligence. In International Conference on Discrete Geometry and Mathematical Morphology, pp. 457-469. https://doi.org/10.1007/978-3-030-76657-3_33
[18] Liang, H., Xie, W., Wei, P., Zhou, Y., Zhang, Z. (2022). Identification of human body dynamics from a human-structure system: An experimental study. Experimental Techniques, 1-22. https://doi.org/10.1007/s40799-022-00548-7
[19] Zhang, Z., Hua, Z., Tang, Y., Zhang, Y., Lu, W., Dai, C. (2021). Recognition method of digital meter readings in substation based on connected domain analysis algorithm. In Actuators, 10(8): 170. https://doi.org/10.3390/act10080170
[20] Abdel-Aziem, A.A., Abdelraouf, O.R., Ghally, S.A., Dahlawi, H.A., Radwan, R.E. (2021). A 10-week program of combined hippotherapy and scroth’s exercises improves balance and postural asymmetries in adolescence idiopathic scoliosis: A randomized controlled study. Children, 9(1): 23. https://doi.org/10.3390/children9010023
[21] Lim, T.H., Ng, P.L. (2020). Evaluating recursive backtracking depth-first search algorithm in unknown search space for self-learning path finding robot. In International Conference on Artificial Intelligence for Communications and Networks, pp. 531-543. https://doi.org/10.1007/978-3-030-69066-3_47
[22] Zhang, K., Xu, N., Guo, C., Wu, J. (2022). MPF-net: An effective framework for automated cobb angle estimation. Medical Image Analysis, 75: 102277. https://doi.org/10.1016/j.media.2021.102277
[23] Tu, Y., Yao, Z., Xu, J., Liu, Y., Zhang, Z. (2020). Fingerprint restoration using cubic Bezier curve. BMC Bioinformatics, 21(21): 1-19. https://doi.org/10.1186/s12859-020-03857-z
[24] Levenberg, K. (1944). A method for the solution of certain non-linear problems in least squares. Quarterly of Applied Mathematics, 2(2): 164-168. https://doi.org/10.1090/qam/10666
[25] Kumar, V., Cole, A., Breakwell, L., Michael, A.L.R. (2016). Comparison of the diers formetric 4d scanner and plain radiographs in terms of accuracy in idiopathic scoliosis patients. Global Spine Journal, 6(1_suppl): s-0036. https://doi.org/10.1055/s-0036-1583055