Sagar Sahebrao Tikar* | Rajendrakumar A. Patil
© 2022 IIETA. This article is published by IIETA and is licensed under the CC BY 4.0 license (http://creativecommons.org/licenses/by/4.0/).
OPEN ACCESS
Road accidents caused by a driver's irresponsibility while driving is becoming increasingly common. Furthermore, if lanes are lacking on the road, even well-trained drivers may find it difficult to keep the lane while driving in low-light conditions. As a result, it is critical to design trustworthy, precise, and efficient mechanisms in the vehicle system that aid the driver in the event of a road collision. Almost every country in the world is attempting to conquer this greatest difficulty. The topic study article focuses on the crossroads and presents a more authentic and efficient diver aid system strategy in terms of lane departure alarm even when lanes are missing by taking prior lane patterns into account. In addition, research is being conducted in order to provide a speedy collision warning with nearly no false alarms. This study develops a fast-response spatial domain approach for detecting lanes on highways, and if lane markers are missing, virtual lanes are constructed using a novel suggested algorithm. In addition, for vehicle collision avoidance, the system estimates the distance, velocity, and direction from the frontal vehicle to itself. The suggested approach is evaluated on real-time videos in all environmental circumstances such as poor or bright sunlight, rain, and twilight, as well as on different road geometries such as straight and curving at various vehicle speeds. In every situation, the system has achieved more than 98.7 percent accuracy. Even if there are no markings on road, the system provides more accurate and reliable experimental results. Finally, the results are compared to several existing algorithms based on accuracy, precision, recall, and F1 score, along with processing time.
driver assistance system, lane detection, collision avoidance, real time application
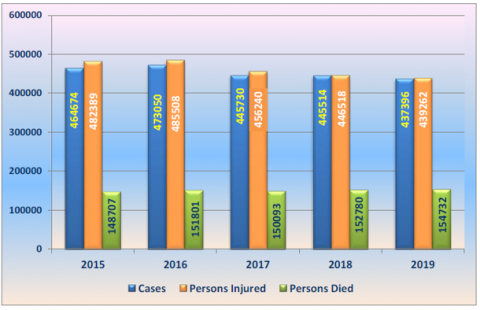
With the advancement in the technology day by day, automobile is becoming more and more tech savvy, connected, autonomous and comfortable which is very much concerned by the users. However, the increasing number of automobiles on road causes altogether new problem statements and challenges to the industry and society as well. Number of road accidents is also increasing rapidly in each country. As per NCRB (National Crime Records Bureau, India) in year 2018 in India, 467000 fatalities are occurred in road accidents and most of them are due to negligence of the driver while driving. A very common cause of these accidents is running the vehicle off the lane during overtaking or in normal conditions. Figure 1 shows the details of road accidents and related injuries and fatalities as per NCRB.
Even a very slight change in lane direction can cause a serious mishap at high speed. To improve such situations, an advance technique of Lane Departure Warning System (LDWS) is introduced as a driver assistance system [1-5]. In many countries this technique or system has become a mandatory feature of the vehicle to achieve the road safety. Vision based system are emerged as a powerful supporting system to achieve the vehicle safety in past few years. This can be used in adverse environment as well which is more advantageous. The identification of the lane markings on the road images in all type of light conditions (too bright / too poor) in urban as well as in rural areas is really a tough challenge for vision-based systems. In addition to these challenges the system needs to take care of the vehicle speed and the weather conditions like rainy / snowy environment. Moreover, it is imperative that the system shall identify the lane markings and give the ‘true’ warning to the driver if the vehicle is ‘out’ of intended lane with minimal computation and the highest accuracy.
Figure 1. Year wise accidental death on road {source: National crime records bureau}
Lane identification techniques are designed by many researchers. Lee and Yi [4] proposed based on the LBPE, the Hough Transform, and linear regression which is based on eight parameters to conclude the lane departure. Lee designed a lane departure identification method that recognizes the lane orientation using an edge distribution function (EDF) and identifies the changes in the vehicle direction. The main limitation of his technique is when vehicle is in front of the camera; many unwanted data is seen in the output results. Moreover, the angle-based technique is highly susceptible to small change in the lane departure. Hence, this technique gives more false warnings or alarms.
Wu et al. [6] found the lane marking based on Fuzzy approach where as Huang et al. [7] uses the DSP processor for lane detection and warning. ISO 17361:2007 Standard [8] defines the performance requirements and test procedures which need to be followed. Different techniques were used by Nieto et al. [9] based on recursive segmentation and Zhou [10] based on Gabor filter which yields in more computation time and response. The drawback of this technique is the change in the mounting position of the camera on the vehicle which affects the final output drastically. Wang and Xu [11] had developed the algorithm of camera calibration which has limitations of Dynamic Calibration of the camera. Wang et al. [12] used a fuzzy logic for the lane detection departure warnings. A self-clustering algorithm, the fuzzy C-mean, and fuzzy rules were used to process the spatial information and the Canny algorithm is used to achieve the edge detection. The technique used in this method uses the live data of the lane boundaries and the angle of the vehicle to create the lane departure warning signal to driver. Again, this shows the limitations towards the accuracy of the system and increase in false alarming in end results. Some researches [13-18] were done based on Stereo based camera for lane detection, which increase the cost and latency for the output. Moreover, the complexity of the algorithm increased due to the Fuzzy logic and the proceeding time increased [19]. Wu [20] addressed the vanishing point detection in Foggy environment. Saleh et al. [21] developed a design which uses the steering control and the interactive automation to the vehicle driving conditions in the absence of the driver response to the hazardous or unwanted situation. Challenges in Snowy and Foggy environment were addressed in the videos captured in the studies [22-24]. Wu et al. [25] devised a warning system which is based on the vanishing point of the lanes and in the view of absence of such information, the algorithm gives the incorrect results resulting into false alarm. Hence the accuracy of the detection of the situation falls upto 73.21%. Mu and Ma [26] proposed lane detection which depends on segmentation and segment wise fitting; the study has the problem of false lane detection, and it requires a poor environment for image pre-processing.
In this paper a novel technique of Lane identification is elaborated which is based on the vision systems like camera mounted on the vehicle. This paper proposes a lane departure technique using the masking the road images for necessary data, region of interest segmentation, and dynamic distance between the vehicle and the lane markings. This approach is better than other states of the art due to its high lane detection rate with reduced false warnings. In addition, the proposed system's results were compared to those of an existing system, and a comparison graph was drawn in the result session. According to the study [27], the suggested system is evaluated on both CPU and GPU to determine the time complexity. Finally, in the concluding session, conclusions concerning the actions accomplished in the paper are provided. Bangare et al. [28-31] shown excellent study of machine learning approaches in their publication. Gulati et al. [32] and Joseph et al. [33] conducted research using machine learning and deep learning approaches. Bangare [34, 35] uses Fuzzy and neural network with image processing to detect the dynamic regions in the images. Awate et al. [36] discussed CNN research for Alzheimer's disease. Bangare [37] uses the dynamic architecture based deep learning approach to detect the features from images. Mall et al. [38] shown the use of Machine learning for disease detection etc. Pande et al. [39] presented a detailed assessment of the latest CNN architecture called Capsule Networks (CapsNets). Pande et al. [40-42] employed Capsule Network and CNN on optimal feature vector for several tasks including leaf retrieval and handwritten character recognition.
Here, we are proposing the method which is more accurate, time efficient and works in all environmental condition such as in poor illumination condition as well as in too bright condition. Moreover, this system works in case of missing lane markings on the road as well. The different steps involved in detecting the lane, the lane departure warning alert, frontal vehicle detection and its collision warning alert, as well, are shown in the system architecture diagram shown in Figure 2. The algorithm comprises of the few broad steps which included the image enhancement of the captured image, lane detection and lane departure warning alert. The image enhancement is basic step which is most vital and the complexity, processing time and the accuracy of the algorithm depends on it. System takes video input from camera. The captured video is divided into frames and every 3rd frame is fed to the system. Time taken by proposed system is as small as the time require to acquire two frames from the camera. After the ROI extraction, the image is passed through the proposed spatial domain model. Lane extraction is done and if there is no lane marking on the road proposed algorithm draws the imaginary lane and make decisions. In this paper, comparative study of proposed algorithm with various algorithms is given.
Figure 2. System flow diagram of the proposed architecture
Real time video or saved video V of the road map is given as an input to the system. Not all the part in the image needed for the operation. Masking M is the concept which is used to eliminate unwanted part from the image to process. After masking we get the region of interest IROI on which our algorithm should work.
V={i1,i2,i3,…,in} … (1)
M={Mask of road excluding sky and corners} … (2)
IROI =V[K]∩M … (3)
IROI is that part of image on which further image processing algorithms performed. First of all the driving conditions such as weather, brightness and contrast has been considered as Process noise PNi.
For the image enhancement, the spatial domain filter is used to estimate the internal state of a process. It gives only a sequence of noisy observations. We have modelled the process in accordance with the Eq. (4).
Ei = STi Ei-1 + CIMi CVi + PNi (4)
The intensity of the present frame and the previous frame should get matched. The present enhanced frame extracted from camera Ei is estimates by using state transition model which is applied on previous frame. State transition model applied on the previous frame is the inverse of average intensity matrix of the present frame. Then controlled input model CIMi is applied to the control vector CVi. The Process noise PNi is drawn from the zero mean multivariant normal distribution from control vector CVi to estimate the current enhanced frame.
At any time i, control vector CVi is given as,
CVi = OMi + PNi-1 (5)
Here in Eq. (5), The Histogram of the image is calculated using frequency of number of pixel intensity values. Then the maximum entropy value of the histogram graph is calculated to find observation model OMi which gives dynamic threshold value. Pseudo code for the enhancement of the image with proposed spatial filter is written below. The time complexity of this filter is such that it takes one tenth of second to get enhanced image result.
Proposed pseudo code for the enhancement of ROI extracted image.
Divide image IROI into a rectangular grid rij(i= 1, 2, ... , N; j = 1,2, ... , M)
for each rectangle rij
do
Dij ← distribution of ratios IROI (p)/xt-1 (p) for all
pixel p € rij such that:
(xt-1 (p) ≠ 0) ^ (xt-1 (p) < L) ^ (I(p) < L) {deal with saturated pixel}
kt(ij) ← median of Dij
end for
K ← median of kt(ij) over all rectangles rij
for each rectangle rij
do
kt(ij) ← unknown if (kt(ij) / K >Kthr) V (kt(ij) / K < 1 / Kthr)
end for
for each rectangle rij such that kt(ij) = unknown
do
kt(ij) ← average of K and kt(uv), with ruv adjacent to rij and kt(uv) ≠ unknown
end for
for all pixels p
do
let r1, r2, r3, r4 be the 4 rectangles closest to p
let w1, w2, w3, w4 be the distance from p to the rectangles centers
kt(p) ←{ $\sum_{h=1}^{4} \mathrm{kt}(\mathrm{h}) \mathrm{wh}$} / $\sum_{h=1}^{4} \mathrm{wh}$
end for
The output of the enhanced image is then fed directly to the lane detection algorithm. If in case lane is not detected then algorithm for drawing virtual lane will get activated. µ is the factor which takes nature of the extracted lane from present and past frames. If lane is present in next frame then the equation of lane in next frame becomes equation of lane in present frame and equation of lane in present frame becomes equation of lane in past frame. But if lane is absent in next frame then by using extrapolation factor µ, equation of lane is predicted.
µ=(φ(M) – φ(E))/(φ ́(E))
where,
φ(M) is the equation of lane detected in present frame;
φ(E) is the equation of lane detected in past frame;
φ ́(E) is the derivative of equation of lane detected in past frame. µ ranges from (-) 1 to (+) 1.
(-) µ - For Left lane prediction
(+) µ - For right lane prediction
In Geometry: µ varies from (-) 90° to (+) 90°
For the lane marking detection equations from 2.6 to 2.10 is used.
$I_{R O I} \in\left\{R_{m}, B_{m}, G_{m}\right\}$ (6)
$R_{m}=\hat{R}$ (7)
$B_{m}=\widehat{B}$ (8)
$G_{m}=\widehat{G}$ (9)
$\mu=\max \left(R_{m}, B_{m}, G_{m}\right)-\min \left(R_{m}, B_{m}, G_{m}\right)$ (10)
Impact $=[0,2,4]$ (11)
$I(H)=\sum_{i=0}^{\text {length }(I)} \frac{P[i]-P[i+1]}{\mu}+\left.(\operatorname{impact}[i] 2)\right|_{P=\text { length }[I]-\text { comoress rate }+1 \cdots \cdot} \quad \quad \quad$ (12)
$R O I(s)=\frac{\mu}{\max \left(R_{m}, B_{m}, G_{m}\right)}, \mid R O I(s)=0 \equiv R O I(s)=\infty$ (13)
$R O I(V)=\max \left(R_{m}, B_{m}, G_{m}\right)$ (14)
$W t=\{$ Filter for white colour intensity $\}$ (15)
$Y t=\{$ Filter for yellow colour intensity $\}$ (16)
Let Wm be extracted white marking,
${{w}_{m}}\left[ i,j \right]=\sum\limits_{m=\frac{width\text{ }of\text{ }{{w}_{m}}}{2}}^{\frac{width\text{ }of\text{ }{{w}_{m}}}{2}}{\sum\limits_{n=\frac{heigth\text{ }of\text{ }{{w}_{m}}}{2}}^{\frac{heigth\text{ }of\text{ }{{w}_{m}}}{2}}{{}}}$
$w_{t}[m, n] . R O I_{(H S V)}[i-m, j-n]$ (17)
$w_{t}[m, n]$ and $Y[m, n]$ is the kernel for white mask and yellow mask respectively.
Convolution of these kernels with ROI extracted images gives coordinated of lane markings. If lane is missing the then proposed mathematical model is used to draw virtual marking of lane.
Suppose we have previously observed lane s and v is the missing lane. As s and v is the vector with same direction. Then by using vector addition rules we get x, which is combinations of the vectors drawn from the previous detected lanes. This is used to derive all possible combination vectors in a superset or database stored in the memory to be used to estimate the virtual lane in subsequent steps. Then by using vector addition rules we get,
$x=s+v$ (18)
To get all the possible values of the lanes within threshold limit let covariance matrix be $R_{v}$,
$R_{v}=E\left\{v v^{H}\right\}$ (19)
where, $v^{H}$ denotes the conjugate transpose of v. The y is the possible combinations of the vectors drawn from the previous detected lane.
$y=\sum_{K=-\infty}^{\infty}h^{*}[k] x[k]=h^{H} x=h^{H} s+h^{H} v=y_{s}+y_{v}$ (20)
By observing all the previous lane marking which is stored in memory the estimated virtual line is given as
$\mathbf{V}_{L 1}=\frac{\left|y_{s}\right| \dot{2}}{E\left\{\left|y_{v}\right| \dot{2}\right\}}$.
$\mathbf{V}_{\mathrm{L} 1}=\frac{\left|h{^{H}}s\right|^{2}}{E\left\{\left|h^{H} v\right|^{2}\right\}}$ (21)
$\mathrm{E}\left\{|\left. h^{H} v\right|^{2}=E\left\{\left(h^{H} v\right)^{H}\right\}=h^{H} E\left\{v v^{H}\right\} \mathrm{h}=h^{H} R_{V} h\right.$. (22)
The resultant values of the estemated virtual lane with is stated as,
$\mathrm{V}_{\mathrm{L}}=\frac{\left.\left(R_{v^{1 / 2} \quad h}\right)^{H}\left(R_{v} 1 / 2 \quad s\right)\right| \quad ^{\wedge} 2}{\left(R_{v} 1 / 2 \quad h\right)^{H}\left(R_{v} 1 / 2 \quad h\right)}$ (23)
$\mathbf{V}_{\mathrm{L}} \frac{\left|\left(R v^{1 / 2} \quad h\right)^{\wedge} H\left(R v^{1 / 2} \quad s\right)\right| \quad ^{\wedge} 2}{\left(R v^{1 / 2} \quad h\right)^{\wedge} H\left(R^{1 / 2} \quad h\right)} \leq \pi r^{2} \frac{\left[\left(R v^{1 / 2} \quad h\right)^{\wedge} H\left(R^{1 / 2} \quad h\right)\right]\left[\left(R^{-1 / 2} \quad s\right)^{\wedge} H\left(R^{-1 / 2} \quad s\right)\right]}{\left(R v^{1 / 2} \quad h\right)^{\wedge} H\left(R^{1 / 2} \quad h\right)}$ (24)
$\mathrm{V}_{\mathrm{L}}=\frac{\left|\left(\left(R v^{1 / 2} \quad h\right)^{2}\right)\left(R v^{1 / 2} \quad s\right)\right|^{2}}{\left(R v^{1 / 2} \quad h\right)^{\wedge} H\left(R v^{1 / 2} \quad h\right)} \leq s^{H} R v^{-1} \quad s \ldots$ (25)
$R^{1 / 2} \quad h=a R^{-1 / 2} \quad s$ (26)
$\mathrm{VL}=\frac{\left|\left(R_{v}^{\frac{1}{2}} \quad h\right)^{H}\left(R_{v}^{-\frac{1}{2}} \quad s\right)\right|^{2}}{\left(R_{v}^{\frac{1}{2}} \quad h\right)^{H}\left(R_{v}^{\frac{1}{2}} \quad h\right)}=\frac{\alpha^{2}\left|\left(R_{v}^{\frac{-1}{2}} \quad s\right)^{H}\left(R_{v}^{-\frac{1}{2}} \quad s\right)\right|^{2}}{\alpha^{2}\left(R_{v}^{\frac{-1}{2}} \quad s\right)^{H}\left(R_{v}^{\frac{-1}{2}} \quad s\right)}=\frac{\left|s^{H} R_{v}^{-1} \quad s\right|^{2}}{s^{H} R_{v}^{-1} s}=s^{H} R_{v}^{-1} s .$ (27)
Let α be arbitrary real number.
$\mathrm{h}=\mathrm{a} R v^{-1} \mathrm{~s}$ (28)
$\mathrm{E}=\left\{\left|y_{v}\right|^{2}\right\}=1$ (29)
$\mathrm{E}\left\{\left|y_{v}\right|^{2}\right\}=a^{2} s^{H} R_{v}^{-1} \mathrm{~s}=1$ (30)
$\alpha=\frac{1}{\sqrt{s^{\mathrm{H}} R_{v}^{-1} s}}$ (31)
The virtual missing lane is then estimated by using Eq. (27) with the minimum mean square error. This Error equation for proposed system in between imaginary drawn line and actual line is given by Eq. (32).
|En| ≤ fn+1 (z) |x-a|n+1 / (n+1)!… (32)
where, En is the error, x is the actual value, a is the centered polynomial and n is the degree of the polynomial.
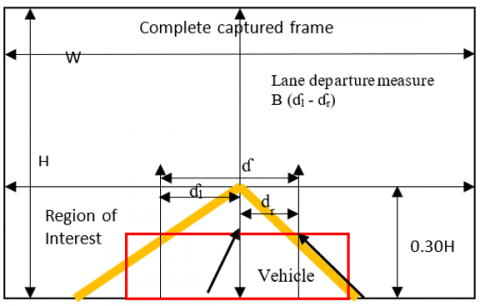
Once the lane is detected or virtual lane is drawn then the lane departure warning is to set by using practically calculated threshold. The vanishing point and the mid-point of the vehicle is calculated and then by using Pythagoras theorem Euclidean distance ɗl is calculated. The threshold values are dynamic and based on the road geometry, width of the total road captured. In this experiment, to make reading real time for nay road geometry ɗl / ɗ ratio is considered. The P1 and P2 are the threshold values set for left and right departure respectively. If the departure measure is less than 0.25 (P1), left departure warning is issued. If the departure measure is greater than 0.75 (P2), right departure warning is issued. If the vehicle is within the lane, departure measure shows the value between 0.25 and 0.75 and no warning is generated. Also, if ɗ (Euclidean distance between midpoint of right lane and left lane) is less than the threshold limit D, set as value 0.5, then the ‘Lane Crossing’ warning will be issued. Following is the illustration of Lane departure condition:
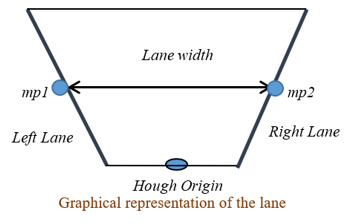
The lane width is calculated from the two lane midpoints mp1 and mp2 of left and right lanes. Euclidean distance is calculated as the square root of the sum of the squared differences between the two vectors. Euclidean distance is useful when we need to calculate the distance between two rows (or lane here) of numerical values. Hence we have chosen Euclidean distance rather than other measures like Hamming distance, Manhattan distance.
Euclidean distance between Hough origin and the left lane midpoint is calculated as per equation:
ɗl= $\sqrt{(H o-m p l x) ^{2}+(H o-m p l y) 2}$
ɗl= $\left\|m p l-H_{o}\right\|=\sqrt{\left\|H_{o}\right\|^{2}+\|m p l\|^{2}-2\left\|H_{o} \cdot m p l\right\|}$
ɗl vector is estimated in a given ROI in such a way that, for a Euclidean space E, the two vectors ɗl and ζ1 follows the equation:
$\lambda_{l}, ς_{l} \in E$
$\left\|\lambda_{l}+ς_{l}\right\|=\left\|\lambda_{l}\right\|^{2}+\left\|ς_{l}\right\|^{2}$
where, ζ1 is the line segment identified using Hough transform on the left lane.
Similarly, the vector ɗr, Euclidean distance between Hough origin and the right lane midpoint is calculated.
ɗl as Euclidean distance between midpoint of left lane and Hough origin
ɗr as Euclidean distance between midpoint of right lane and Hough origin
ɗ as Euclidean distance between midpoint of right lane and left lane
Lane departure measure-: Β (ɗl - ɗr)
If Β (ɗl - ɗr) < threshold P1 and ӓ greater than the threshold ɗ then, Left Departure warning is issued to the driver.
If Β (ɗl - ɗr) > threshold P2 and ӓ greater than the threshold ɗ then, Right Departure warning is issued to the driver. Conditions for lane departure and crossing are shown in Table 1.
Table 1. Conditions for lane departure and lane crossing situations
|
Sr. No. |
State |
Notation/ symbol |
Condition (mathematical equation) |
|
1 |
Left Departure |
ɗ L |
Β (ɗl - ɗr) < P1, ɗ > D |
|
2 |
Right Departure |
ɗ R |
Β (ɗl - ɗr) > P2, ɗ > D |
|
3 |
Lane crossing |
Ẽ C |
Β (ɗl - ɗr) > P1, Β (ɗl - ɗr) < P2, ɗ < D |
|
4 |
No Departure |
Ẽ N |
Β (ɗl - ɗr) > P1, Β (ɗl - ɗr) < P2, ɗ > D |
‘Lane Cross or Danger’ warning is issued to the driver indicating the threat of an accident, if the driver ignores departure warnings and the vehicle is beginning to actually change the lane. Hence, two threshold values are used to generate the warning message based on drift of vehicle towards the left or right of the road.
For the frontal vehicle detection technique, the cascade classifier is used to detect vehicle. Cascade classifier consists of a collection of different stages, and each stage worked on weak learner image part. Positive and negative images are passed through cascade object detector function which results in cascade classifier and then original image is passed through this classifier to detect frontal vehicle. The algorithm which is used here is as follow.
Algorithm: Vehicle detection algorithm:
1. Pick fmax (maximum acceptable false positive rate per layer)
2. Pick fmin (minimum acceptable false positive rate per layer)
3. Let’s FR target is target overall false positive rate
4. Let’s Ep is a set of positive example
5. Let’s En is a set of negative example
6. Let’s FR0= 1, D0 = 1, and i = 0
{FP0: overall false positive rate at layer 0, D0: acceptable detection rate at layer 0, i: the current layer}
7. While FRi > Ftarget {FPi: overall false positive rate at layer i}
A. i++ {layer increasing by 1}
B. ni = 0; FPi= FPi-1 {ni: negative example i}
C. While FPi > f* FPi -1
a. ni ++ {check a next negative example}
b. Use Ep and En to train with xml
c. Check the result of new classifier for FRi and D0
d. Decrease threshold for new classifier to adjust detection rate,
r>=d*FPi -1
D. En = empty
E. If FPi > Ftarget, use the current classifier and false
detection to set En
The proposed algorithm is executed on different hardware platform to check the performance. The test images are captured using a camera mounted at centre of vehicle on the rear-view mirror of a vehicle. Camera with full HD features with a resolution of 1920×1080, which is widely used in vehicles, is used to capture the images. The results are tested at the speed of 0 to 80km/hr. To evaluate the robustness of the proposed algorithm, a dataset that corresponds to daytime, night-time, twilight, rainy weather, and cloudy weather and includes curved and straight lanes was created.
The test set up at Vehicle level is as shown in Figure 3. Camera is mounted inside the vehicle at the center of the windshield glass above the rear view mirror. We have taken different trials with different types of camera. It is observed that the results are dependent on only mounting position of camera not on type camera. So we use USB based Web camera which is more enough for the same. It gives not only cost-effective solution but also ease of installation.
The designed system is tested on 6 real time captured videos and one library video. The analysis of these video is presented in Table 2. Also, geometry-based accuracy of the proposed system architecture with some existing systems architectures is shown in Table 3.
Figure 3. (a). USB web camera is connected to the laptop. (b). Camera is mounted on the top of the glass from inside. (c). Vision of mounted camera from outside of the car
From figure idea about chances of getting departure warning is presented. While there are orange, blue and red colour marking for left departure of vehicle, vehicle in lane and right departure of vehicle given in Figure 5 respectively. In video number six (Figure 5f) there is maximum density at vehicle in line where as there is maximum density at left lane departure and right lane departure at video number two (Figure 5b) and video number six (Figure 5f) respectively.
The percentage of road lane departure with respect to the video is shown in Figure 4.
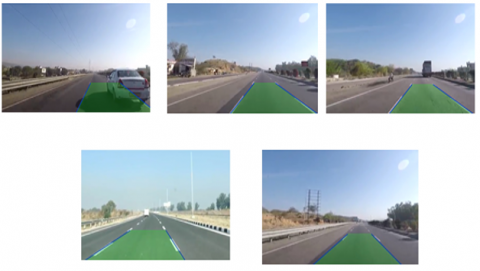
Some screenshots of the results in different environmental conditions are stated in Figure 6, Figure 7, and Figure 8.
Table 2. Parameters of the video after running proposed system architecture on it
|
Parameters |
Library video |
Captured video input1 |
Captured video input2 |
Captured video input3 |
Captured video input4 |
Captured video input5 |
Captured video input6 |
|
Environmental condition |
Normal day time |
Day time with sun facing to the vehicle |
Too bright day time |
Rainy day time |
Poor light dusk day time |
Missing lane with too bright day time |
Missing lane with poor light dusk day time |
|
Total Frames |
1765 |
1808 |
1673 |
1848 |
1615 |
2342 |
1260 |
|
Road Geometry |
Straight as well as curve |
Straight as well as curve |
Straight as well as curve |
Straight as well as curve |
Straight as well as curve |
Straight as well as curve |
Straight as well as curve |
|
Detected lanes |
1679 |
1768 |
1580 |
1788 |
1615 |
2337 |
1259 |
|
Lane detection rate |
97.63% |
97.83% |
96.44% |
94.46% |
96.75% |
93.82% |
94.34% |
|
No. of lane departures |
243 |
274 |
198 |
216 |
167 |
289 |
135 |
|
False warning |
0 |
0 |
0 |
1 |
0 |
1 |
2 |
Table 3. The geometry-based accuracy of the proposed system architecture with some existing systems architectures
|
Detection method |
Straight road |
Curvy Road |
Lane missing |
Only single lane on one side road |
|
Fuzzy Logic |
88 |
81.01 |
70 |
87 |
|
Gabor Transform |
97.89 |
96.04 |
72.28 |
96.04 |
|
Hough Transform |
93 |
92 |
74.01 |
91 |
|
Recursive Hough Transform |
97.5 |
95.01 |
90.42 |
95.9 |
|
Proposed System Architecture |
99.89 |
98 |
92.61 |
99 |
Figure 4. The percentage of road lane departure with respect to the video
Figure 5. CLUSTER-based analysis of six captured videos
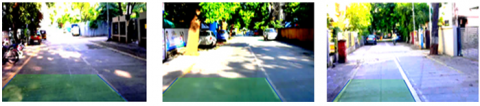
Figure 6. Result of the proposed system architecture at normal day time
Figure 7. Result of the proposed system architecture at rainy seasons
Figure 8. Result of the proposed system architecture when there is shadow on road
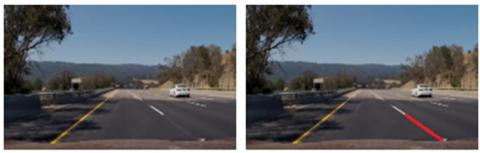
These results show the lane detection in almost every light condition. The result of drawing missing road lane marking is shown in Figure 9.
Figure 9. Virtual drawing of missing lane using proposed system architecture
Now the results based on geometry is tabulated in Table 4.
Comparative study of proposed system with other algorithms based on the different road geometry conditions based on lane detection is done here. The detection rate of the proposed algorithm for different road geometry conditions particularly for straight road condition, Curvy road, lane missing situation, only one lane marking present on one side as well is found 92.61 to 99.89 % which is higher than those of the other methods like Fuzzy Logic 70 to 88.00%, Gabor Transform 72.28 to 97.89%, Hough Transform 74.01 to 93.%, and Recursive HOG Transform 90.42 to 95.9%. By reducing the processing area from the entire image to the ROI by masking the white and yellow lane markings, we achieved the higher processing speed and detection rate. Thus the area of interest of the captured image is reduced drastically to achieve the faster processing speed and also by reducing the complexity of the algorithm. The proposed algorithm not only better as compare to other methods but also most effective in the lane missing situation of the road. This lane missing detection feature distinguishes the effectiveness of our algorithm from the existing methods.
The comparative study of proposed system with other algorithms depending on the accuracy and latency is tabulated in Table 5.
Table 4. Comparison of proposed system architecture with other existing algorithms on the basis of accuracy, time to response and error rate
|
Sr. No. |
Detection method |
Accuracy |
Time to response |
Error rate |
|
1 |
Gabor Transform |
97.71 |
5 sec |
1.73 % |
|
2 |
Fuzzy Logic |
89.42 |
2.3 sec |
4.14 % |
|
3 |
HOUGH Transform |
93.42 |
0.43 sec |
5.92 % |
|
4 |
Recursive HOG Transform |
96.76 |
0.54 sec |
3.24 % |
|
5 |
Proposed system architecture |
99.48 |
0.51 sec |
2.46 % |
Table 5. Results of different methods in different environmental Condition (detection in no. of events%)
|
Sr. No. |
Detection method |
Normal light condition |
Too bright condition |
Dark / shadow condition |
Twilight / poor light condition |
|
1 |
Gabor Transform |
94.65 |
92.48 |
84.46 |
62.49 |
|
2 |
Fuzzy Logic |
92.79 |
90.34 |
72.26 |
79.24 |
|
3 |
HOUGH Transform |
96.47 |
95.48 |
82.49 |
78.48 |
|
4 |
Recursive HOG Transform |
97.2 |
96.49 |
86.48 |
86.94 |
|
5 |
Proposed system architecture |
98.18 |
98.56 |
98.04 |
96.42 |
Figure 10. Confusion matrix: (a) lane departure warning, (b) classification of collision detection and vehicle overtaking
The confusion matrix of the proposed system algorithm for the classification of lane is shown in Figure 10.
Confusion matrix of the lane departure warning is shown in Figure 10a where the dominant vector of the matrix is much higher than other parameters. Also, in case of the classification of collision detection and vehicle overtaking the eigne vector of the matrix is strong.
Class wise accuracy is as tabulated below in Table 6. The overall accuracy of the collision detection and vehicle overtaking detection is 99.29%.
Separately class-wise performance parameters have been tabulated in Table 7. The overall accuracy of the collision detection and vehicle overtaking detection is 98.48%.
Time complexity is checked on the different processors. The average time required to get result of different hardware platforms is tabulated in Table 8.
The use of CPU, i5 and the i7 gives almost same time complexity, but when the system is tested on GPU then there is huge difference in time required to get the results.
Table 6. Performance parameters of the classification of in line, right warning and left warning using proposed system architecture
|
|
Accuracy |
Precision |
Recall |
F1-score |
|
In Line |
99.36% |
99% |
100% |
99% |
|
Right Warning |
99.46% |
99% |
98% |
98% |
|
Left Warning |
99.76% |
100% |
99% |
99% |
Table 7. Performance parameters of the classification collision detection warning and overtaking
|
|
Accuracy |
Precision |
Recall |
F1-score |
|
Collision Detection |
98.48% |
91% |
97% |
94% |
|
Vehicle Overtaking |
98.48% |
100% |
99% |
99% |
Table 8. The time it takes to get the result by using proposed system architecture on different hardware platforms
|
Platform |
Time required to get result (in seconds) |
|
CPU, i3 processor, 8GB RAM |
0.583 |
|
CPU, i5 processor, 8GB RAM |
0.511 |
|
CPU, I7 processor, 8GB RAM |
0.492 |
|
GPU, Nvidia K80 |
0.095 |
A new novel cost effective method of lane detection, departure warning and collision detection is proposed. Also, the algorithm which is used for the proposed system takes care of all challenging environmental situations like, too bright or poor light conditions, rainy condition, on curvature, with missing lane markings at different speed conditions of the vehicle.
The propose system uses the mathematical model along with cut section of the road image for extraction of area of interest. By using a new concept, recursive method and the lane marking masking methods are used in order to detect whether the vehicle is going away either right side or left side from the center of the lane and raise the warning. In case of possibility of collision, the system computes the distance from the frontal vehicle and gives the warning. Our system has maximum accuracy as compared with other methods. When we compare the response time then Hough transform takes slightly less time than our proposed framework but its error rate is higher than our system. In case of error rate Gabor transform gives best result but it has very high response time. Thus by taking consideration of all these factors one can easily conclude that proposed framework gives much better result compare to other algorithms. From all these aspects, the proposed system architecture is successfully verified with real videos and images under almost all possible conditions.
For this work we are thankful to College of Engineering, Pune and SPPU University, Pune.
[1] Jung, H., Min, J., Kim, J. (2013). An efficient lane detection algorithm for lane departure detection. In 2013 IEEE Intelligent Vehicles Symposium (IV), pp. 976-981. https://doi.org/110.1109/IVS.2013.6629593
[2] Lin, Q., Han, Y., Hahn, H. (2010). Real-time lane departure detection based on extended edge-linking algorithm. In 2010 Second International Conference on Computer Research and Development, pp. 725-730. https://doi.org/110.1109/ICCRD.2010.166
[3] Taubel, G., Sharma, R., Yang, J.S. (2014). An experimental study of a lane departure warning system based on the optical flow and Hough transform methods. WSEAS Transaction on Systems, 13: 105-115. http://www.wseas.us/journal/pdf/systems/2014/d205702-281.pdf.
[4] Lee, J.W., Yi, U.K. (2005). A lane-departure identification based on LBPE, Hough transform, and linear regression. Computer Vision and Image Understanding, 99(3): 359-383. https://doi.org/10.1016/j.cviu.2005.03.002
[5] Sharma, S., Shah, D.J. (2013). A much advanced and efficient lane detection algorithm for intelligent highway safety. Computer Science & Information Technology, 9(1): 51-59. https://doi.org/10.5121/csit.2013.3106
[6] Wu, C.F., Lin, C.J., Lin, H.Y., Chung, H. (2013). Adjacent lane detection and lateral vehicle distance measurement using vision-based neuro-fuzzy approaches. Journal of Applied Research and Technology, 11(2): 251-258. https://doi.org/10.1016/s1665-6423(13)71535-9
[7] Huang, J.J., Wu, J.R., Chen, Y.J. (2014). A real-time lane departure warning system based on TIDM6437. International Journal of Conceptions on Management and Social Sciences.
[8] ISO. (2017). Intelligent Transport Systems–Lane departure warning systems–Performance requirements and test procedures. International Organization for Standardization.
[9] Nieto, M., Arróspide Laborda, J., Salgado, L. (2011). Road environment modeling using robust perspective analysis and recursive Bayesian segmentation. Machine Vision and Applications, 22(6): 927-945. https://doi.org/10.1007/s00138-010-0287-7
[10] Zhou, S., Jiang, Y., Xi, J., Gong, J., Xiong, G., Chen, H. (2010). A novel lane detection based on geometrical model and Gabor filter. In 2010 IEEE Intelligent Vehicles Symposium, pp. 59-64. https://doi.org/10.1109/IVS.2010.5548087
[11] Xu, H., Wang, X. (2012). Camera calibration based on perspective geometry and its application in LDWS. Physics Procedia, 33: 1626-1633. https://doi.org/10.1016/j.phpro.2012.05.262
[12] Wang, J.G., Lin, C.J., Chen, S.M. (2010). Applying fuzzy method to vision-based lane detection and departure warning system. Expert systems with applications, 37(1): 113-126. https://doi.org/10.1016/j.eswa.2009.05.026
[13] Huh, K., Park, J., Hwang, J., Hong, D. (2008). A stereo vision-based obstacle detection system in vehicles. Optics and Lasers in Engineering, 46(2): 168-178. https://doi.org/10.1016/j.optlaseng.2007.08.002
[14] Bar Hillel, A., Lerner, R., Levi, D., Raz, G. (2014). Recent progress in road and lane detection: A survey. Machine Vision and Applications, 25(3): 727-745. https://doi.org/10.1007/s00138-011-0404-2
[15] Nedevschi, S., Schmidt, R., Graf, T., et al. (2004). 3D lane detection system based on stereovision. In Proceedings. The 7th International IEEE Conference on Intelligent Transportation Systems (IEEE Cat. No. 04TH8749), pp. 161-166. https://doi.org/10.1109/ITSC.2004.1398890
[16] McCall, J.C., Trivedi, M.M. (2006). Video-based lane estimation and tracking for driver assistance: Survey, system, and evaluation. IEEE Transactions on Intelligent Transportation Systems, 7(1): 20-37. https://doi.org/10.1109/TITS.2006.869595
[17] Petrovai, A., Danescu, R., Nedevschi, S. (2015). A stereovision based approach for detecting and tracking lane and forward obstacles on mobile devices. In 2015 IEEE Intelligent Vehicles Symposium (IV), pp. 634-641. https://doi.org/10.1109/IVS.2015.7225756
[18] Son, J., Yoo, H., Kim, S., Sohn, K. (2015). Real-time illumination invariant lane detection for lane departure warning system. Expert Systems with Applications, 42(4): 1816-1824. https://doi.org/10.1016/j.eswa.2014.10.024
[19] Castleman, K.R. (1996). Digital Image Processing. Prentice Hall Press. https://doi.org/10.1002/0470097434
[20] Wu, C.B., Wang, L.H., Wang, K.C. (2018). Ultra-low complexity block-based lane detection and departure warning system. IEEE Transactions on Circuits and Systems for Video Technology, 29(2): 582-593. https://doi.org/10.1109/TCSVT.2018.2805704
[21] Saleh, L., Chevrel, P., Claveau, F., Lafay, J.F., Mars, F. (2013). Shared steering control between a driver and an automation: Stability in the presence of driver behavior uncertainty. IEEE Transactions on Intelligent Transportation Systems, 14(2): 974-983. https://doi.org/10.1109/TITS.2013.2248363
[22] RetroGameTech. (2013). Springtime in Scotland - outrun edition - risky snow ride - wide angle dash cam. YouTube, YouTube. https://www.youtube.com/watch?v=5GIAbhIopCE&t=29s.
[23] JJ17Productions. (2016). Road trip in the snow to oak glen CA. Law’s Coffee Shop. Snowstorm, Contour Dash Cam," in YouTube, YouTube. https://www.youtube.com/watch?v=xkOzBIL5Yjk&t=39s.
[24] Wu kasyuu. (2014). Road trip to Alishan by new central cross-island highway in foggy weather. YouTube, YouTube. https://www.youtube.com/watch?v=9toWef2FHF4&t=27s.
[25] Wu, C.F., Lin, C.J., Lee, C.Y. (2011). Applying a functional neurofuzzy network to real-time lane detection and front-vehicle distance measurement. IEEE Transactions on Systems, Man, and Cybernetics, Part C (Applications and Reviews), 42(4): 577-589. https://doi.org/10.1109/TSMCC.2011.2166067
[26] Mu, C., Ma, X. (2014). Lane detection based on object segmentation and piecewise fitting. TELKOMNIKA Indonesian Journal of Electrical Engineering, 12(5): 3491-3500. ttp://dx.doi.org/10.11591/telkomnika.v12i5.3240
[27] Ladkat, A.S., Date, A.A., Inamdar, S.S. (2016). Development and comparison of serial and parallel image processing algorithms. In 2016 International Conference on Inventive Computation Technologies (ICICT), 2: 1-4. https://doi.org/10.1109/INVENTIVE.2016.7824894
[28] Bangare, S.L., Patil, M., Bangare, P.S., Patil, S.T. (2015). Implementing tumor detection and area calculation in MRI image of human brain using image processing techniques. Int. Journal of Engineering Research and Applications, 5(4): 60-65.
[29] Bangare, S.L., Dubal, A., Bangare, P.S., Patil, S.T. (2015). Reviewing Otsu’s method for image thresholding. International Journal of Applied Engineering Research, 10(9): 21777-21783. https://dx.doi.org/10.37622/IJAER/10.9.2015.21777-21783
[30] Bangare, S.L., Pradeepini, G., Patil, S.T. (2018). Regenerative pixel mode and tumour locus algorithm development for brain tumour analysis: A new computational technique for precise medical imaging. International Journal of Biomedical Engineering and Technology, 27(1-2): 76-85.
[31] Bangare, S.L., Pradeepini, G., Patil, S.T. (2017). Neuroendoscopy adapter module development for better brain tumor image visualization. International Journal of Electrical and Computer Engineering, 7(6): 3643-3654. https://doi.org/10.11591/ijece.v7i6.pp3643-3654
[32] Gulati, K., Sriram, V.P., Sharma, M., Eliyas, S., Bangare, S.L. (2021). Use for graphical user tools in data analytics and machine learning application. Turkish Journal of Physiotherapy and Rehabilitation, 32(3): 3540-3546.
[33] Joseph, L.L., Shrivastava, P., Kaushik, A., Bangare, S.L., Naveen, A., Raj, K.B., Gulati, K. (2021). Methods to identify facial detection in deep learning through the use of real-time training datasets management. EFFLATOUNIA-Multidisciplinary Journal, 5(2): 1298-1311.
[34] Bangare, S.L. (2022). Classification of optimal brain tissue using dynamic region growing and fuzzy min-max neural network in brain magnetic resonance images. Neuroscience Informatics, 2(3): 100019. https://doi.org/10.1016/j.neuri.2021.100019
[35] Bangare, S.L., Shinde, K.S. (2019). Severity identification of diabetic retinopathy in medical images. International Journal of Information and Computing Science, 4(6): 13-16.
[36] Awate, G., Bangare, S., Pradeepini, G., Patil, S. (2018). Detection of Alzheimers disease from MRI using convolutional neural network with tensorflow. arXiv preprint arXiv:1806.10170. https://arxiv.org/abs/1806.10170.
[37] Bangare, S.L., Pradeepini, G., Patil, S.T. (2017). Brain tumor classification using mixed method approach. In 2017 International Conference on Information Communication and Embedded Systems (ICICES), pp. 1-4. https://doi.org/10.1109/ICICES.2017.8070748
[38] Mall, S., Srivastava, A., Mazumdar, B.D., Mishra, M., Bangare, S.L., Deepak, A. (2022). Implementation of machine learning techniques for disease diagnosis. Materials Today: Proceedings, 51: 2198-2201. https://doi.org/10.1016/j.matpr.2021.11.274
[39] Pande, S., Chetty, M.S.R. (2019). Analysis of Capsule Network (Capsnet) architectures and applications. Journal of Advanced Research in Dynamical and Control Systems, 10(10): 2765-2771.
[40] Pande, S., Chetty, M.S.R. (2019). Bezier curve based medicinal leaf classification using capsule network. International Journal of Advanced Trends in Computer Science and Engineering, 8(6): 2735-2742. https://doi.org/10.30534/ijatcse/2019/09862019
[41] Pande, S.D., Chetty, M.S.R. (2021). Fast medicinal leaf retrieval using CapsNet. In: Bhattacharyya, S., Nayak, J., Prakash, K.B., Naik, B., Abraham, A. (eds) International Conference on Intelligent and Smart Computing in Data Analytics. Advances in Intelligent Systems and Computing, vol 1312. Springer, Singapore. https://doi.org/10.1007/978-981-33-6176-8_16
[42] Pande, S.D., Jadhav, P.P., Joshi, R., Sawant, A.D., Muddebihalkar, V., Rathod, S., Gurav, M.N., Das, S. (2022). Digitization of handwritten Devanagari text using CNN transfer learning – A better customer service support. Neuroscience Informatics, 2(3): 100016. https://doi.org/10.1016/j.neuri.2021.100016