Minu M S* | Aroul Canessane R | Subashka Ramesh S S
© 2022 IIETA. This article is published by IIETA and is licensed under the CC BY 4.0 license (http://creativecommons.org/licenses/by/4.0/).
OPEN ACCESS
In present times, unmanned aerial vehicles (UAVs) are widely employed in several real time applications due to their autonomous, inexpensive, and compact nature. Aerial image classification in UAVs has gained significant interest in surveillance systems that assist object detection and tracking processes. The advent of deep learning (DL) models paves a way to design effective aerial image classification techniques in UAV networks. In this view, this paper presents a novel optimal Squeezenet with a deep neural network (OSQN-DNN) model for aerial image classification in UAV networks. The proposed OSQN-DNN model initially enables the UAVs to capture images using the inbuilt imaging sensors. Besides, the OSQN model is applied as a feature extractor to derive a useful set of feature vectors where the coyote optimization algorithm (COA) is employed to optimally choose the hyperparameters involved in the classical SqueezeNet model. Moreover, the DNN model is utilized as a classifier that aims to allocate proper class labels to the applied input aerial images. Furthermore, the usage of COA for hyperparameter tuning of the SqueezeNet model helps to considerably boost the overall classification performance. For examining the enhanced aerial image classification performance of the OSQN-DNN model, a series of experiments were performed on the benchmark UCM dataset. The experimental results pointed out that the OSQN-DNN model has resulted in a maximum accuracy of 98.97% and a minimum running time of 1.26mts.
unmanned aerial vehicles, aerial image classification, deep learning, SqueezeNet, hyperparameter tuning
Recently unmanned aerial vehicles (UAVs) gained more interest in several areas such as monitoring, surveillance, data collection, and mobile relays [1]. Usually, UAVs could give the line of sight (LoS) connections and therefore provide good connection capability. Because of their low cost, flexible deployment, and significant mobility, UAVs are presented for several applications and operations like search and rescue, precision agriculture, disaster warning, and timely environment monitoring. Additionally, UAVs could be utilized as mobile relays for extending the coverage & capability of the network [2]. By raising the attractiveness in the area of Facebook Aquila Drone Google Loon Project and information technology (IT), Katikala [3] aims for providing global internet access to the user in remote places with the help of UAV. Additionally, UAV could be placed as aerial base stations (BS) for the ground terminals (GTs) since they can be flexibly adapted. Therefore, it provides an aerial platform that could be broadly employed in a wireless transmission system, since they could give terrestrial aerial transmission service to the terrestrial user from a region that lacks terrestrial infrastructure or in overload situations.
Land cover classification is a major component of UAV application, and it is hard for building whole autonomous schemes. Because of the UAV movement, the images are unclear, by noisy frequency, since the onboard cameras often produce lower resolution images. In many UAV applications, the detection process is very difficult because of their needs. Aerial imagery classification of scene classifies the acquired aerial images to sub-regions via covering many ground objects and type of land cover too many semantic kinds. Also, for several real-world applications of remote sensing such as computer cartography, management of resources, and urban planning, aerial image classification is very important [4]. Generally, some of the related object’s classes or kinds of land covers are allocated among numerous kinds of scenes. As, commercial and residential are the 2 main kinds of a scene which may contain roads, trees, and buildings; but it has a variance from spatial sharing and density of 3 classes. Thus, the aerial scenes are classified as depending upon the spatial and structural pattern complexities are the challenging issue.
The DL methods like CNN techniques are extensively identified as a leading method for several computer vision applications (image or video classification, recognition, and detection) and have displayed significant results in various applications [5]. Henceforth, it has several advantages of utilizing DL methods in disaster management and emergency response applications for properly retrieving crucial data in an appropriate manner and allowing optimism reaction and preparation in time critical situations and supports from the loop decision making process [6].
Previous studies have shown how DL methods could confront conventional ML approaches using handcrafted features by TL method while pre-trained CNN is utilized as a feature extractor and more than one layer are included on top for performing classification to the novel tasks. Although CNN methods are highly effective at classification tasks, its implication speed on embedding minimal power environments like individuals established on-board UAVs is hampered using higher computation costs that they obtain [7], particularly while deliberating the requirement for running numerous vision tasks on a similar platform. Thus, for various applications, local embedded processes close the sensors are preferable on the cloud because of latency/privacy problems, or operation in the remote area where there is constrained or even no connections. Additionally, purposes create smaller network could give the essential performance and accuracy to niche applications whereas large data isn't presented and computation limitations are enforced. Likewise, over the computation performance, they are quicker to endure training iteration and more easily upgradable on the air. So, utilizing a smaller CNN is friendly for nearby sensor (edge) processing to execute aerial scene classification on-board, UAVs become fascinating and sensible alternatives for the regular methods.
This paper presents a novel optimal SqueezeNet with a deep neural network (OSQN-DNN) model for aerial image classification in UAV networks. The proposed OSQN-DNN model initially permits the UAVs to capture images employing the inbuilt imaging sensors. Also, the OSQN method is applied as a feature extractor to derive a helpful group of feature vectors where the coyote optimization algorithm (COA) is employed to optimally choose the hyperparameters involved in the classical SqueezeNet model. Additionally, the DNN model is used as a classifier that intends to allocate proper class labels to the applied input aerial images. To assess the outcomes of the OSQN-DNN model, a wide range of simulations was performed on the benchmark UCM dataset. Haq et al. [8] utilized DL based supervised image classification method and images gathered by UAV for classifying forest regions. The DL method stacked AE was established to have huge significance based on image classification and the evaluation of forest coverage region. This investigational result shows that the DL technique gave an optimum accurateness over other ML methods. Rajagopal et al. [9] presented a novel multiobjective optimization technique to evolve advanced DCNN for scene classification that automatically creates non-dominant solutions at the Pareto front. They utilize a group of 2 standard datasets for testing the efficiency of the scene classification method and create complete relative research.
Hong et al. [10] presented a DL based object detection technique utilizing aerial photographs gathered with a UAV. The dataset comprising aerial photographs contains different images of birds in many bird habitations and the area of farmland and lakes. Additionally, aerial images of bird decoys are taken for attaining several bird patterns and precise bird data. Bird detection methods like, RFCN, SSD, RCNN, YOLO, and Retinanet have been made and the efficiency of the whole methods are evaluated by relating their average precision and computing speed.
Zhao et al. [11] projected a novel saliency detection method for faster segmentation and location of basic fire regions in aerial images. Since the presented technique could efficiently evade feature damage created by straight resizing; it can be utilized from the data formation and augmentation of a regular fire image dataset ‘UAV_Fire’. They estimated distinct frameworks and many significant variables like (batch size, drop out ratio, and so on.) of the DCNN method about its authentication accuracy.
Yuan et al. [12] emphasize automatic aerial scene classification of disaster events from onboard UAVs. Especially, a devoted AIDER application is presented and relative analyses of present methods are executed. Kyrkou and Theocharides [13] by this analysis a light-weighted CNN framework is presented, represents EmergencyNet, depending upon atrous convolution for processing multiresolution features, and able to run effectively on low power embedded platform attaining up to 20× high efficiency.
Onishi and Ise [14] created a machine vision scheme for detecting trees and mapping by RGB images captured by UAV and CNN. In this scheme, they firstly estimated the slope from the 3D module attained using UAV, and segment the UAV RGB photographs of the forest to numerous tree crown objects manually by colour and 3D data and the slope module, and finally employ object-based CNN classification for every crown images. Khan et al. [15] established a precise real world detection scheme of spraying regions for UAV that is most significant for UAV based sprayers. The 2 step target detection scheme was established with the help of DL for the images gathered from UAV. Vaddi et al. [16] proposed an end-to-end object recognition module run on a UAV framework that is appropriate for real world applications. They proposed a deep feature pyramid framework that utilizes integral properties of features extracted from Convolution Network via taking additional generic features in the images like colour, edge, and so on alongside minute thorough features certain to the classes included in this challenge.
Figure 1 showcases the workflow of the OSQN-DNN model for aerial image classification. It encompasses preprocessing, SqueezeNet based feature extraction, COA based parameter optimization, and DNN based classification. The comprehensive working of these procedures is obtainable in the following subsections.
Figure 1. The architecture of proposed method
Figure 2. Layered architecture of SqeezeNet
3.1 SqueezeNet model
In the beginning, the preprocessed aerial images are fed into the SqueezeNet model to generate a useful set of feature vectors. SqueezeNet is a convolutional network that performs improved efficiency compared to AlexNet using 50x fewer variables. It has 15 layers together 5 distinct layers as 3 max pooling layers, 2 convolutional layers, 8 fire layers, 1 output layer softmax, and 1 global average pooling layer. The layered framework of the network is depicted in Figure 2.
As displayed, K×K signifies receptive field size of the filter, s represents stride size and l indicates feature map length, correspondingly. The input of the network contains 227×227 dimensional through RGB channel. An input image is generalized with convolution and max pooling is employed. Convolutional layers convolute among the weights and smaller areas in an input volume, by 3×3 kernel. All the convolutional layers perform layer wise activation functions as a positive portion of their argument. It uses the fire layer that is made up of expansion & squeeze stages among the convolutional layers. The squeeze stage utilizes the filters of size 1×1, whereas expansion utilizes the filter of sizes 1×1 and 3×3. Initially, the input tensors H×W×C pass by the squeeze and the number of convolutions are equivalent to C/4 of the amount of input tensors channel [17]. Afterward in the initial stage, the data pass by the expansion and depth of the data is extended to C/2 of the output tensor depth. Lastly, expansion output is arranged from the depth dimensional of input tensors by integrating function. Figure 3 illustrates the process flow of the fire module of SqeezeNet. Assume FM&C determine the features map and channel, the output layer f{y} of the squeeze function using kernel w is given by:
$f\{y\}=\sum_{f m 1=1}^{F M} \sum_{c=1}^{c} w_{c}^{f} x_{c}^{f m 1}$ (1)
Now, $f\{y\} \in \mathbb{R}^{N}$ and $w \in \mathbb{R}^{C \times 1 \times F M 2}$. The squeeze output could be determined by a weighted integration of the feature map of distinct tensors. During this network, the max pool layer executes downsampling function together with the spatial dimension and the global average pool converts the feature map of the class to one value. Finally, the softmax activation operation provides multiclass likelihood distribution.
The reason to design the SqueezeNet framework is, it has 3 major benefits: 1) The network is highly effective since it has fewer variables, 2) Application established to these networks are easier for moving and need a lesser transmission, 3) the module size is lesser compared to 5 MB and it is easier for implementing the embedded system.
Figure 3. Fire module of SqeezeNet
3.2 COA based parameter optimization
For boosting the overall performance of the SqueezeNet model, COA is utilized to optimally choose the hyperparameters involved in it.COA is the latest meta-heuristic method initially presented by Pierezan and Coelho [18]. A major stimulation of COA derived in the social life of Canislatrans species that is mostly lived from NA. The researchers of COA concentrated on the experience interchange among coyotes and their social structures using their adaption to the atmosphere. The population in the COA is separated into equivalent amounts of coyotes for each pack. All the coyote positions are deliberated a likely solution and their social conditions (group of decision parameters) represent the objective functions. Initially, the method begins by arbitrarily allocating the coyote's position as:
$X_{i}=l b_{i}+r_{i} \times\left(u b_{i}-l b_{i}\right)$ (2)
whereas $u b_{i}$ & $l b_{i}$ denotes upper & lower bounds, $r_{i}$ represents arbitrary amount among zero & one and $X_{i}$ indicates the location of coyote at $i^{t h}$ dimension. The coyote’s position is determined with the help of upper bound and lower bound which represents the arbitrary amount. In COA, the number of coyotes for every pack is constrained to fourteen. This could assurance the exploration ability of the method. The optimal coyote is determined as an optimal one adopted to the atmosphere. Alternatively, it can be one using minimal cost function to the minimization problem and another using maximal cost function to the maximization problem. In COA, the coyote is arranged to contribute to maintaining packs and sharing the social condition. The social tendency of the pack is calculated by
$Y_{i}^{p, t}=\left\{\begin{array}{cc}\frac{C_{N_{c}+1}^{p,t}}{2}, & N_{c} \text { isodd } \\ C^{p, t}_\frac{\left(\frac{N_{c}}{2}+1\right), i}{2}, & \text { Otherwise }\end{array}\right.$ (3)
whereas $N_{c}$ denotes amount of coyotes, $Y_{i}^{p, t}$ represents the social tendency of $p^{t h}$ pack in $t^{t h}$ time and C indicates coyote ranked social condition [19]. Depending upon birth and death (the 2 major living events of life), the birth of a novel coyote is calculated by
$B_{i}^{p, t}=\left\{\begin{array}{lc}X_{r 1, i}^{p, t}, & r_{i} \geq P r_{s}+P r_{a} \text { or } i=i 1 \\ X_{r 2, i}^{p, i} ,& r_{j}<P r_{s} \text { ori }=i 2 \\ R_{i}, & \text { Otherwise }\end{array}\right.$ (4)
whereas i1&i2 denotes 2 arbitrary dimensions, r1&r2 represent 2 coyotes arbitrarily chosen from $p^{t h}$ pack, $r_{i}$ signifies arbitrary amount created in zero and one, $\operatorname{Pr}_{a}$ denotes relationship likelihood and $\mathrm{Pr}_{s}$ denotes scatter possibility. $\operatorname{Pr}_{a}$&$\operatorname{Pr}_{s}$ is evaluated by
$P r_{s}=\frac{1}{D}$ (5)
$P r_{a}=\frac{1-P r_{s}}{2}$ (6)
In all iteration, every $c^{t h}$ coyotes in $p^{t h}$ pack upgrade its social condition by:
$X_{c}^{p, t+1}=\left\{\begin{array}{l}X_{c}^{p, t}+r 1 \times \sigma_{1}+r 2 \times \sigma_{2}, \quad F_{c}^{p, t+1}<F_{c}^{p, t} \\ X_{c}^{p, t}, \quad \text { Otherwise }\end{array}\right.$ (7)
whereas $\sigma_{1}$ & $\sigma_{2}$ represent alpha and pack influences, correspondingly. It is given by:
$\sigma_{1}=\operatorname{alpha}^{p, t}-X_{r 1}^{p, t}$ (8)
$\sigma_{2}=Y^{p, t}-X_{r 2}^{p, t}$ (9)
whereas alpha,t denotes alpha coyote. $F_{c}^{p, t}$ indicates social condition cost (objective function). They are defined as
$F_{c}^{p, t+1}=f\left(X_{c}^{p, t}\right)$ (10)
Lastly, the optimal coyote is chosen according to the social condition cost since an optimal solution is attained.
3.3 DNN based classification
During the classification process, the extracted feature vectors are fed into the DNN model to allocate proper class labels to it. Artificial Neural Networks (ANN) is assumed to be a computation intelligence module developed from a biological neuron system for solving natural language processing, drug identification, and predictive problem. A DNN has a specific level of difficulty, a NN has a huge layer. DNN employs a complex mathematical module in processing the data. Henceforth, the NN has attained an efficacy in a difficult application for finding the patterns in previous years. In essence, DNN is made up of input layers for real descriptor Xl, L hidden layer, and resulting layer for predicting data. Figure 4 illustrates the architecture of DNN.
Figure 4. Structure of DNN
The DNN is developed using Python programming language, exploitation of TensorFlow module, and tf.contrib.learn.DNN Classification DL library from Google. In recent times, the conventional modules are placed by an optimal NN using a number of layers and neuron values [20]. The automatic structure of DNN is performed by altering the provided metrics. The quantity of hidden layers, the activation functions, amount of learning steps and, all the hidden layers made up of neurons. The DNN Classification employed tends for producing entire neuron layers, in the application of the ReLU activation functions. It can be clear that DNN is productive and simple. The output layer was depending upon softmax functions, and cost functions are termed cross-entropy. The rectifier is assumed that exist activation functions as provided by Eq. (11):
$F(x)=x^{+}=\max (0, x)$ (11)
whereas x represents the input. It is called a ramp function which is similar to half-wave rectification computations. An element that employs a rectifier is named ReLU.
$f(x)=\ln [1+\exp (x)$ (12)
which is called a soft plus function. When investigating the predictive procedure, a novel illustration of a real descriptor is extracted in hidden layer as follows:
$X_{t+1}=H\left(W_{l} X_{l}+B_{l}\right), \quad l=1, \ldots, L$ (13)
where, Wl and Bl indicate weight matrix and biasing lth hidden layers, and H represents the comparison of activation functions.
This section validates the performance of the OSQN-DNN technique on the UCM dataset [21]. It comprises 100 images under 21 class labels, gathered from the USGS National Map Urban Area Imagery collection [22]. The distinct class labels are used in Figure 5 which illustrates the sample images from the dataset.
Figure 5. Sample images in dataset
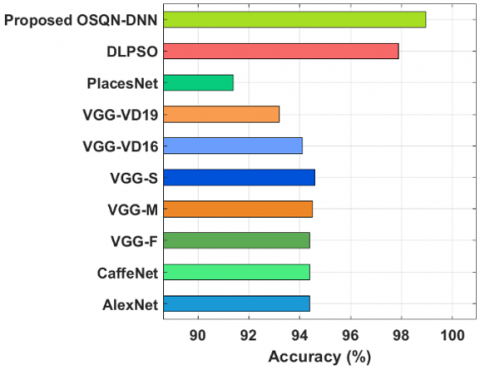
Accuracy analysis of the OSQN-DNN with recent techniques in Table 1 and Figure 6. The figure has shown that the Places Net technique has gained worse outcomes with the lowest accuracy of 91.4% whereas the VGG-VD19 algorithm has offered somewhat enhanced efficiency with an accuracy of 93.2%. Moreover, the VGG-VD16, AlexNet, CaffeNet, and VGG-F techniques have gained moderately closer accuracy values. Furthermore, the VGG-M and VGG-S approaches have gained reasonable outcomes with the accuracy of 94.5% and 94.6%. Eventually, the DLPSO technique has resulted in a considerable accuracy of 97.9%. However, the proposed OSQN-DNN technique has accomplished a maximal efficiency with an accuracy of 98.97%.
Figure 6. Accuracy analysis of OSQN-DNN Method with existing techniques
Figures 7 & 8 investigates the classification performance of the OSQN-DNN technique over the other techniques in terms of different measures. From the experimental mechanism the Optimal SqueezeNet with DNN has been done to create network with the help of some parameters to get good outcome. On examining the results in terms of precision, it can be apparent that the CARNet-BiLSTM method has resulted in poor results with the precision of 77.9% whereas the VGG-RBF and CACGNet-LSTM models have obtained somewhat improved outcomes with the precision of 78.2% and 78.5% respectively. Next to that, the VGGNet, CAVGG-BiLSTM, CAGNet-BiLSTM, RNet-RBF, and CARNet-LSTM techniques have accomplished moderately closer performance. Meanwhile, the GNet-RBF, GNet, CAVGG-LSTM, and RNet-50 techniques have resulted in a reasonable performance with the precision of 80%, 80.5%, 80.6%, and 80.9% respectively. However, the OSQN-DNN methodology has exhibited better outcomes with a higher precision of 98.99%.
Figure 7. Precision and recall analysis of OSQN-DNN model
Next, on investigating the outcomes with respect to F-score, it can be stated that the VGGNet model has resulted to worse results with the F-score of 78.5% whereas the VGG-RBF and CACGNet-LSTM techniques have obtained somewhat increased outcomes with the F-score of 78.8% and 79.6% respectively. Followed by, the RNet-50, CAVGG-BiLSTM, RNet-RBF, GNet, and CARNet-LSTM techniques have accomplished moderately closer performance. In the meantime, the CARNet-BiLSTM, CAVGG-LSTM, GNet-RBF, CAGNet-LSTM, and CAGNet-BiLSTM manners have resulted to a reasonable performance with the F-score of 81.4%, 81.5%, 81.5%, 81.8%, and 81.8% correspondingly. Finally, the OSQN-DNN methodology has outperformed the optimum result with a maximum F-score of 98.54%.
Figure 8. F-score analysis of OSQN-DNN model with existing techniques
Table 1. Running time (s) analysis of proposed OSQN-DNN method with various models
|
Methods |
Running Time (m) |
|
AlexNet |
1.43 |
|
CaffeNet |
1.42 |
|
VGG-F |
1.37 |
|
VGG-M |
2.07 |
|
VGG-S |
2.25 |
|
VGG-VD16 |
7.05 |
|
VGG-VD19 |
8.27 |
|
PlacesNet |
1.37 |
|
DLPSO |
1.33 |
|
Proposed OSQN-DNN |
1.26 |
Figure 9. Running time analysis of OSQN-DNN model with different methods
To determine the results with respect to recall, it can be clear that the RNet-50 technique has resulted in the least outcomes with the recall of 82% whereas the VGGNet and CAVGG-LSTM approaches have attained slightly higher results with the recall of 82.3% and 82.5% correspondingly. Likewise, the VGG-RBF, CAVGG-BiLSTM, GNet, RNet-RBF, and CARNet-LSTM algorithms have accomplished moderately closer performance. Similarly, the GNet-RBF, CAGNet-BiLSTM, CAGNet-LSTM, and CARNet-BiLSTMmanners have resulted in a reasonable performance with the recall of 86.8%, 87.1%, 88.6%, and 89% correspondingly. Eventually, the OSQN-DNN technique has demonstrated a better outcome with a superior recall of 98.94%.
A running time analysis of the OSQN-DNN with recent state of art methods is in Table 3 and Figure 9 [23-25]. The figure has shown that the VGG-VD19 and VGG-VD16 models have accomplished ineffective performance with the maximum running time of 8.27mts and 7.05mts respectively. In line with that, the VGG-S and VGG-M models have showcased certainly improved outcomes with the running time of 2.25mts and 2.07mts respectively. Furthermore, the AlexNet, CaffeNet, VGG-F, and PlacesNet models have demonstrated somewhat lower and closer running times. Though the DLPSO algorithm has required a tolerable running time of 1.33mts, the OSQN-DNN technique has portrayed an effectual outcome with a minimal running time of 1.26mts.
This paper has designed an effective OSQN-DNN model for effective aerial image classification in UAV networks. The proposed OSQN-DNN model initially enables the UAVs to capture images using the inbuilt imaging sensors. The proposed OSQN-DNN model comprises preprocessing, SqueezeNet based feature extraction, COA based parameter optimization, and DNN based classification. For boosting the overall performance of the SqueezeNet method, COA is utilized to optimally choose the hyperparameters involved in it. Furthermore, the usage of COA for hyperparameter tuning of the SqueezeNet model helps to considerably boost the overall classification efficiency. For assessing the outcomes of the OSQN-DNN method, a wide range of simulations was performed on the benchmark UCM dataset. The experimental results pointed out that the OSQN-DNN methodology has resulted in a higher accuracy of 98.97% and a minimum running time of 1.26mts. In the future, lightweight cryptographic techniques can be deployed in UAVs to accomplish a secure data transmission process.
[1] Xu, Y., Xiao, L., Yang, D., Cuthbert, L., Wang, Y. (2018). Energy-efficient UAV communication with multiple GTs based on trajectory optimization. Mobile Information Systems. https://doi.org/10.1155/2018/5629573
[2] Zeng, Y., Zhang, R., Lim, T.J. (2016). Throughput maximization for UAV-enabled mobile relaying systems. IEEE Transactions on Communications, 64(12): 4983-4996. https://doi.org/10.1109/TCOMM.2016.2611512
[3] Katikala, S. (2014). Google project loon. InSight: Rivier Academic Journal, 10(2): 1-6.
[4] Dewangan, R.K., Shukla, A., Godfrey, W.W. (2019). Three dimensional path planning using grey wolf optimizer for UAVs. Applied Intelligence, 49(6): 2201-2217. https://doi.org/10.1007/s10489-018-1384-y
[5] Hohman, F., Kahng, M., Pienta, R., Chau, D.H. (2018). Visual analytics in deep learning: An interrogative survey for the next frontiers. IEEE Transactions on Visualization and Computer Graphics, 25(8): 2674-2693. https://doi.org/10.1109/TVCG.2018.2843369
[6] Nguyen, D.T., Joty, S., Imran, M., Sajjad, H., Mitra, P. (2016). Applications of online deep learning for crisis response using social media information. arXiv preprint arXiv:1610.01030.
[7] Shafique, M., Theocharides, T., Bouganis, C.S., Hanif, M.A., Khalid, F., Hafız, R., Rehman, S. (2018). An overview of next-generation architectures for machine learning: Roadmap, opportunities and challenges in the IoT era. In 2018 Design, Automation & Test in Europe Conference & Exhibition (DATE), pp. 827-832. https://doi.org/10.23919/DATE.2018.8342120
[8] Haq, M.A., Rahaman, G., Baral, P., Ghosh, A. (2021). Deep learning based supervised image classification using UAV images for forest areas classification. Journal of the Indian Society of Remote Sensing, 49(3): 601-606. https://doi.org/10.1007/s12524-020-01231-3
[9] Rajagopal, A., Joshi, G.P., Ramachandran, A., Subhalakshmi, R.T., Khari, M., Jha, S., Shankar, K., You, J. (2020). A deep learning model based on multi-objective particle swarm optimization for scene classification in unmanned aerial vehicles. IEEE Access, 8: 135383-135393. https://doi.org/10.1109/ACCESS.2020.3011502
[10] Hong, S.J., Han, Y., Kim, S.Y., Lee, A.Y., Kim, G. (2019). Application of deep-learning methods to bird detection using unmanned aerial vehicle imagery. Sensors, 19(7): 1651-1651. https://doi.org/10.3390/s19071651
[11] Zhao, Y., Ma, J., Li, X., Zhang, J. (2018). Saliency detection and deep learning-based wildfire identification in UAV imagery. Sensors, 18(3): 712-712. https://doi.org/10.3390/s18030712
[12] Yuan, C., Zhang, Y., Liu, Z. (2015). A survey on technologies for automatic forest fire monitoring, detection, and fighting using unmanned aerial vehicles and remote sensing techniques. Canadian Journal of Forest Research, 45(7): 783-792. https://doi.org/10.1139/cjfr-2014-0347
[13] Kyrkou, C., Theocharides, T. (2020). Emergencynet: Efficient aerial image classification for drone-based emergency monitoring using atrous convolutional feature fusion. IEEE Journal of Selected Topics in Applied Earth Observations and Remote Sensing, 13: 1687-1699. https://doi.org/10.1109/JSTARS.2020.2969809
[14] Onishi, M., Ise, T. (2021). Explainable identification and mapping of trees using UAV RGB image and deep learning. Scientific Reports, 11(1): 1-15. https://doi.org/10.1038/s41598-020-79653-9
[15] Khan, S., Tufail, M., Khan, M.T., Khan, Z.A., Iqbal, J., Wasim, A. (2021). Real-time recognition of spraying area for UAV sprayers using a deep learning approach. PloS One, 16(4): e0249436. https://doi.org/10.1371/journal.pone.0249436
[16] Subrahmanyam Vaddi, C.K., Jannesari, A. (2019). Efficient object detection model for real-time UAV applications. arXiv preprint arXiv:1906.00786.
[17] Ucar, F., Korkmaz, D. (2020). COVIDiagnosis-Net: Deep Bayes-SqueezeNet based diagnosis of the coronavirus disease 2019 (COVID-19) from X-ray images. Medical Hypotheses, 140: 109761. https://doi.org/10.1016/j.mehy.2020.109761
[18] Pierezan, J., Coelho, L.D.S. (2018). Coyote optimization algorithm: A new metaheuristic for global optimization problems. In 2018 IEEE Congress on Evolutionary Computation (CEC), pp. 1-8. https://doi.org/10.1109/CEC.2018.8477769
[19] Sayed, G.I., Khoriba, G., Haggag, M.H. (2020). The novel multi-swarm coyote optimization algorithm for automatic skin lesion segmentation. Evolutionary Intelligence, pp. 1-33. https://doi.org/10.1007/s12065-020-00450-4
[20] Pustokhina, I.V., Pustokhin, D.A., Gupta, D., Khanna, A., Shankar, K., Nguyen, G.N. (2020). An effective training scheme for deep neural network in edge computing enabled Internet of medical things (IoMT) systems. IEEE Access, 8: 107112-107123. https://doi.org/10.1109/ACCESS.2020.3000322
[21] http://weegee.vision.ucmerced.edu/datasets/landuse.html.
[22] Yang, Y., Newsam, S. (2010). Bag-of-visual-words and spatial extensions for land-use classification. In Proceedings of the 18th SIGSPATIAL International Conference on Advances in Geographic Information Systems, pp. 270-279. https://doi.org/10.1145/1869790.1869829
[23] Hua, Y., Mou, L., Zhu, X.X. (2019). Recurrently exploring class-wise attention in a hybrid convolutional and bidirectional LSTM network for multi-label aerial image classification. ISPRS Journal of Photogrammetry and Remote Sensing, 149: 188-199. https://doi.org/10.1016/j.isprsjprs.2019.01.015
[24] Qi, K., Guan, Q., Yang, C., Peng, F., Shen, S., Wu, H. (2018). Concentric circle pooling in deep convolutional networks for remote sensing scene classification. Remote Sensing, 10(6): 934-934. https://doi.org/10.3390/rs10060934
[25] Rajagopal, A., Ramachandran, A., Shankar, K., Khari, M., Jha, S., Lee, Y., Joshi, G.P. (2020). Fine-tuned residual network-based features with latent variable support vector machine-based optimal scene classification model for unmanned aerial vehicles. IEEE Access, 8: 118396-118404. https://doi.org/10.1109/ACCESS.2020.3004233