Ahmed Elaraby* | Ayman Taha
© 2021 IIETA. This article is published by IIETA and is licensed under the CC BY 4.0 license (http://creativecommons.org/licenses/by/4.0/).
OPEN ACCESS
In liver medical imaging, physicians always detect, monitor, and characterize liver diseases by visually assessing of liver medical images. Computed Tomographic (CT) imaging is considered as one of the efficient medical imaging modalities in diagnosis of various human diseases. However, imprecise visualization and low contrast are the drawbacks that limit its utility. In this paper, a novel approach of multimodal liver image contrast enhancement is proposed. The idea behind the proposed approach is utilizing MRI scan as guide to exploit the diversity information extracted to enhance the structures in CT modal of liver. The proposed enhancement technique consists of two phases of enhancement to assess local contrast of the input images. In the first phase, the two image modalities are converted to the same range as the range of MRI and CT are different. Then, we did transformation of CT image so that its histogram matches the histogram of MRI. Second, the adaptive gamma correction-based histogram modification is utilized to get enhanced CT image. The subjective and objective experimental results indicated that the proposed scheme generates significantly enhanced liver CT.
medical image, multimodal, image enhancement, liver, CT, MRI
In many diseases, the medical imaging is an important technology to diagnose different organs of human body. Therefore, it is vital part of the diagnosis and treatment. The ever-growing techniques range of medical imaging has enhanced monitoring, diagnosis, and treatment of patients. It is essential to make high quality medical images since poor quality images are considered a core source of diagnostic errors and may negatively affect the diagnosis [1, 2]. The best possible monitoring, diagnosis, and treatment of patients require high quality medical images. Medical images are either seen by medical professionals or processed by computer algorithms. Generally, the quality of medical image is important. The quality of medical image affected by different components through the chain of imaging, from capture stage to visualization stage. These factors include low contrast, blurriness, low sharpness, noise, vignetting/uneven and illumination. They can significantly impact on the medical decisions made by medical professionals, and eventually the patient health.
In processing, the medical images obtained by using different equipment undergo noise and distortion will lead to deterioration of medical image quality [3]. Furthermore, it is hard to criticality analyze deteriorated medical images. As a result, images enhancement is required to improve the diagnosis of medical images. There are various techniques of medical imaging used for analysis of human organs such as “Computed Tomography (CT), Magnetic Resonance Imaging (MRI), Positron Emission Tomography (PET), and X-ray”. However, the low contrast is a fundamental problem, which deteriorates the quality of image. Thus, image enhancement of such images is needed for proper diagnosis. The works in this domain made use of filtering, deblurring, and sharpening the image features such as edges, boundaries, or contrast to prepare image for better analysis [4, 5].
In liver disease, CT imaging remains the most used modality for diagnosis, monitoring, and treatment. It is considered a prerequisite for several clinical applications such as liver surgery planning, Computer Assisted Diagnosis (CAD), treatment planning and post-treatment evaluation. Therefore, the quality of CT scan is vital part. Also, high accuracy for liver and liver tumor volume de-termination is necessary for “Selective Internal Radiation Therapy” (SIRT) planning and reducing the risk of insufficient or excess radiation dose. The need for proper approaches is further underlined by the fact that liver cancer is amongst top cancers with the most fatalities.
In medical liver imaging, doctors usually detect, characterize, and control diseases by evaluating medical images. Sometimes, this visual assessment, based on knowledge and experience, may be inaccurate. Therefore, automatic segmentation of liver tumors has been of interest for several researchers. Because the manual delineation of these tumors is time-consuming, and the segmentation is reliant on the operator [6]. To the best of our knowledge, only interactive methods achieved acceptable results for segmenting liver lesions. There are several challenges encourage researchers to develop automatic segmentation algorithms to segment liver lesions in contrast-enhanced abdominal CT scans [7].
Liver MRI as a powerful tool for assessing chronic liver diseases and detecting focal liver lesions has many limitations, such as inconsistent image quality and reduced reliability associated with long acquisition time, motion artefact, and multiple breath delays. Computed tomographic imaging is considered one of the most efficient medical imaging modalities in diagnosis of different diseases of human. However, imprecise visualization and low contrast are the drawbacks that limit its utility. CT is preferred over other image modalities owing to better ability to capture structures of bone, low cost, and its quick acquisition time. Regarding human liver, certain vessels are clearly manifested in CT modality, while few structures like tumors are clearly visualized in MR modality. An enhanced image can be obtained if information from multiple imaging modalities such as MR and CT is combined. There are a few published works on the combination of multiple modalities or images for enhancement [8-10]. The conception of multi-modality guided contrast enhancement exploits complimentary information from individual modalities to reconstruct a new enhanced image. This obtained image exhibits better visibility of the structures by affecting adequate contrast for different areas and enhance the liver anatomy details. In this paper, we propose a technique to enhance contrast of liver CT modality using its corresponding MR modality. Subjective and quantitative assessment of the proposed technique using different evaluation methods is presented.
The main purpose of the proposed approach is to enhance the contrast of liver CT to show details of liver. CT scans of liver often exhibit low contrast. For enhancement, corresponding high contrast regions of liver MR image is employed. The datasets for our experimental consists of Liver CT and MRI Liver as DICOM format. CT and MRI images are converted to the same range. We convert the two image modalities (CT, MRI) to the same rang, and this process done using MATLAB functions. After that, we did transformation of CT image so that its histogram matches the histogram of MRI using MATLAB functions. Then the histogram of CT liver image is adjusted to match histogram of reference MRI image liver. After that, we utilize the histogram modification based adaptive gamma correction approach for enhancing the obtain CT liver. Flowchart of the proposal framework is shown in Figure 1.
Figure 1. Flowchart of the proposal framework
Among different contrast enhancement techniques, histogram processing approach is the most popular. However, this approach often fails in obtaining satisfactory results for specific images class. There are mainly three distortion types: brightness saturation, noise artifacts and losing of details. So, a good histogram modification approach can handle the problem caused by histogram spikes & pits [11-17]. Good solution to this issue is input histogram modification while preserving the shape features of the original image to the range that the output histogram is as close as possible to a uniform histogram.
The most common approach for image quality enhancement evaluation is the Shannon or Discrete Entropy (DE) computed from the image histogram. DE of an image I is defined as:
$D E(I)=-\sum_{\forall x} \mathrm{P}(\mathrm{x}) \log (\mathrm{P}(\mathrm{x}))$ (1)
where, P(x) is “Probability Density Function (PDF)” which is defined as:
$P(x)=\frac{h_{i}(x)}{N}, x=0,1, \ldots, X-1$ (2)
where, $h_{i}(x)$ is number of pixels with gray-level x, and N is total pixel number.
Let $h_{i}$ be the input histogram and u the uniform histogram. The goal of the transformation is to get a modified histogram $\breve{h}$ that is as close to u as possible and makes the residual $(\breve{h}-$ $h_{i}$ ) small [18].
$\breve{h}=\arg \min \left\|h-h_{i}\right\|_{2}^{2}+\lambda\|h-u\|_{2}^{2}$ (3)
where, $\breve{h}, h, h_{i}, u \in R^{X \times 1}, \lambda \in[0,+\infty]$ is an adjustable parameter.
The solution of Eq. (3) is:
$\breve{h}=\frac{1}{1+\lambda} \times\left(h_{i}+\lambda u\right)$ (4)
Gamma correction can be applied on the estimated histogram to avoid histogram spikes as follows:
$H=A h_{j}^{B}$ (5)
where H is the corresponding output histogram, A and B are positive constants.
With 0 < B < 1, different levels of modification can be achieved, and gamma correction can effectively smooth the histogram spikes.
Using the modified histogram of Eq. (4), Eq. (2) can be expressed as:
$\check{P(x)}=\frac{\left(\frac{1}{1+\lambda}\right) \times\left[h_{i}(x)+\lambda u\right]}{\left(\frac{1}{1+\lambda}\right) \sum_{x=0}^{x-1}\quad\left[h_{i}(x)+\lambda u\right]}$ (6)
The fraction of Eq. (6) has common factor ($\frac{1}{1+\lambda}$). Therefore, coefficient in Eq. (4) is redundant for HE-based on contrast enhancement method. In addition, Eq. (4) can be simplified as:
$\check{h}_{l}=h_{i}+\lambda u$ (7)
where, $\check{h}_{l}$ the newly modified histogram.
We can get a new modification scheme that can smooth the target histogram more evenly by combining Eq. (5) and Eq. (7), as:
$h_{m}(x)=A\left(h_{i}(x)+\lambda u\right)^{B}$ (8)
where, $h_{i}(x)$ represents the input histogram and $h_{m}(x)$ is the modified histogram. Parameter x represents the input gray-level on grayscale $[0, X-1], \gamma \in(0,1]$, and $B \in[0,+\infty), A$ is a constant which is usually set to 1.
Notice that by setting ($\delta=\lambda u$), Eq. (8) is simplified as:
$h_{m}(x)=A\left(\left(h_{i}(x)+\delta\right)^{B}\right)$ (9)
where, $\delta$ is within range $[0,+\infty]$ and defined as:
$\delta=\sqrt{\frac{1}{x} \sum_{x=0}^{x-1}\left[h_{i}(x)-\check{u}\right]^{2}}$ (10)
The adaptive $\gamma$ can be chosen as:
$\gamma=\frac{(128-\mu)}{128}$ (11)
where, $\mu$ is the mean brightness of the processed image.
In our approach, we justify $\mu$ parameter, which has been experimentally proven to deliver better brightness and contrast for most liver images when ($\mu$ =40), hence $\gamma$ is around (0.68). Figure 2 shows the schematic overview of proposed approach.
Figure 2. Schematic overview of proposed methodology
It is well known that measuring image enhancement is not an easy task. Some objective measures have been proposed for this purpose [19]. However, they give partial information of the enhancement on the image. Two performance measures; Naturalness Image Quality Evaluator (NIQE) [20] and the Absolute Mean Brightness Error AMBE [21] are used to evaluate the performance of the proposed approach. These metrics measure different aspects of the image i.e., image quality, contrast, and brightness preservation, respectively. Nonetheless, it is important to keep in mind that an image could have several artifacts, like mid-gray accumulations, that may compromise the perceptual quality of the image, and still obtain optimum values for these objective measures. Thus, it is desirable to complement the objective assessment with a subjective one, to accurately evaluate image quality enhancement methods.
The objective evaluation metrics, which are most used are “Absolute Mean Brightness Error (AMBE)” and “No reference image quality assessment (NIQE)”. The high perceptual quality indicated by low score value.
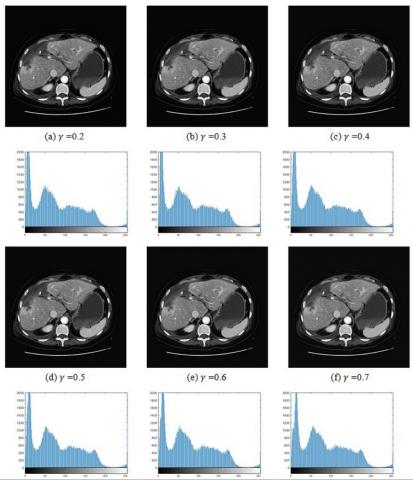
Figure 3. The experimental results of enhanced liver CT and its histograms
The enhancement results of proposed approach with various values of $\gamma$ is presented in Figure 3. However, Table 1 shows the objective evaluation AMBE and NIQE of the experimental results where the best is boldfaced and underlined. Moreover, the Mean Opinion Score (MOS) of the experimental results is show in Table 2, where the best result is boldfaced and underlined. In these measures, the lower value is better than higher value. It was observed that enhanced CT liver visual quality is better as shown in the Figure 2(e) where ($\gamma$=0.6) using NIQE and Figure 3(f) where (γ=0.7) using AMBE that is applicable for objective results as indicated in Table 1. During the subjective evolution by 15 observers, we do not encounter any outliers or bad observers. Furthermore, the evaluation is consistent with the opinion of medical doctor because we include one evaluation of expert medical doctor, and he ranked the best result as Figure 2(e). To the best of our knowledge, there is no similar approach that employs MRI scan as guide to enhance CT images. Therefore, the future work is to extend this technique to include more experimental and combine deep learning approach to select best parameters for different medical images.
Mean Opinion Score (MOS):
$M O S=\frac{\sum_{n=1}^{N} R_{n}}{N}$ (12)
where, R are the individual ratings for a given stimulus by N subjects.
Table 1. AMBE and NIQE of the experimental results
|
Images |
AMBE |
NIQE |
|
Original CT Liver |
- |
6.9478 |
|
Enhanced CT liver ($\gamma=0.2$) (a) |
28.0222 |
4.1504 |
|
Enhanced CT liver ($\gamma=0.3$) (b) |
27.2876 |
4.1839 |
|
Enhanced CT liver ($\gamma=0.4$) (c) |
27.2625 |
4.1835 |
|
Enhanced CT liver ($\gamma=0.5$) (d) |
26.7141 |
4.2405 |
|
Enhanced CT liver ($\gamma=0.6$) (e) |
26.1747 |
4.1364 |
|
Enhanced CT liver ($\gamma=0.7$) (f) |
25.4527 |
4.3116 |
Table 2. Mean Opinion Score (MOS) of experimental results
|
Observer |
Ranking [1:5] [1: Bad– 2: Poor – 3: Fair – 4: Good–5: Excellent] |
|||||
|
(a) |
(b) |
(c) |
(d) |
(e) |
(f) |
|
|
1 |
4 |
5 |
4 |
4 |
5 |
5 |
|
2 |
3 |
4 |
3 |
3 |
4 |
3 |
|
3 |
3 |
3 |
4 |
5 |
3 |
4 |
|
4 |
3 |
4 |
3 |
3 |
5 |
3 |
|
5 |
4 |
4 |
4 |
4 |
4 |
4 |
|
6 |
5 |
3 |
4 |
4 |
5 |
5 |
|
7 |
3 |
3 |
3 |
3 |
3 |
3 |
|
8 |
4 |
4 |
4 |
3 |
5 |
4 |
|
9 |
4 |
3 |
3 |
4 |
4 |
3 |
|
10 |
4 |
4 |
4 |
5 |
3 |
4 |
|
11 |
5 |
3 |
5 |
4 |
3 |
4 |
|
12 |
3 |
4 |
3 |
5 |
4 |
4 |
|
13 |
3 |
5 |
4 |
3 |
5 |
3 |
|
14 |
5 |
4 |
3 |
4 |
4 |
4 |
|
15 |
4 |
4 |
5 |
3 |
4 |
5 |
|
MOS |
3.8 |
3.8 |
3.73 |
3.8 |
4.066 |
3.866 |
A multimodality guided enhancement approach of liver is introduced in this paper. The technique focuses on contrast improvement of liver CT. In the domain of medical imaging, such multimodality guided enhancement techniques have not been proposed to the best of our knowledge. The experimental results show that the proposed approach gives better results and highlights fine details of liver CT. Image quality assessment and contrast assessment matrix NIQE, AMBE demonstrates its effectiveness. The future extension of this work might include deep learning approach to select best parameters for different medical images.
[1] Cleary, K., Peters, T.M. (2010). Image-guided interventions: Technology review and clinical applications. Annual Review of Biomedical Engineering, 12: 119-142. https://doi.org/10.1146/annurev-bioeng-070909-105249
[2] Elaraby, A., Elansary, I. (2021). A framework for multi-threshold image segmentation of low contrast medical images. Traitement du Signal, 38(2): 309-314. https://doi.org/10.18280/ts.380207
[3] Elaraby, A., Moratal, D. (2017). A generalized entropy-based two-phase threshold algorithm for noisy medical image edge detection. Scientia Iranica, 24(6): 3247-3256. https://dx.doi.org/10.24200/sci.2017.4359
[4] Gonzalez R.C., Woods R.E. (2006). Digital Image Processing. Upper Saddle River: NJ, USA: Prentice-Hall.
[5] Elaraby, A.E., Nechaevskiy, A.V.E. (2021). An effective segmentation approach for liver computed tomography scans using fuzzy exponential entropy. Компьютерные исследования и моделирование, 13(1): 195-202. https://doi.org/10.20537/2076-7633-2021-13-1-195-202
[6] Al-Ameen, Z. (2020). Satellite image enhancement using an ameliorated balance contrast enhancement technique. Traitement du Signal, 37(2): 245-254. https://doi.org/10.18280/ts.370210
[7] Liver Tumor Segmentation Challenge, https://competitions.codalab.org/competitions/17094, accessed on January 5, 2021.
[8] Zhang, X., Sim, T., Miao, X. (2008). Enhancing photographs with near infra-red images. 2008 IEEE Conference on Computer Vision and Pattern Recognition Anchorage, Alaska, USA, pp. 1-8. https://doi.org/10.1109/CVPR.2008.4587825
[9] Yan, Q., Shen, X., Xu, L., Zhuo, S., Zhang, X., Shen, L., Jia, J. (2013). Cross-field joint image restoration via scale map. Proceedings of the IEEE International Conference on Computer Vision, Sydney, Australia, pp. 1537-1544. http://dx.doi.org/10.1109/ICCV.2013.194
[10] Zhuo, S., Zhang, X., Miao, X., Sim, T. (2010). Enhancing low light images using near infrared flash images. 2010 IEEE International Conference on Image Processing, Hong Kong, China, pp. 2537-2540. https://doi.org/10.1109/ICIP.2010.5652900
[11] Shen, X., Zhou, C., Xu, L., Jia, J. (2015). Mutual-structure for joint filtering. Proceedings of the IEEE International Conference on Computer Vision, Santiago, Chile, pp. 3406-3414. https://doi.org/10.1109/ICCV.2015.389
[12] Arici, T., Dikbas, S., Altunbasak, Y. (2009). A histogram modification framework and its application for image contrast enhancement. IEEE Transactions on Image Processing, 18(9): 1921-1935. https://doi.org/10.1109/TIP.2009.2021548
[13] Agaian, S.S., Silver, B., Panetta, K.A. (2007). Transform coefficient histogram-based image enhancement algorithms using contrast entropy. IEEE Transactions on Image Processing, 16(3): 741-758. https://doi.org/10.1109/TIP.2006.888338
[14] Tsai, C.M. (2013). Adaptive local power-law transformation for color image enhancement. Applied Mathematics & Information Sciences, 7(5): 2019-2026. http://dx.doi.org/10.12785/amis/070542
[15] Huang, S.C., Cheng, F.C., Chiu, Y.S. (2012). Efficient contrast enhancement using adaptive gamma correction with weighting distribution. IEEE Transactions on Image Processing, 22(3): 1032-1041. https://doi.org/10.1109/TIP.2012.2226047
[16] Lee, C., Lee, C., Kim, C.S. (2013). Contrast enhancement based on layered difference representation of 2D histograms. IEEE Transactions on Image Processing, 22(12): 5372-5384. https://doi.org/10.1109/TIP.2013.2284059
[17] Huang, S.C., Yeh, C.H. (2013). Image contrast enhancement for preserving mean brightness without losing image features. Engineering Applications of Artificial Intelligence, 26(5-6): 1487-1492. https://doi.org/10.1016/j.engappai.2012.11.011
[18] Wang, X., Chen, L. (2017). An effective histogram modification scheme for image contrast enhancement. Signal Processing: Image Communication, 58: 187-198. https://doi.org/10.1016/j.image.2017.07.009
[19] Panetta, K.A., Wharton, E.J., Agaian, S.S. (2008). Human visual system-based image enhancement and logarithmic contrast measure. IEEE Transactions on Systems, Man, and Cybernetics, Part B (Cybernetics), 38(1): 174-188. https://doi.org/10.1109/TSMCB.2007.909440
[20] Chen, S.D., Ramli, A.R. (2003). Minimum mean brightness error bi-histogram equalization in contrast enhancement. IEEE Transactions on Consumer Electronics, 49(4): 1310-1319. https://doi.org/10.1109/TCE.2003.1261234
[21] Mittal, A., Soundararajan, R., Bovik, A.C. (2012). Making a “completely blind” image quality analyzer. IEEE Signal Processing Letters, 20(3): 209-212. https://doi.org/10.1109/LSP.2012.2227726