Shivali Amit Wagle | Harikrishnan R* | Jahariah Sampe | Faseehuddin Mohammad | Sawal Hamid Md Ali
© 2021 IIETA. This article is published by IIETA and is licensed under the CC BY 4.0 license (http://creativecommons.org/licenses/by/4.0/).
OPEN ACCESS
The paper discusses disease identification and classification in tomato plants, as well as the effect of data augmentation in deep learning models. The database used here is Tomato plant leaves (TPL) images from the PlantVillage Database in the healthy and disease classes. The disease categories have been chosen depending on their occurrence in the Indian States. The proposed ResNet50, ResNet18, and ResNet101 deep-learning model with transfer learning combined with the softmax classification are used to identify and categorize the tomato leaf images into the healthy or diseases classes in the dataset. The unique combination of including the noise and blur in the images and position and color data augmentation makes the dataset robust. Two different data augmentation methods are used for the classification problem, and significant improvement is seen in the classification accuracy with the proposed augmented dataset. The model’s success rate makes the model helpful in extending support in validating a model for identifying plant disease. The validation of models is done on PlantVillage and images taken at Krishi Vigyan Kendra Narayangaon, Pune, India. ResNet101 model trained with augmented dataset outperforms the testing accuracy of 99.99% and validation accuracy of 95.83%.
classification, data augmentation, ResNet models, validation
There is an increasing demand for good quality food as the population grows across the globe. The farmers should take steps to protect the farm from the disease that can be prevented if the cause of the disease is known in advance. Also, the plant yield is salient in terms of the amount of product through the yield. The seasonal changes and weather conditions also cause plants to be prone to certain diseases. The disease can significantly reduce the quality and amount of the plants' yield. The earlier techniques used on a farm to protect the plants from the disease were practically examining the farm by experts. These were expensive and time-consuming methods [1, 2]. The diagnosis of diseases by the experts due to the sizeable cultivating area that they have to inspect and treat the plants accordingly may not be sufficient to save the plant or reduce the diseases in them [3]. As a part of the concern, the farmers followed the steps to spray pesticides or chemical fertilizers to get rid of diseases. However, this harms the crop and the person in contact with it.
The current techniques are more potent with the computational system of image processing and machine learning, which can detect and diagnose the disease caused to the plants [4, 5]. Deep learning networks are unmanned methods that can classify plant leaves. These techniques reduce many manual operations and save time with the help of these techniques [6]. It is all dependent on how badly the disease affects the crop leaves. In this study, diseases of the tomato plant from the PlantVillage dataset [4] with a disease in Indian states and a healthy class are chosen for analysis. The TPL images with nine classes consisting of Healthy (H) and disease classes of “Bacterial Spot (BS), Early Blight (EB), Late Blight (LB), Leaf Mold (LM), Mosaic Virus (MV), Septoria Leaf Spot (SLS), Target Spot (TS), and Yellow Leaf Curl Virus (YLCV)” are considered in this work. A deep learning model, ResNet50, ResNet18, and ResNet101, is applied to classify the leaf plant.
The paper is organized in the following sequence with Related Works is in section 2; section 3 discusses the Proposed Work using deep learning models of ResNet50, ResNet18, and ResNet101 with the effect of data augmentation with position and color augmentation. Section 4 provides the results and discussion, followed by a Conclusion in Section 5.
The introduction to the deep learning model techniques in classification and detection was introduced by LeCun et al. [7] with the primary deep learning tool of Convolutional Neural Networks (CNNs). The deep learning models are being used in agriculture to a limited extent in recent years. CNNs is a dynamic model that helps classify applications with a large amount of data. There are various CNNs models like AlexNet [8], GoogLeNet [9], ResNet50, ResNet18, ResNet101 [10], VGG 16, VGG 19 [11], DenseNet [12], SqueezeNet [13] etc. for classification. The difference is the layer shallowness and the nonlinear functions in the networks. DenseNet has feedforward layers, while ResNet has many residual blocks, The squeeze layer in SqueezeNet is inside the Fire module, and SqueezeNet contains several of them. The structure consists of four significant layers viz. "convolution layer," "pooling layer," "fully connected layer," and the "output layer."
He et al. [10] conferred a residual network (ResNet) that skips connections between ReLU and normalization layers. This helps proficiently with the deeper learning models. Their use of batch normalization or their use of shortcut connections is among the possible reasons for the strength of ResNet50 [14]. Transfer learning has the ability to use the pre-trained network and modify some of the parts of it as per the need for work [15]. Mehra [16] used pre-trained VGG 16, VGG 19, and ResNet50 for histopathological images in breast cancer detection. The performance of the VGG16 network was best amongst the other networks, with an accuracy of 92.60% and an average precision score of 95.95%. Da Nóbrega et al. [17] compared deep learning models of "VGG16", "VGG19", "MobileNet", "Xception", "InceptionV3", "ResNet50", "Inception-ResNet-V2", "DenseNet169", "DenseNet201", "NASNetMobile" and "NASNetLarge" in the lung cancer detection and found that ResNet50 outperformed with 88.41% accuracy. The malware software classification approach by Rezende et al. [18] used ResNet50 for 9339 of sample data attained 98.62% accuracy. The fine-tuned CNN outperforms the traditional handcrafted feature extraction methods in classifying the three classes of gastric lesions. ResNet50 achieves an accuracy of 96% [19]. Salama and Aly [20] obtained an accuracy of 98.87% with the U-Net model and InceptionV3 with the data augmentation for the breast cancer classification. Data augmentation influences the average precision of the class [21-23]. In the classification of mixed gases, Han et al. [24] used VGG16, VGG19, ResNet18, ResNet34, and ResNet50 and achieved an accuracy of 96.67% with the adjustment of parameters. Their work compares the classification of lumbar images of four different datasets with ResNet18 by Hu et al. [25]. The authors compared the ResNet18 results with pre-trained networks and found that the accuracy increases in pre-trained networks with transfer learning.
The tomato plant fruit disease was categorized by Wang and Qi [26] with VGG16 and two ResNet models of ResNet50 and ResNet101 into healthy and disease cases with a mean average precision of 90.87% from ResNet101. In their work, Mukti and Biswas [27] used transfer learning for the deep learning model of AlexNet, VGG16, VGG19, and ResNet50 to classify images of plant leaves and have got an accuracy of 99.8% with the ResNet model. Verma et al. [28] compared AlexNet and ResNet18 in classifying the three stages of disease in a grape plant from the PlantVillage database. The performance was measured in accuracy, precision, recall, F1 score, validation loss, and ROC curves. ResNet18 performed better than AlexNet, with an accuracy of 86.43%. Rangarajan Aravind and Raja [29] used six different deep learning models in classifying ten classes of four varieties of plants. The authors achieved the highest accuracy of 97.3% with GoogLeNet compared to AlexNet, VGG16, VGG19, ResNet101, and DenseNet201. Jadhav [30] have classified soybean disease with the deep learning networks of AlexNet, GoogLeNet, VGG16, ResNet101, and DensNet201. In their work, GoogLeNet and VGG16 attained the highest accuracy of 96.4% compared to the other networks. The models here are trained with 80% of the data, and over 20% are tested. Brahimi et al. [31] achieved an accuracy of 98.66% for AlexNet and 98.18% for the VGG16 model with the augmented dataset consisting of 14828 images of tomato leaves. Zhang et al. [32] achieved an accuracy of 97.28% for the ResNet model for TPL classification. Rangarajan et al. [33] used AlexNet and VGG16 to classify Tomato plant disease, achieving accuracy of 97.49% and 97.29%, respectively. The attention-based Residual CNN model achieved an accuracy of 98% for TPL [34]. Table 1 compares the work of ResNet models in classification tasks in diverse domains such as medicine, agriculture, software, etc.
Table 1. Comparative study of the related work of ResNet models in classification task
|
Ref No |
Model |
Accuracy |
Database |
Objective |
Challenges/Future scope |
|
[16] |
VGG16, VGG 19, ResNet50 |
92.20% 89.50% 78.90% |
Medical images |
Breast cancer detection |
More data augmentation methods can be applied to achieve more accuracy |
|
[17] |
ResNet50 |
88.41% |
LIDC/IDRI dataset |
Lung cancer detection |
Apply a training strategy and finetune model for better features. |
|
[18] |
ResNet50 |
98.62% |
ImageNet |
Malicious Software Classification |
|
|
[19] |
ResNet50 |
96% |
Gastric M-NBI images |
Pre-trained CNN tuning for classification of gastric M-NBI images |
Develop a deep CNN for M-NBI images in order to identify or locate gastric injuries and to build a future gastric disease NBI image database. |
|
[21]
[22] |
ResNet50
VGG16 |
85.98% average precision 96.25% average precision |
Own dataset |
Identification of Tomato plant disease. |
Improving the current results for detection of disease. |
|
[24] |
VGG-16 VGG-19 Resnet18 Resnet34 Resnet50 |
63.33% 60% 90% 93.33% 96.67% |
UCI public data set |
Identification of mixed gases |
In the event of small samples, improve the accuracy |
|
[25] |
ResNet |
84.43% |
Own dataset |
Lumber classification tasks in wood |
To build an online wood-board grading system |
|
[26] |
VGG16 ResNet50 ResNet101 |
88.28% 89.53% 90.87% |
Internet images |
Detect tomato disease types |
Improve the network structure to improve detection accuracy |
|
[27] |
AlexNet VGG16 VGG19 ResNet50 |
83.66% 91.75% 94.96% 99.80% |
PlantVillage |
Tomato plant disease classification |
Develop a mobile App for |
|
[28] |
AlexNet ResNet18 |
87.21% 85.66% |
PlantVillage |
Identifying disease severity |
To achieve more accuracy |
|
[30] |
AlexNet GoogleNet VGG16 ResNet101 DensNet201 |
95.0% 96.4% 96.4% 92.1% 93.6% |
PlantVillage |
Classification of soyabean plant disease |
To increase the performance rate, develop our own CNN model |
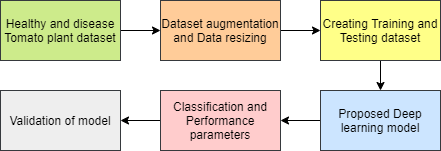
The work proposed in this paper discusses the effect of the augmented dataset on Tomato plant disease classification with the pre-trained ResNet50, Resnet18, and ResNet101 models. Figure 1 depicts the proposed deep learning model for the classification of disease in tomato plant TPL. As there are nine classes for TPL classification, transfer learning is employed with nine fully connected output layers. After the classification, the model will be validating the data that is not part of training or testing data. The validation is done on images from PlantVillage and Krishi Vigyan Kendra Narayangaon (KVKN).
Figure 1. Workflow for the proposed work on using ResNet models to classify TPL
3.1 Dataset of TPL
PlantVillage dataset consists of 38 classes of healthy and diseased leaves images of different plants. The dataset used in this work is TPL images [4]. The work focuses only on classifying TPL of healthy and eight disease classes. Tomato “BS, EB, LB, LM, MV, SLS, TS, and YLCV” are among the eight diseased leaf classes in Indian states, and H are chosen for classification purposes.
3.2 Dataset augmentation and data resizing
The basic steps common throughout [35] are necessary for the smooth operation and uniform analytical functioning of any algorithm, and pre-processing is one of them. Deep learning behaves great when the input dataset is as large as possible. The minute, invisible to human eye changes like adding noise and blur to the input images can help CNNs learn more robust features [36, 37]. Our method proposes a unique combination of noise, blurred images, position, and color data augmentation to increase the robustness of the dataset. More information can be extracted from the original dataset through augmentations. In position augmentation, the pixel positions of the image are changed by rotation, scaling, and flipping. Color augmentation transforms the color features of the image by changing its pixel values by hue, saturation, and contrast. Hue helps in describing the shade of the color in an image. Saturation is the division of an image into color. The contrast is the degree to which the darkest and brightest areas of an image separate themselves.
In this work, the dataset is augmented with the gaussian blur, salt and pepper noise with randomized scaling of 0.95 to 1.05 in a horizontal and vertical direction, and random rotation in the range -30° to 30° of the images. The combination of augmentation used is shown in Table 2. The other augmentation done here is with the rotation and flipping of the dataset with healthy and disease classes. In position augmentation, images are flipped horizontally and vertically and rotated with an angle of 45°, 135°, 225°, and 315°; flipping horizontal and vertical way along with color augmentation of saturation, hue, and contrast. Now this augmented dataset is a combination of the methods mentioned above and, the size of the dataset is 94500 images. The deep learning network used in this work is ResNet50, ResNet18, and ResNet101. The input images are resized for these networks to the size 224×224×3 from the original size of 256×256×3.
Table 2. The dataset augmentation combination
|
Augmentation 1 (augdata1) |
||||
|
Noise |
Salt and pepper noise |
|
|
|
|
Blur |
Gaussian blur |
|
|
|
|
Position augmentation |
Random scaling |
Random rotation |
|
|
|
Augmentation 2 (augdata2) |
||||
|
Position augmentation |
45° Rotation |
135° Rotation |
225° Rotation |
315° Rotation |
|
Horizontal flip |
Vertical flip |
|
|
|
|
Color augmentation |
Hue |
Saturation |
Contrast |
|
3.3 Creating training and testing dataset
The deep learning model has two parts: training the model and testing the model. Aforementioned, the dataset is divided into a training dataset and a testing dataset. The training-testing dataset with 60-40, 70-30, 80-20, and 90-10 combinations reveals the first number of the size of training dataset and the second number of the size of testing dataset in percent. The training parameters of the model, like mini-batch size, learning rate, and a number of epochs, are kept the same for all the networks with a different combination of data. These parameters are kept the same to maintain the uniformity for the comparison of the model’s performance.
3.4 Deep learning model
Deep learning models are more intricate types of primary neural networks. The number of hidden layers in the deep learning model was enhanced compared to typical neural networks. The convolution, max-pooling, ReLU, and classification layers are the four layers that make up a CNN [38] The combination of these layers determines the model's design. Deep learning aids in the extraction of needed features from the input image [39]. It has a high level of accuracy and can solve complicated issues quickly. The model's accuracy can be improved by modifying the layers and how they are combined in the model. The dimensionality of retrieved features is lowered with the help of a pooling layer [40]. The fully connected layer is a dense network wherein every node is connected to every other node. It is connected prior to the classification layer and divides the input image into pre-determined groups or classes to predict the output. Deep learning networks have been widely used in numerous areas due to their promising results [41, 42]. The ResNet model has fewer filters than VGG nets and less complexity. ResNet18 model has 11M parameters compared to VGG16 having 138M parameters. In the proposed work, the classification of TPL for nine classes is done. Transfer learning is implemented by replacing the last three layers of the pre-trained ResNet models with a fully connected layer, softmax classifier layer. This work implements all the models using a deep learning toolbox in MATLAB 2019b.
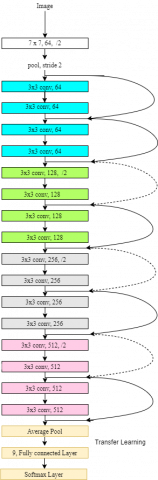
ResNet models can achieve a compelling performance by making it possible to train up to hundreds or even thousands of layers. This representational ability is potent in many computer vision application's performances. The accuracy is greatly enhanced, and the ability to solve complex tasks using ResNet. ResNet attempts to solve deep CNN training, saturation, and accuracy degradation problems. Table 3 shows the architecture of ResNet18, ResNet50, and ResNet101 briefly. Figure 2 shows the proposed ResNet18 architectural model with transfer learningResNet18 is the term referring to a network with 18 layers of a residual network. The first layer has 64 filters with a kernel size of 7×7. Then max-pooling is done by a 3×3 size layer and stride 2. Then there is a group of layers consisting of four similar blocks. The first group consists of 64 filters of 3×3 size, the second group is of 128 filters of 3×3 size, the third group consists of 256 filters of 3×3 size, and the fourth group consists of 512 filters of 3×3 size. The curved lines mean the identity block that connects two layers of different sizes. The dotted shortcuts increase dimensions. Finally, they are connected to nine fully connected layers for classification purposes. The ResNet50 and ResNet101 models are similar to the description from Table 3.
Figure 2. The architecture model of proposed ResNet18 model with transfer learning
Table 3. The architecture of ResNet models [10]
|
Layer name |
Output size |
18 Layer |
50 Layer |
101 Layer |
|
Conv1 |
112 X 112 |
7 X 7, 64, stride 2 |
||
|
Conv2 |
56 X 56 |
3 X 3, max pool, stride 2 |
||
|
|
|
$\left[\begin{array}{lll}3 & \times & 3,64 \\ 3 & \times & 3,64\end{array}\right] \times 2$ |
$\left[\begin{array}{c}1 \times 1,64 \\ 3 \times 3,64 \\ 1 \times 1,256\end{array}\right] \times 3$ |
$\left[\begin{array}{c}1 \times 1,64 \\ 3 \times 3,64 \\ 1 \times 1,256\end{array}\right]\times3$ |
|
Conv3 |
28 X 28 |
$\left[\begin{array}{l}3 \times 3,128 \\ 3 \times 3,128\end{array}\right] \times 2$ |
$\left[\begin{array}{l}1 \times 1,128 \\ 3 \times 3,128 \\ 1 \times 1,512\end{array}\right] \times 4$ |
$\left[\begin{array}{l}1 \times 1,128 \\ 3 \times 3,128 \\ 1 \times 1,512\end{array}\right] \times 4$ |
|
Conv4 |
14 X 14 |
$\left[\begin{array}{l}3 \times 3,256 \\ 3 \times 3,256\end{array}\right] \times 2$ |
$\left[\begin{array}{c}1 \times 1,256 \\ 3 \times 3,256 \\ 1 \times 1,1024\end{array}\right] \times 6$ |
$\left[\begin{array}{ccc}1 & \times 1,256 \\ 3 & \times 3,256 \\ 1 & \times 1,1024\end{array}\right] \times 23$ |
|
Conv5 |
7 X 7 |
$\left[\begin{array}{l}3 \times 3,512 \\ 3 \times 3,512\end{array}\right] \times 2$ |
$\left[\begin{array}{c}1 \times 1,512 \\ 3 \times 3,512 \\ 1 \times 1,2048\end{array}\right] \times 3$ |
$\left[\begin{array}{c}1 \times 1,512 \\ 3 \times 3,512 \\ 1 \times 1,2048\end{array}\right] \times 3$ |
|
|
1 X 1 |
Average pool, 9, fc, softmax |
||
The ResNet18, ResNet50, and ResNet101 are pre-trained data networks that classify 1000 classes. Transfer learning is carried out in the last three layers of the network to classify the nine classes in the datasets of the Tomato plant into healthy and disease classes. The input image dataset is augmented and resized to the size required by all of the ResNet models employed here, 224×224×3. All of the networks are trained on four different training datasets, and the model is then put to the test on the testing dataset. The models are trained with the data and the augmented datasets for the training-testing dataset combinations mentioned above. In this model, transfer learning is essential because there are nine output classes to classify. The model is modified with transfer learning by replacing the last three with three layers indicating the number of desired classified outputs, the softmax layer, and the final output layer. The 1000 fully connected layer is replaced by nine fully connected layers before training the models with dataset and augmented datasets.
3.5 Classification and performance parameters
The accuracy and performance of a deep learning model are used to classify it. The three networks are used to classify the healthy and diseased classes, and their accuracy and performance are compared. The confusion matrix (CM) of the test dataset is used to evaluate the performance parameters. The CM displays the classified and misclassified classes in a specific form. Non-diagonal elements are misclassified, but diagonal elements are correctly classified. The following are the components of the CM [43]:
"True Positive (TP): This is the Positive samples that were correctly labeled by the classifier,"
"True Negative (TN):
These are the Negative samples that were correctly labeled by the classifier",
"False Positive (FP): This is the Negative samples that were incorrectly labeled as positive," and
"False Negative (FN): This is the Positive samples that were incorrectly labeled as negative."
The performance parameters evaluated are macro recall, macro precision, macro F1 score, and mean accuracy. Sensitivity/recall is the measure of the model that appropriately detects the positive class and is also known as the true positive rate. The model assigning positive events to the positive class is measured by a positive predictive value, also known as precision. F1 score is the harmonic mean of recall and precision. "Macro recall is an average per class effectiveness of a classifier to identify class labels." "Macro precision is an average per class agreement of the data class labels with those of the classifiers." "Macro F1 score is the relation between data's positive labels and those given by the classifier based on per class average". "Accuracy is the ratio of correct prediction by all predictions."
$Sensitivity = Recall =\frac{\text { True Positive }}{\text { True Positive }+\text { False Negative }}$ (1)
$Macro Recall =\frac{\sum_{n-1}^{C} \text { Sensitivity }}{C}$ (2)
where, C is the number of classes.
$Precision =\frac{\text { True Positive }}{\text { True Positive }+\text { False Positive }}$ (3)
$Macro Precision =\frac{\sum_{n-1}^{C} \text { Precision }}{C}$ (4)
$F 1$ score $=\frac{2 \times \text { Precision } \times \text { Recall }}{\text { Precision }+\text { Recall }}$ (5)
$Macro F1 score =\frac{\sum_{n-1}^{C} F 1 \text { score }}{C}$ (6)
$Accuracy=\frac{\text { True Positive + True Negative }}{\text { True Positive + True Negative + False Positive + False Negative }}$ (7)
The CM is 9×9 because there are nine classes. These parameters can be used to assess the correctness of each class for all models utilized. Each deep learning model's simulation time with four combinations is recorded in seconds.
3.6 Validation of model
The model's performance can be calculated using its testing and validation performance. The ResNet models are validated with the data that is not known to the model. This data is not part of the training data or testing data. The validation data consists of 1080 images of the 120 images of each class from the PlantVillage database. The ResNet models are also validated with the images captured through the phone from Krishi Vigyan Kendra Narayangaon (KVKN), Pune. The validation of the model helps in predicting the unknown data’s class with its accuracy.
The entire analysis is based on a dataset of 10800 photos from the PlantVillage database and an augmented dataset of 94500 images for nine classes of tomato plants. Table 4 provides a summary of the dataset.
Table 4. Summary of dataset in the proposed work
|
Class |
Images in dataset |
Images in augdata1 |
Images in augdata2 |
|
H |
10800 |
10800 |
94500 |
|
BS |
10800 |
10800 |
94500 |
|
EB |
10800 |
10800 |
94500 |
|
LB |
10800 |
10800 |
94500 |
|
LM |
10800 |
10800 |
94500 |
|
MV |
10800 |
10800 |
94500 |
|
SLS |
10800 |
10800 |
94500 |
|
TS |
10800 |
10800 |
94500 |
|
YLCV |
10800 |
10800 |
94500 |
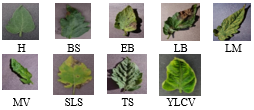
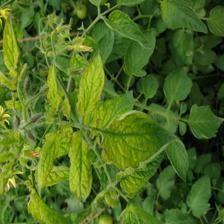
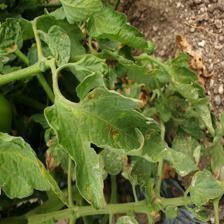
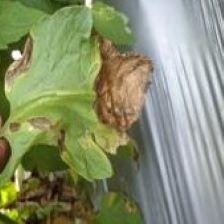
Table 5 shows the number of images in the training and testing datasets for the dataset, augdata1, and augdata2, for four training and testing datasets combinations. Experiments are performed on each combination of training-testing data belonging to dataset augdata1 and augdata2 for the classification task. The TPL with a healthy and diseased class of PlantVillage database for the proposed work is shown in Figure 3.
The training and test data sets have healthy and diseased plant leaves. There are 1200 images from each class of datasets selected for this work. Further, these images are augmented, as shown in Table 2. The classification is done by training the model on various dataset combinations. The training-testing dataset's variation is expressed as a percentage for 60-40, 70-30, 80-20, and 90-10. The combination is used to see the accuracy trend in the classifier. It is seen that at 80% of the training data, all the models are performing well. The model is trained with the training datasets and tested with the testing dataset. For consistency, the hyperparameters of all the proposed ResNet models used here are retained. The learning rate is 0.0001 in all situations, with a mini-batch size of 10 and maximum epochs of 2.
Table 6 compares the proposed work's performance to other existing works. The proposed model of ResNet50, ResNet18 and ResNet101 achieved 98.89%, 97.22%, and 98.10% accuracy with the 10800 images dataset. The accuracy of the model is seen to be increased with augmentation. With augmentation 1, the accuracy is improved without changing the size of the dataset. The performance is further improved with augdata2 applied to the dataset. The proposed ResNet101 model with augdata2 is outperforming with 99.97% accuracy.
Table 5. Training and testing dataset combination used for classification
|
|
|
Number of images |
|||
|
Dataset |
Training-testing data combinaion |
60-40 |
70-30 |
80-20 |
90-10 |
|
data |
Training data |
6480 |
7560 |
8640 |
9720 |
|
Test data |
4320 |
3240 |
2160 |
1080 |
|
|
augdata1 |
Training data |
6480 |
7560 |
8640 |
9720 |
|
Test data |
4320 |
3240 |
2160 |
1080 |
|
|
augdata2 |
Training data |
56700 |
66150 |
75600 |
85050 |
|
Test data |
37800 |
28350 |
18900 |
9450 |
|
Figure 3. Images of TPL from the PlantVillage dataset
Table 6. Comparison of work proposed with other existing works
|
Source |
Model |
Data size |
Accuracy |
|
Brahimi et al. [31] |
AlexNet |
14828 |
98.66% |
|
GoogLeNet |
14828 |
98.18% |
|
|
Rangarajan et al. [33] |
AlexNet |
13262 |
97.49% |
|
VGG16 |
13262 |
97.29% |
|
|
Zhang et al. [32] |
ResNet |
41127 |
97.28% |
|
Karthik et al. [34] |
Attention based Residual CNN |
95999 |
98% |
|
Proposed model |
ResNet50 |
10800 |
98.89% |
|
ResNet18 |
10800 |
97.22% |
|
|
ResNet101 |
10800 |
98.10% |
|
|
ResNet50_augdata1 |
10800 |
99.31% |
|
|
ResNet18_augdata1 |
10800 |
97.82% |
|
|
ResNet101_augdata1 |
10800 |
99.54% |
|
|
ResNet50_augdata2 |
94500 |
99.69% |
|
|
ResNet18_augdata2 |
94500 |
99.90% |
|
|
ResNet101_augdata2 |
94500 |
99.97% |
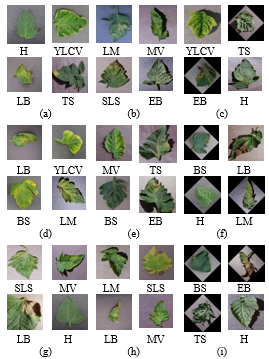
Figure 4 shows the classified images for ResNet models with the dataset and augmented dataset of 80% training data 20% testing data. Figure 4(a) Classified output images for 80% training data using (a)ResNet50 with dataset (b)ResNet50 with augmented dataset1 (augdata1) (c)ResNet50 with augmented dataset2 (augdata2) (d)ResNet18 with dataset (e)ResNet18 with augdata1 (f)ResNet18 with augdata2 (g)ResNet101 with dataset (h)ResNet101 with augdata1 (i)ResNet101 with augdata2.
Figure 4. Classified output images for 80% training data using (a)ResNet50 with dataset (b)ResNet50 with augdata1 (c)ResNet50 with augdata2 (d)ResNet18 with dataset (e)ResNet18 with augdata1 (f)ResNet18 with augdata2 (g)ResNet101 with dataset (h)ResNet101 with augdata1 (i)ResNet101 with augdata2
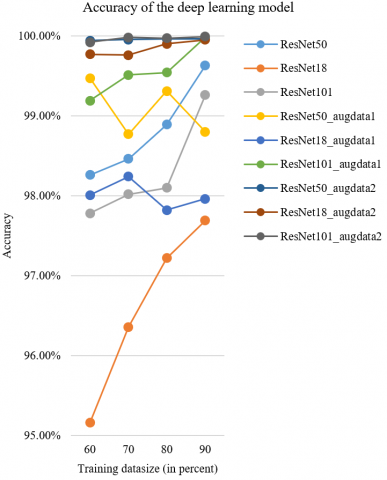
Figure 5 depicts the accuracy of the proposed ResNet models for each combination of training datasets over a testing dataset of 60% -40%, 70%-30%, 80% -20%, and 90% -10%. It's a basic rule that as the amount of the training data grows, so does the accuracy. ResNet18 model is showing a lower accuracy of 95.16% for 60% of training data, and overall, in the classification, the ResNet18 model has lower accuracy than the other two models. When the model is trained with the augmented dataset, the model's accuracy is increased by 2.85% and 4.61%, respectively. ResNet101 shows the highest accuracy of 99.99% when the model is trained with the augdata2. The accuracy of ResNet50 with data is 99.63% and increased to 99.96% with the augmented dataset for 90% of training data. The accuracy of ResNet101 with data is 99.26% and increased to 99.99% with the augmented dataset. The accuracy has increased by 0.33%, 2.69%, and 0.73% with data augmentation. The most effective increase in accuracy is seen in the ResNet18 model with data augmentation. The accuracy of each model for all combinations of training data-testing data appears to be improving with data augmentation. Compared to the other models, the ResNet101 model appears to perform exceptionally well.
The time required for training the deep learning model is also an essential factor. Figure 6 shows that ResNet 50, ResNet18, and ResNet101 have almost the same range of training time when trained with the dataset. The augmented dataset is large and takes longer in training the model, so the training time is more. ResNet18 with data takes 2546 seconds, ResNet50 with data takes 9204 seconds, and ResNet101 with data takes 13437 seconds for 80% of training data. The training time for the augdata1 and augdata2 for the ResNet18 model is 5085 seconds and 44438 seconds; the ResNet50 model is 14581 seconds and 133094 seconds, respectively highest is for the ResNet101 model is 23367 seconds and 227855 seconds for 80% of the training data.
Figure 5. Accuracy performance of the ResNet50, ResNet18, and ResNet101 for different training dataset size and augmented data
Figure 6. Time for training the ResNet50, ResNet18, and ResNet101 for different training dataset size with data and augmented data
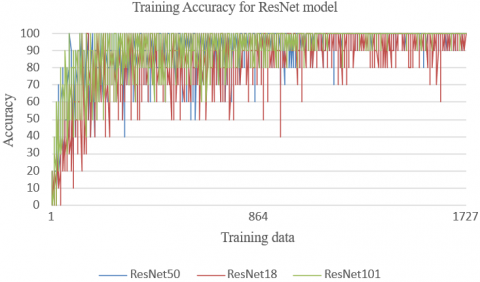
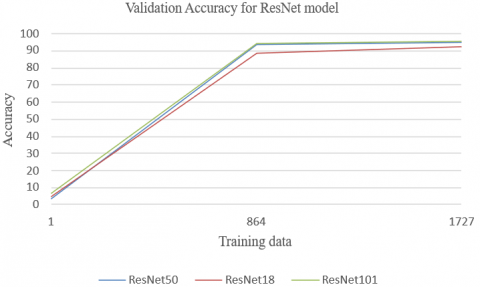
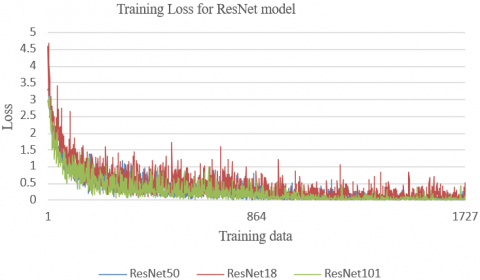
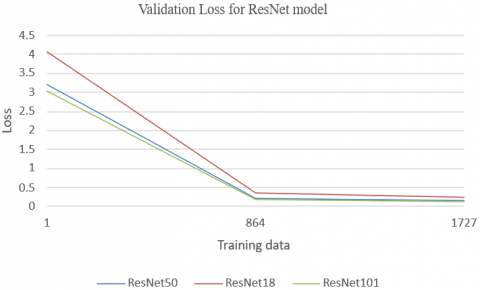
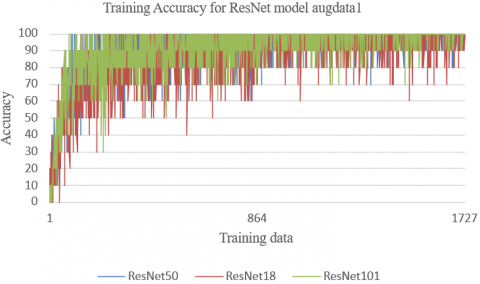
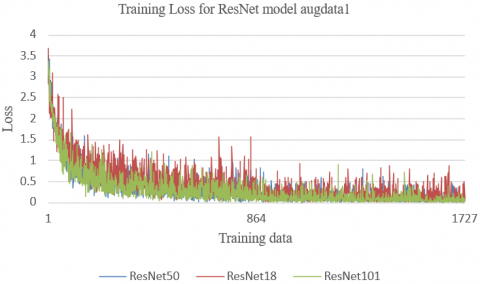
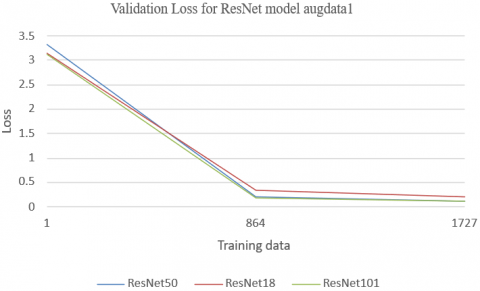
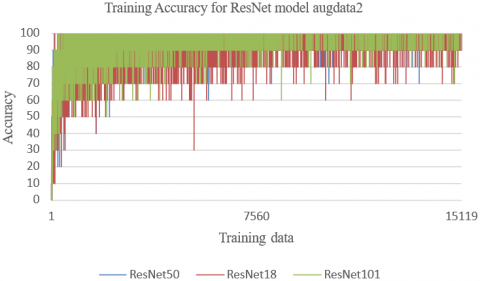
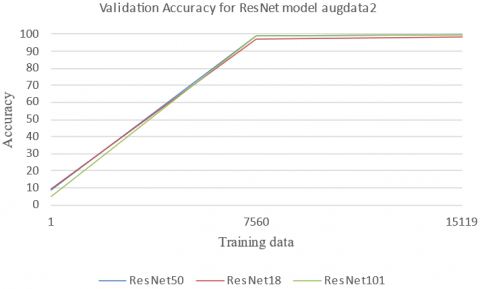
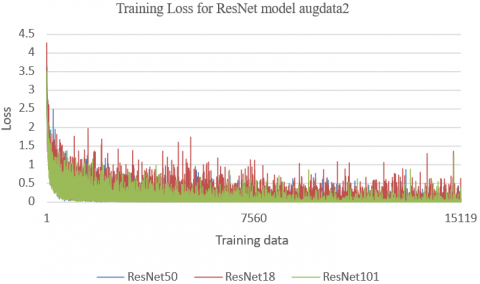
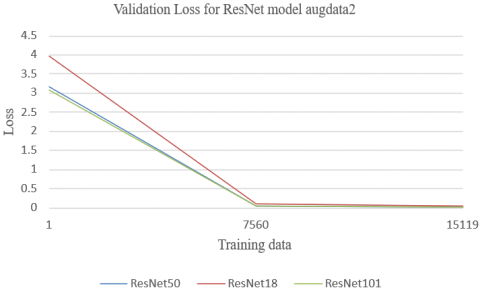
The accuracy and loss in training the model and validation play an essential role in the attainment of the deep learning model. If the training loss is far below the validation loss, the model underfits the data, but if the loss of training is much higher than the loss of validation, the model is over-fit. As the training data increases, the training accuracy must increase, and training loss must go on decreasing, and the same follows for validation accuracy and validation loss. If this scenario is not met, the model is not fitted for the data and will perform poorly. Overfitting occurs when the model fits nicely on the training data but does not generalize well on new, previously unseen data. Overfitting can be avoided by using measures such as data augmentation, model simplification, dropout, regularization, and early stopping [36]. Figure 7 shows the training accuracy, training loss, validation accuracy, and validation loss for the ResNet model and augmented data. The training accuracy and validation accuracy increase with the augmented data and training loss. The validation loss decreases with the augmented dataset, showing that overfitting is prevented in the trained models. ResNet101 performs superior to ResNet50 and ResNet18 in terms of accuracy and loss.
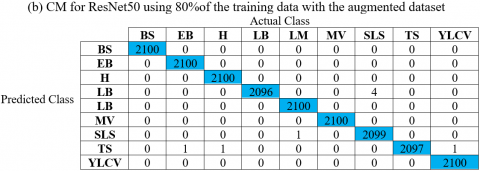
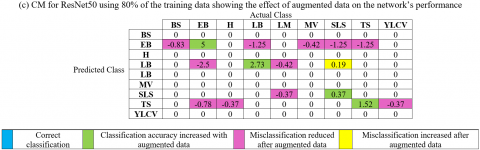
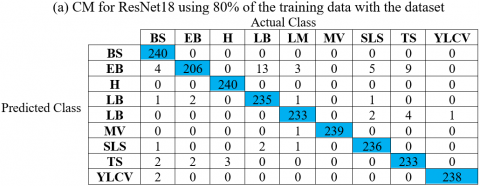
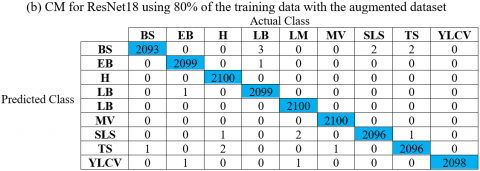
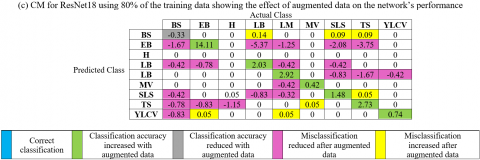
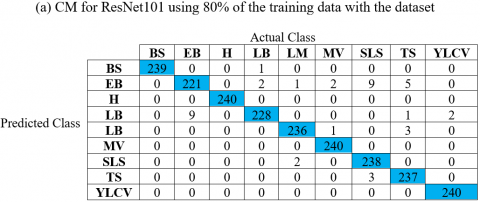
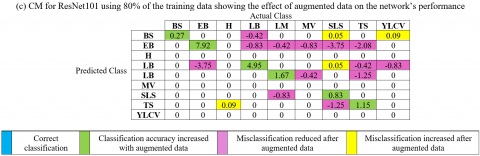
The CM is a matrix that includes information about each class's accurate classification and misclassification. There are nine classes of tomato plants in this work, one of which is healthy and the other is diseased. Table 7 to Table 9 shows the CM for ResNet50, ResNet18, and ResNet101 for 80% of training data, respectively. The classes in the CM are “BS, EB, H, LB, LM, MV, SLS, TS, and YLCV.” The CM for ResNet models with 80% of training data with the model trained with dataset are shown in Table 7(a) ResNet50, 8(a) ResNet18, and 9(a) ResNet101. Here the testing data is 20%, with 240 images of each class. The diagonal elements show the correct classification, and non-diagonal elements show miss classification. Tables 7(b) ResNet50, 8(b) ResNet18, and 9(b) ResNet101 show the CM for ResNet models with 80% of training data and the model trained with augmented dataset. Here the testing data is 20%, with 2100 images of each class. The correct classified classes are marked with blue color.
The effects of data augmentation on classified output of the ResNet models are shown in Table 7(c) ResNet50, 8(c) ResNet18, 9(c) ResNet101. The difference between the augmented dataset and dataset on the ResNet model is calculated here. The elements marked with green color show that the correct classification accuracy has increased, as seen in all three cases. The element marked with gray shows the classification accuracy reduced with augmentation of data. It has only happened once for the ResNet18 model. Misclassification was reduced after data augmentation, as indicated by the elements highlighted in pink. Misclassification is reduced in all three ResNet model classes. The elements marked with yellow color shows misclassification increased after data augmentation. There are very few cases of increase in misclassification.
Table 10 displays the performance parameters for each Tomato plant class for ResNet50, ResNet18, and ResNet101, along with data, augdata1, and augdata2. The performance parameters of macro recall, macro precision, macro F1 score, and mean accuracy are calculated using ResNet models. Brahimi et al. [31] achieved the mean accuracy was 99.18% for GoogLeNet without data augmentation. The proposed ResNet model achieves a mean accuracy of 99.75%, 99.38%, and 99.58% for ResNet50, ResNet18, and ResNet101 respectively. The data augmentation improves the macro recall, macro precision, and macro F1 score. ResNet 101 with augdata2 shows promising results with 99.99% mean accuracy.
The Average Precision (AP) is an important parameter in the detection or classification task, it is the area under the Precision-Recall curve. The AP for the nine classes for ResNet models with data and augmented data is shown in Table 11. It is seen that the AP is increased in all the classes after the augmentation of the data. The AP is increased by 4.17% for augdata1 and 14.12% for augdata2 for class EB. In the case of class TS, the AP is not increased for ResNet50 and ResNet18 model for augdata1 but is increased for augdata2.
(a)
(b)
(c)
(d)
(e)
(f)
(g)
(h)
(i)
(j)
(k)
(l)
Figure 7. Accuracy of training, loss of training, accuracy of validation and validation of loss for ResNet models for the dataset. (e-h) Accuracy of training, loss of training, accuracy of validation and validation of loss for ResNet models for the augdata1. (i-l) Accuracy of training, loss of training, accuracy of validation and validation of loss for ResNet models for the augdata2
Table 7. CM for ResNet50 model
Table 8. CM for ResNet18 model
Table 9. CM for ResNet101 model
Table 10. Performance parameters of nine classes of tomato plant classification using ResNet50, ResNet18 and ResNet101 with data, augdata1 and augdata2
|
Model |
Dataset |
Macro Recall |
Macro Precision |
Macro F1 score |
Mean accuracy |
|
ResNet50 |
data |
98.88% |
98.89% |
98.88% |
99.75% |
|
augdata1 |
99.31% |
99.31% |
99.31% |
99.85% |
|
|
augdata2 |
99.96% |
99.96% |
99.96% |
99.99% |
|
|
ResNet18 |
data |
97.26% |
97.22% |
97.19% |
99.38% |
|
augdata1 |
97.84% |
97.82% |
97.81% |
99.52% |
|
|
augdata2 |
99.90% |
99.90% |
99.90% |
99.98% |
|
|
ResNet101 |
data |
98.11% |
98.10% |
98.09% |
99.58% |
|
augdata1 |
99.54% |
99.54% |
99.54% |
99.90% |
|
|
augdata2 |
99.97% |
99.97% |
99.97% |
99.99% |
Table 11. Influence of data augmentation on average precision of class
|
Class |
ResNet50 |
ResNet18 |
ResNet101 |
||||||
|
data |
augdata1 |
augdata2 |
data |
augdata1 |
augdata2 |
data |
augdata1 |
augdata2 |
|
|
BS |
100.00% |
100.00% |
100.00% |
100.00% |
98.75% |
99.67% |
99.58% |
100.00% |
99.86% |
|
EB |
95.00% |
98.75% |
100.00% |
85.83% |
90.00% |
99.95% |
92.08% |
97.08% |
100.00% |
|
H |
100.00% |
100.00% |
100.00% |
100.00% |
99.58% |
100.00% |
100.00% |
100.00% |
100.00% |
|
LB |
97.08% |
98.33% |
99.81% |
97.92% |
98.33% |
99.95% |
95.00% |
100.00% |
99.95% |
|
LM |
100.00% |
98.75% |
100.00% |
97.08% |
99.17% |
100.00% |
98.33% |
100.00% |
100.00% |
|
MV |
100.00% |
100.00% |
100.00% |
99.58% |
100.00% |
100.00% |
100.00% |
100.00% |
100.00% |
|
SLS |
99.58% |
100.00% |
99.95% |
98.33% |
98.33% |
99.81% |
99.17% |
100.00% |
100.00% |
|
TS |
98.33% |
97.92% |
99.86% |
97.08% |
96.67% |
99.81% |
98.75% |
100.00% |
99.90% |
|
YLCV |
100.00% |
100.00% |
100.00% |
99.17% |
99.58% |
99.90% |
100.00% |
100.00% |
100.00% |
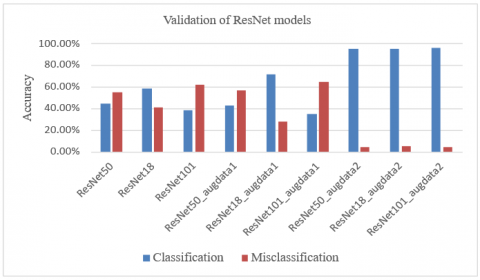
An essential part of the trained model is that it should classify the given data accurately. The trained ResNet models are validated with the data not part of the training or testing of the dataset from the PlantVillage database. The validation of the model is shown in Figure 8. The ResNet models trained with the dataset show lower performance than the ResNet models trained with an augmented dataset. Among the models trained with the dataset, ResNet18 has better classification than ResNet50 and ResNet101. The validation accuracy increased by 50.46% for ResNet50, 36.11% for ResNet18, and 57.59% for ResNet101 when the augmented data is used to train the network. The misclassification has been reduced tremendously. Overall, it is seen that ResNet models trained with augdata2 are behaving exceptionally well in classification and validation.
The ResNet models are tested using images of tomato plants taken at KVKN. The images are raw, and no processing is done for the prediction purpose. The ResNet model prediction is shown in Figure 9. Figure 9(a) shows the prediction as YLCV eight times and SLS one time. ResNet models with augdata2 perform exceptionally well with the prediction accuracy and class identification. ResNet50 with augdata2 predicts the image as YLCV with 99.96% accuracy, followed by ResNet18 with augdata2 predicting the images as YLCV with 99.52%. Figure 9(b) depicts the prediction as EB for each of the nine times. With 94.71% accuracy, ResNet50 with augdata2 predicts the image as EB. Figure 9(c) depicts an image's prediction as LB nine times. ResNet101 with augdata2 followed by ResNet18 with augdata2 outperformed with the prediction accuracy of 100% and 99.99%. ResNet50 with augdata2 is showing good predictions.
Figure 8. Validation of ResNet models for PlantVillage data
(a)
ResNet50_data: 95.29% YLCV,
ResNet50_augdata1: 95.29% YLCV,
ResNet50_augdata2: 99.96% YLCV
ResNet18_data: 97.11% YLCV,
ResNet18_augdata1: 90.29% YLCV
ResNet18_augdata2: 99.52% YLCV
ResNet101_data: 36.13% SLS
ResNet101_augdata1 :41.58% YLCV
ResNet101_augdata2: 89.94% YLCV
(b)
ResNet50_data: 70.44% EB
ResNet50_augdata1: 70.44% EB
ResNet50_augdata2: 94.71% EB
ResNet18_data: 54.26% EB
ResNet18_augdata1: 59.39% EB
ResNet18_augdata2: 76.28% EB
ResNet101_data :42.32% EB
ResNet101_augdata1: 53.91% EB
ResNet101_augdata2: 76.1% EB
(c)
ResNet50_data: 68.89% LB
ResNet50_augdata1: 68.89% LB
ResNet50_augdata2: 94.81% LB
ResNet18_data: 99.76% LB
ResNet18_augdata1 :99.8% LB
ResNet18_augdata2: 99.99% LB
ResNet101_data: 99.42% LB
ResNet101_augdata1: 98.87% LB
ResNet101_augdata2: 100% LB
Figure 9. Prediction by ResNet models for KVKN data
This method employs the deep learning models ResNet50, ResNet18, and ResNet101 with a dataset and a suggested augmented dataset to classify and validate TPL images from the PlantVillage database. The ResNet models outperform the classification and predict KVKN data with improved accuracy with the augmented dataset. It is seen that the ResNet101 model trained with the proposed augmented dataset outperforms with 99.99% accuracy in testing and 95.83% validation accuracy. The testing accuracy of ResNet50 and ResNet101 is 99.96% and 99.95%, respectively, with an augmented dataset and validation accuracy as 95.09% and 94.81%, respectively. In terms of training time, the ResNet model with an augmented dataset takes longer than training with the dataset. The validation time of new data is significantly less in all the models. The performance parameters like macro recall, macro precision, macro F1 score, and mean accuracy of ResNet models are calculated and show promising results throughout affirming the more robust classification process. The average precision positively influences the data augmentation for all the tomato plant classes. The models validated on PlantVillage and KVKN data show promising results with the augmented dataset.
This work is funded by Minister of Education Malaysia under grant FRGS/1/2018/TK04/UKM/02/1 and AKU254: HICoE (Fasa II) ‘MEMS for Biomedical Devices (artificial kidney)’. This work is supported by the officials at Krishi Vigyan Kendra Narayangaon, Pune, India for allowing to capture images of tomato plant in the field.
[1] Arivazhagan, S., Shebiah, R.N., Ananthi, S., Varthini, S.V. (2013). Detection of unhealthy region of plant leaves and classification of plant leaf diseases using texture features. Agricultural Engineering International: CIGR Journal, 15(1): 211-217.
[2] Al Bashish, D., Braik, M., Bani-Ahmad, S. (2010). A framework for detection and classification of plant leaf and stem diseases. In 2010 International Conference on Signal and Image Processing, pp. 113-118.
[3] Ferentinos, K.P. (2018). Deep learning models for plant disease detection and diagnosis. Computers and Electronics in Agriculture, 145: 311-318. https://doi.org/10.1016/j.compag.2018.01.009
[4] Mohanty, S.P., Hughes, D.P., Salathé, M. (2016). Using deep learning for image-based plant disease detection. Frontiers in Plant Science, 7: 1419.
[5] Yang, X., Guo, T. (2017). Machine learning in plant disease research. March, 31: 1.
[6] Singh, V., Misra, A.K. (2017). Detection of plant leaf diseases using image segmentation and soft computing techniques. Information Processing in Agriculture, 4(1): 41-49. https://doi.org/10.1016/j.inpa.2016.10.005
[7] LeCun, Y., Bottou, L., Bengio, Y., Haffner, P. (1998). Gradient-based learning applied to document recognition. Proceedings of the IEEE, 86(11): 2278-2324. https://doi.org/10.1109/5.726791
[8] Krizhevsky, A., Sutskever, I., Hinton, G.E. (2012). ImageNet classification with deep convolutional neural networks. Advances in Neural Information Processing Systems, 25: 1097-1105.
[9] Szegedy, C., Liu, W., Jia, Y., Sermanet, P., Reed, S., Anguelov, D., Erhan, D., Vanhoucke, V., Rabinovich, A. (2015). Going deeper with convolutions. In Proceedings of the IEEE Conference on Computer Vision and Pattern Recognition, pp. 1-9. https://doi.org/10.1109/CVPR.2015.7298594
[10] He, K., Zhang, X., Ren, S., Sun, J. (2016). Deep residual learning for image recognition. In Proceedings of the IEEE Conference on Computer Vision and Pattern Recognition, pp. 770-778. https://doi.org/10.1109/CVPR.2016.90
[11] Simonyan, K., Zisserman, A. (2014). Very deep convolutional networks for large-scale image recognition. arXiv preprint arXiv:1409.1556. https://arxiv.org/abs/1409.1556.
[12] Huang, G., Liu, Z., Van Der Maaten, L., Weinberger, K. Q. (2017). Densely connected convolutional networks. In Proceedings of the IEEE Conference on Computer Vision and Pattern Recognition, pp. 4700-4708. https://doi.org/10.1109/CVPR.2017.243
[13] Iandola, F.N., Han, S., Moskewicz, M.W., Ashraf, K., Dally, W.J., Keutzer, K. (2016). SqueezeNet: AlexNet-level accuracy with 50x fewer parameters and< 0.5 MB model size. arXiv preprint arXiv:1602.07360. http://arxiv.org/abs/1602.07360.
[14] Arechiga, A.P., Michaels, A.J. (2018). The robustness of modern deep learning architectures against single event upset errors. In 2018 IEEE High Performance Extreme Computing Conference (HPEC), Waltham, MA, USA, pp. 1-6. https://doi.org/10.1109/HPEC.2018.8547532
[15] Bulla, P., Anantha, L., Peram, S. (2020). Deep neural networks with transfer learning model for brain tumors classification. Traitement du Signal, 37(4): 593-601. https://doi.org/10.18280/ts.370407
[16] Mehra, R. (2018). Breast cancer histology images classification: Training from scratch or transfer learning? ICT Express, 4(4): 247-254. https://doi.org/10.1016/j.icte.2018.10.007
[17] Da Nóbrega, R.V.M., Peixoto, S.A., da Silva, S.P.P., Rebouças Filho, P.P. (2018). Lung nodule classification via deep transfer learning in CT lung images. In 2018 IEEE 31st International Symposium on Computer-based Medical Systems (CBMS), pp. 244-249. https://doi.org/10.1109/CBMS.2018.00050
[18] Rezende, E., Ruppert, G., Carvalho, T., Ramos, F., De Geus, P. (2017). Malicious software classification using transfer learning of resnet-50 deep neural network. In 2017 16th IEEE International Conference on Machine Learning and Applications (ICMLA), Cancun, Mexico, pp. 1011-1014. https://doi.org/10.1109/ICMLA.2017.00-19
[19] Liu, X., Wang, C., Bai, J., Liao, G. (2020). Fine-tuning pre-trained convolutional neural networks for gastric precancerous disease classification on magnification narrow-band imaging images. Neurocomputing, 392: 253-267. https://doi.org/10.1016/j.neucom.2018.10.100
[20] Salama, W.M., Aly, M.H. (2021). Deep learning in mammography images segmentation and classification: Automated CNN approach. Alexandria Engineering Journal, 60(5): 4701-4709. https://doi.org/10.1016/j.aej.2021.03.048
[21] Fuentes, A., Yoon, S., Kim, S.C., Park, D.S. (2017). A robust deep-learning-based detector for real-time tomato plant diseases and pests recognition. Sensors, 17(9): 2022. https://doi.org/10.3390/s17092022
[22] Fuentes, A.F., Yoon, S., Lee, J., Park, D.S. (2018). High-performance deep neural network-based tomato plant diseases and pests diagnosis system with refinement filter bank. Frontiers in Plant Science, 9: 1162. https://doi.org/10.3389/fpls.2018.01162
[23] Mohammedhasan, M., Uğuz, H. (2020). A new early stage diabetic retinopathy diagnosis model using deep convolutional neural networks and principal component analysis. Traitement du Signal, 37(5): 711-722. https://doi.org/10.18280/ts.370503
[24] Han, L., Yu, C., Xiao, K., Zhao, X. (2019). A new method of mixed gas identification based on a convolutional neural network for time series classification. Sensors, 19(9): 1960. https://doi.org/10.3390/s19091960
[25] Hu, J., Song, W., Zhang, W., Zhao, Y., Yilmaz, A. (2019). Deep learning for use in lumber classification tasks. Wood Science and Technology, 53(2): 505-517. https://doi.org/10.1007/s00226-019-01086-z
[26] Wang, Q., Qi, F. (2019). Tomato diseases recognition based on faster RCNN. In 2019 10th International Conference on Information Technology in Medicine and Education (ITME), Qingdao, China, pp. 772-776. https://doi.org/10.1109/ITME.2019.00176
[27] Mukti, I.Z., Biswas, D. (2019). Transfer learning based plant diseases detection using ResNet50. In 2019 4th International Conference on Electrical Information and Communication Technology (EICT), Khulna, Bangladesh, pp. 1-6. https://doi.org/10.1109/EICT48899.2019.9068805
[28] Verma, S., Chug, A., Singh, A.P. (2020). Impact of hyperparameter tuning on deep learning based estimation of disease severity in grape plant. In International Conference on Soft Computing and Data Mining, pp. 161-171. https://doi.org/10.1007/978-3-030-36056-6_16
[29] Rangarajan Aravind, K.., Raja, P. (2020). Automated disease classification in (Selected) agricultural crops using transfer learning. Automatika: časopis za automatiku, mjerenje, elektroniku, računarstvo i komunikacije, 61(2): 260-272. https://doi.org/10.1080/00051144.2020.1728911
[30] Jadhav, S.B. (2019). Convolutional neural networks for leaf image-based plant disease classification. IAES International Journal of Artificial Intelligence, 8(4): 328-341. https://doi.org/10.11591/ijai.v8.i4.pp328-341
[31] Brahimi, M., Boukhalfa, K., Moussaoui, A. (2017). Deep learning for tomato diseases: Classification and symptoms visualization. Applied Artificial Intelligence, 31(4): 299-315. https://doi.org/10.1080/08839514.2017.1315516
[32] Zhang, K., Wu, Q., Liu, A., Meng, X. (2018). Can deep learning identify tomato leaf disease? Advances in Multimedia, 2018: 1-11. https://doi.org/10.1155/2018/6710865
[33] Rangarajan, A.K., Purushothaman, R., Ramesh, A. (2018). Tomato crop disease classification using pre-trained deep learning algorithm. Procedia Computer Science, 133: 1040-1047. https://doi.org/10.1016/j.procs.2018.07.070
[34] Karthik, R., Hariharan, M., Anand, S., Mathikshara, P., Johnson, A., Menaka, R. (2020). Attention embedded residual CNN for disease detection in tomato leaves. Applied Soft Computing, 86: 105933. https://doi.org/10.1016/j.asoc.2019.105933
[35] Dyrmann, M., Karstoft, H., Midtiby, H.S. (2016). Plant species classification using deep convolutional neural network. Biosystems Engineering, 151: 72-80. https://doi.org/10.1016/j.biosystemseng.2016.08.024
[36] Shorten, C., Khoshgoftaar, T.M. (2019). A survey on image data augmentation for deep learning. Journal of Big Data, 6(1): 1-48. https://doi.org/10.1186/s40537-019-0197-0
[37] Cygert, S., Czyżewski, A. (2020). Toward robust pedestrian detection with data augmentation. IEEE Access, 8: 136674-136683. https://doi.org/10.1109/ACCESS.2020.3011356
[38] Gers, F.A., Schmidhuber, J., Cummins, F. (2000). Learning to forget: Continual prediction with LSTM. Neural Computation, 12(10): 2451-2471. https://doi.org/10.1162/089976600300015015
[39] LeCun, Y., Bengio, Y., Hinton, G. (2015). Deep learning. Nature, 521(7553): 436-444. https://doi.org/10.1038/nature14539
[40] Kamilaris, A., Prenafeta-Boldú, F.X. (2018). Deep learning in agriculture: A survey. Computers and Electronics in Agriculture, 147: 70-90. https://doi.org/10.1016/j.compag.2018.02.016
[41] Ding, J., Chen, B., Liu, H., Huang, M. (2016). Convolutional neural network with data augmentation for SAR target recognition. IEEE Geoscience and Remote Sensing Letters, 13(3): 364-368. https://doi.org/10.1109/LGRS.2015.2513754
[42] Volpi, M., Tuia, D. (2016). Dense semantic labeling of subdecimeter resolution images with convolutional neural networks. IEEE Transactions on Geoscience and Remote Sensing, 55(2): 881-893. https://doi.org/10.1109/TGRS.2016.2616585
[43] Sathyanarayana, A., Joty, S., Fernandez-Luque, L., Ofli, F., Srivastava, J., Elmagarmid, A., Arora, T., Taheri, S. (2016). Sleep quality prediction from wearable data using deep learning. JMIR mHealth and uHealth, 4(4): e125. https://doi.org/10.2196/mhealth.6562