Sujith Ariyapadath
© 2021 IIETA. This article is published by IIETA and is licensed under the CC BY 4.0 license (http://creativecommons.org/licenses/by/4.0/).
OPEN ACCESS
The main purpose of this research work is to apply machine learning and image processing techniques for plant classification efficiently. In the plant classification system, the conventional method is time-consuming and needs to apply expensive analytical instruments. The automated plant classification system helps to predict plant classes easily. The most challenging part of the automated plant classification research is to extract unique features of leaves. This paper proposes a plant classification model using an optimal feature set with combined features. The proposed model is used to extract features from leaf images and applied to image classification algorithms. After the evaluation process, it is found that GIST, Local Binary Pattern and Pyramid Histogram Oriented Gradient have better results than others in this particular application. Combined these three features extraction techniques and selected the optimal feature set through Neighbourhood Component Analysis. The optimal feature set helps classify plants with maximum accuracy in minimal time. Here performed an extensive experimental comparison of the proposed optimal feature set and other feature extraction methods using different classifiers and tested on different data sets (Swedish Leaves, Flavia, D-Leaf). The results confirm that this optimal feature set with NCA using ANN classifier leads to better classification achieved 98.99% accuracy in 353.39 seconds.
plant classification, optimal feature set, GIST, local binary pattern, pyramid histogram oriented gradient, machine learning, neighbourhood component analysis, artificial neural network
Plants are backbone of all living organisms and it produces oxygen, helps to control climate change. Plants are a good source of food and gives oxygen, shelter, medicine and fuel. Without plants, the environment and human life on this earth cannot exist. Plants are facing extinction due to deforestation, urbanization, global warming and overexploitation. Thus, creating a plant database for speedy and effective classification is necessary to protect the plants. In ancient times, taxonomists classified plant species based on the characteristics of the plant using the wet lab process. Different parts of a plant such as leaves, flowers, seeds, barks, fruits, and roots can be used for classification. Leaves are an essential part of a plant and vary in shape, color, texture, and size [1]. The structure of each plant leaf is different and can differentiate one variety of plants from the other. Thus leaf-based classification is the most widely accepted approach.
Classification of plant species using the wet lab process is time-consuming. The automated plant identification system helps researchers, botanists, and non-specialists to protect endangered plants. Several researchers attempt to develop a plant classification system using digital image processing and machine learning techniques [2]. A number of feature extraction, feature selection techniques and classifiers have been proposed for classification. The qualities of extracted features influence the performance of plant leaf classification. However, acquiring meaningful and unique features from a low variation plant species is a complex task. Combining two or more feature extraction techniques (shape, texture, color, venation etc.) gives better classification results than a single feature extraction technique [3]. Optimal feature set selection helps to maintain the quality of features [4]. This paper proposed an optimal feature set from multiple feature descriptors using feature selection techniques to build a classification model.
The main highlights of this paper are summarized as follows:
(1) Proposed an optimal feature set using combination of feature extraction methods with three selection methods and evaluated in three benchmark datasets.
(2) Comparative analysis of proposed model with three classifiers, Feed Forward Back Propagation Neural Network, K Nearest Neighbour (KNN), and ensemble learning with Random Forest (RF), and all three get better results. The model performs well using the Feed Forward Back Propagation Neural Network classifier with the Swedish leaf dataset.
(3) Analyze the combined feature set with feature selection methods NCA, ReliefF and MRMR.
(4) Compare the proposed model with recent existing works.
More specifically, this paper focus on optimal feature set from combined multiple feature extraction methods. An optimal feature set can highly influence plant image classification accuracy and reduction of computational time. This paper consists of five main sections. Section 1 explains the importance of plants in human life, the relevance of automated plant classification systems, and the importance of a combination of multiple feature extraction methods and optimal feature set for the classification of plants. Section 2 reviews the existing plant classification model methodology, and description. Section 3 describes proposed machine learning models for plant classification incorporating feature extraction methods and classification phases. Section 4 describes the evaluation of the proposed model using different performance measures. Compare the proposed model results with state of art works-finally, conclusion and future enhancement is given in Section 5.
In the literature review, we can find several plant classification methods. The performance of the classifier will vary with respect to several factors like noise, irrelevant, and number of features. The quality of extracted features plays an important role deciding the total performance.
There are many plant leaf classification models are available in the literature. Zhao et al. [5] proposed an Independent-Inner-Distance Shape Context (I-IDSC) and ANN classifier using Swedish Dataset. Munisami et al. [6] presented a model by integrating shape, morphological information, color histogram, distance maps and k-Nearest Neighbor classifier using Flavia dataset. Naresh and Nagendraswamy [7] proposed medicinal plant classification system using modified LBP and 1-nearest neighbor classifier with UoM medicinal plant dataset. Yang et al. [8] build a shape-based system using multi-scale triangular centroid distance and shape dissimilarity measurement with Swedish leaves. Rzanny et al. [9] introduced Elliptical Half Gabor and Maximum Gap Local Line Direction Pattern to obtain stable and independent local line responses from leaf contour, texture, and vein. Begue et al. [10] proposed a medicinal plant recognition system by integrating shape and color features using Random Forest classifier with ten-fold cross-validation. Kan et al. [11] proposed an automatic plant classification method based on shape features, three geometrical features, and GLCM texture characteristics using SVM classifier. Hewitt and Mahmoud [12] presents a novel feature set using shape, signal features, curvature maps and SVM classifier with radial basis function (RBF) kernel using the Swedish leaves dataset. Ali et al. [13] proposed combined feature set using LBP and Bag of features for classification using SVM. Salve et al. [14] proposed a multi-model plant classification system by integrating LBP and GIST features using feature-level fusion and score-level fusion techniques. Mostajer Kheirkhah and Asghari [15] proposed a model with the help of GIST texture features with PCA feature selection method. The Cosine KNN classifier is used for classifying this model. Kuang et al. [16] proposed a method to construct a defect detection method of the bamboo strip using an SVM classifier by integrating LBP and GIST features. Pacifico et al. [17] proposed an automatic plant classification system based on color and texture features using a multi-layer perception with backpropagation (ML-BP) classifier. Sujith and Neethu [18] proposed a feature combination method to classify plants using ANN classifier by combining shape and texture features. Ahmed et al. [19] proposed six color features and twenty-two texture features (GLCM) have been calculated. These features applied to SVM one-vs-one classifier.
The research conducted in plant analysis models still has some challenges and limitations. It is essential to extract all relevant features for classification to increases the classification accuracy with minimal computational time. Some feature descriptors are better to suit particular types of datasets than others. Also, it is found that a combination of various feature descriptors, effective feature selection and dimensionality reduction methods are beneficial for increasing the overall classification performance.
The introduced technique is trained and tested with three publicly available benchmark data set Swedish Leaves, Flavia, and D-Leaf.
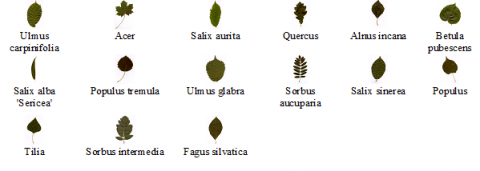
(a) Swedish leaves dataset
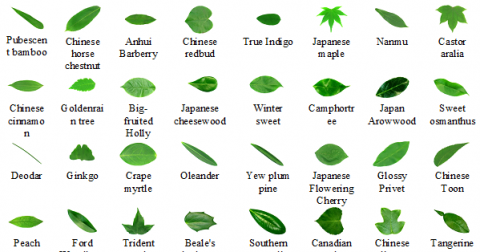
(b) Flavia dataset
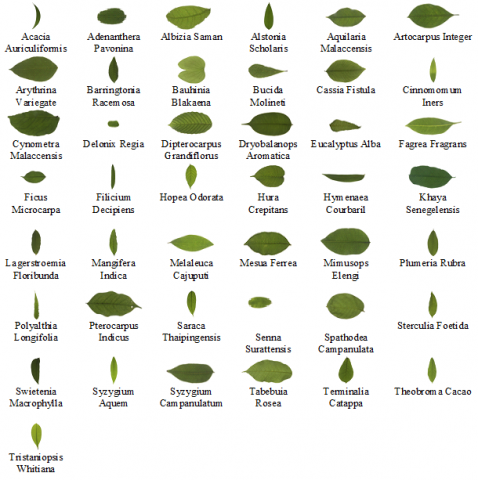
(c) D Leaf dataset
Figure 1. Datasets
The Swedish Leaves dataset [20] consists of 15 tree species with 24-bit RGB images. Each class contains 75 pictures with a white background and various dimensions with total number of 1125 images in tiff file format. The proposed model resizes the image to 200×200. Datasets are divided into 70% for training, 15% for validation, and 15% for testing.
The Flavia dataset [21] consists of 32 plant classes. The Flavia dataset consist of 1907 RGB plant images with white background. Each class contains a various number of images in the jpeg file format with 1600 x 1200 dimensions. In the proposed model, choose 1600 images, and each class consists of 50 images used for the experiment. Datasets are divided into 70% for training, 15% for validation, and 15% for testing.
The D- Leaf dataset [22] consists of 43 plant classes with a white background. This dataset contains 1290 RGB plant leaf images. Each class contains 30 leaf images in a tiff file format with 250 x 250 dimensions. Datasets are divided into 70% for training, 15% for validation, and 15% for testing.
Figure 1(a), 1(b), 1(c) shows sample images of each class from Swedish leaves, Flavia and D Leaf datasets, respectively.
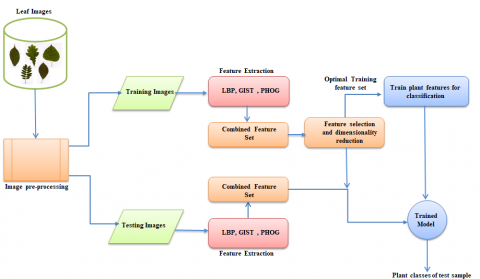
Proposed model consists of five phases Pre-processing, Feature extraction, Feature normalization and combination, Feature selections and reduction, classification as shown in Figure 2. Pre-processing phase deals with converting RGB images into Grayscale and apply median filter. Initially selected five feature extraction method. Based on performance evaluation measure of these feature extraction methods in Table 1(a), 1(b), 1(c) choose three feature extraction methods GIST, Local Binary Pattern (LBP), and Pyramid Histogram Oriented Gradient (PHOG) for the optimal feature set combination. Feature normalization and combination stage, which normalize features using mapminmax techniques and combine the above features. The feature selection and reduction phase uses the filter method for optimal feature selection and reduction tasks like Neighborhood Component Analysis (NCA), ReliefF, and Maximum Relevance Minimum Redundancy (MRMR) algorithms. This method can select relevant features for better classification; reduce the feature vector size, and reduce the model's time complexity. The classification phase includes training, validation and testing. The optimal feature set is used in the training and the parameters are selected using cross-validation. The classification task is performed using Artificial Neural Network with backpropagation (ANN), k-Nearest Neighbour (KNN) and Random Forest with Decision Tree (RF).
4.1 Pre-processing
Image pre-processing techniques significantly impact the quality of image and classification performance rate of the model [23]. The different artifacts may occur during image acquisition, such as low contrast, brightness, image transformation etc. The proposed method uses the Swedish leaves dataset containing 15 plant species with 1125 RGB leaf images. In these images first converted the RGB image to Grayscale using Eq. (1). Next, apply the median filter using Eq. (2) to reduce noise and preserve image edges. Finally, filtered leaf images were resized to 200×200 from variable size.
R_to_G $=0.2989 * \mathrm{R}+0.5870^{*} \mathrm{G}+0.1140^{*} \mathrm{~B}$ (1)
According to Eq. (1), red, green, and blue have contributed 30%, 59%, and 11%, respectively. Above three colors (R, G, and B) have different wavelengths and contribute to image formation. Here uses the luminosity method to convert RGB to grayscale images properly. The Median filtering, 3×3 windows of neighborhood pixel values sorted in ascending order and pick the median value. This filter is efficient for reducing impulse noise, with less blurring of edges [24].
$\mathrm{y}[\mathrm{m}, \mathrm{n}]=\operatorname{median}\{\mathrm{x}[\mathrm{i}, \mathrm{j}],(\mathrm{i}, \mathrm{j}) \varepsilon \omega\}$ (2)
where, ω represents the neighborhood defined by the user, centered around the location [m, n] in the image. The same operation is done on other datasets like Flavia and D leaf datasets for evaluating our model.
4.2 Feature extraction
In image processing, the features are the characteristics that describe from images. In this section, LBP, GIST and PHOG features were extracted from the leaf image and for evaluation purpose, extracted HOG, GLCM features. The following sub-sections describe all feature extraction methods incorporated in this work.
Figure 2. The architecture of the proposed model
4.2.1 GIST
The GIST feature itself is a collection of Gabor filter responses from the image, and it can represent a region boundary of the object or shape of the scene in the picture. The GIST descriptors base a low-dimensional representation of scenes and are called spatial envelopes. The scene's spatial envelop properties are naturalness, openness, perspective, size, diagonal plane, depth, symmetry, contrast, roughness, expansion, and ruggedness [25]. 2D Gabor filter is defined in Eq. (3) as follows
$\left\{\begin{array}{l}g(x, y ; \sigma, \theta, \lambda, \gamma, \psi)=\exp \left[-\left(\frac{x^{\prime 2}+\gamma^{2} y^{\prime 2}}{2 \sigma^{2}}\right)\right] \cdot \exp \left[i\left(2 \pi \frac{x^{\prime}}{\lambda}+\psi\right)\right] \\ x^{\prime}=a^{-m}(x \cos \theta+y \sin \theta), y^{\prime}=-x \sin \theta+y \cos \theta \\ \theta=\frac{n \pi}{n+1}\end{array}\right.$ (3)
where, g(x, y) is normalized frequency of Gabor filter, σ is standard deviation, θ is the rotation angle, λ is the wavelength, γ is the aspect ratio, ψ is phase offset, a-m denotes the scale factor, m denotes the number of scales, n denotes the skewness. Gabor filter is used to extract information separately from two different regions with similar gray levels. First, split the pre-processed image into 4×4 size grids with four scales, and eight orientations then compute the filter response of each cell using a series of Gabor filters in equation 3. All the cell responses were concatenated to form a GIST feature vector.
Intuitively, GIST summarizes the gradient information (scales=4 and orientations=8) for different parts of an image, which provides a rough description (the gist) of the scene.
4.2.2 Local binary pattern (LBP)
LBP [26] is a texture feature descriptor used to describe the texture characteristic of an image.
Grayscale image divides into 3×3windows into cells, and each cell contains 16×16 pixels. Next, compare each neighboring pixel value with the center pixel for every cell. The value set 0 for the neighbor pixel, which is less than the center pixel value, and set 1 for the neighboring pixel, is greater than the center pixel value. Select eight binary bits in a clockwise direction and convert them into decimal form. This decimal value assigns to the center pixel. After completing this process, get the LBP code matrix of the given image. Find a histogram of each number in the cell and finally get 256-dimensional feature vectors. Concatenation of all histograms of each cell provides the feature vector of the entire row. Calculate LBP pixel code using Eq. (4) and Eq. (5) as follows:
$\operatorname{LBP}\left(\mathrm{g}_{\mathrm{px}}, \mathrm{g}_{\mathrm{py}}\right)=\sum_{\mathrm{p}=0}^{\mathrm{P}-1} \mathrm{~S}\left(\mathrm{~g}_{\mathrm{p}}-\mathrm{g}_{\mathrm{c}}\right) 2^{\mathrm{p}}$ (4)
$S(x)=\left\{\begin{array}{l}1, \text { if } x \geq 0 \\ 0, \text { if } x<0\end{array}\right.$ (5)
where, gc is the intensity value of the center pixel, gp is the intensity of the neighboring pixel index, P is the number of sampling points on a circle of radius R, p controls the quantization of the method and S(x) is the threshold step function. Here choose P=8.
4.2.3 Pyramid histogram of oriented gradients (PHOG)
The Pyramid Histogram of Oriented Gradients is an extended version of the HOG feature descriptor. The PHOG [27] is a spatial shape descriptor. First read the RGB images and convert them to a grayscale image. Next, extract edge counter using Canny edge detection algorithm. Compute HOG for each grid at each pyramid level. Here chooses the pyramid level is 3 (l=0, 1, 2). The local shape represents a histogram of edge orientations within an image sub-region quantized into eight bins. Compute edge counters and orientation gradients in the original image. The final PHOG descriptor vector of the entire image concatenated all HOG vectors at each pyramid resolution. This vector contains the spatial information of the image. The PHOG vector size is 1×680 and calculated using Eq. (6) as follows.
$N=\eta\left(\frac{4^{l+1}-1}{3}\right)$ (6)
where, N is the total number of PHOG features, l is the number of pyramid levels; η is the number of orientation bins.
GLCM is a second-order statistical texture analysis measure for the probabilities of finding the pair of pixels in a particular location and orientation of an image [28]. The second-order measure presents the changing of one gray level pixel value to its neighboring pixel value. GLCM is a tabulation of how often a different combination of gray levels co-occurrence in an image or image section. GLCM calculates in 8 angles at any offset. Calculate GLCM at 0˚ means finding the relationship between a pair of two-pixel values horizontally on the right-hand side. Here choose 0˚ direction in this case. Count the pixel number with 0 quantization numbers appearing with 0 pixels and 0 quantization numbers appearing with one quantization. The resultant matrix's diagonal value indicates the homogenous area, and the heterogeneity increased away from the diagonal elements.
The Histogram of Oriented Gradients is a shape descriptor [29]. First, crop the image into small patches. This patched image resized into 64×128. The resized image divides into 8×16 grids. Each block in the grid is 8×8 pixels. Now get one block of grid. Calculate this pixel position's gradient magnitude and direction using Eq. (7) and Eq. (8). Find the difference of pixel intensity in x and y-direction—diagonal elements of the grid value not considered for calculating intensity in x and y-direction
GradientMagnitude $=\sqrt{\left(x_{\text {drection }}\right)^{2}+\left(y_{\text {drection }}\right)^{2}}$ (7)
Gradient $_{\text {Direction }}=\tan ^{-1}\left(\frac{x_{\text {direction }}}{y_{\text {direction }}} \quad\right)$ (8)
Similarly, calculate the gradient magnitude and direction of all the pixel positions. Here the entire angle is between 0˚ and 180˚. This angle is divided into nine different bins to build the histogram. Check the gradient direction at any pixel position and its corresponding magnitude. In this histogram, place and distribute the magnitude value corresponding to its bin. Likewise, check all the gradient directions and their corresponding magnitude value. Here got the value of the magnitude in the corresponding bins and placed it in the vector form. Here the size of the feature vector is the distribution of the magnitude of each bin in the histogram.
4.3 Feature normalization and combination
Feature normalization helps to scale down all feature values between 0 and 1. Features have two basic properties units and magnitude. Unit is how that particular feature used to measure and magnitude is the value of a particular feature. Here I used minmax normalization method which will help the classifier to learn the weight quickly and improve the performance of the model by reducing bias. The inter-class variation between each plant leaf cannot be correctly classified using a single feature [30]. To overcome the high inter-class variation, it uses different features concatenate with two or more feature sets. LBP texture feature can be reflecting the intensity relation between a pixel and its neighboring pixels. Spatial information is lost when LBP capture local pattern. PHOG is the spatial shape descriptor that adds spatial information. GIST feature extraction is used for the low-dimensional representation of the scene. Therefore, combining different complementary feature extraction methods (LBP, PHOG, and GIST) can easily distinguish each class. Here used feature appending techniques for combining feature extraction methods. The concatenation of these features increases the classification accuracy. The size of the feature vector increased after the concatenation of different features. Here NCA technique uses for feature selection and reduction to reduce the size of the feature vector. This reduction method improves the classification performance in terms of accuracy and computational time.
4.4 Feature selection and reduction
In machine learning, feature selection of relevant features is essential. Feature selection enables proposed algorithm to train faster, reduce computational complexity and minimize the overfitting of a model. Here chose a selection algorithm under the category of filter methods like NCA, RelifF, and MRMR algorithm. Filter methods are fast and do not involve in training the model, and it is computationally less expensive. The following subsection describes all feature selection methods used in proposed model and by evaluating this model.
4.4.1 Neighborhood component analysis (NCA)
NCA is used in the k-nearest neighborhood classification algorithm to learn low dimensional labeled data with Mahalanobis distance measure [31]. NCA is a supervised metric learning algorithm, and it transfers data points in new space. The distance between two data points in the same class is small compared to different classes. This metric learner uses to learn distance with the help of Mahalanobis distance measure. The weights of the unwanted features should be close to zero. With the support of NCA, linear dimensionality reduction with low-rank distance is possible. This case learned metric will be of low rank. The selected feature set ranked based on maximum feature weights and chose maximum weighted 1000 elements to form a new feature vector. Define the probability that a point i select another point j as its neighbor pij using a softmax over Euclidean distances in the transformed space using Eq. (9) as follows.
$p_{i j}= \begin{cases}\frac{e^{-\left\|A x_{i}-A x_{j}\right\|^{2}}}{\sum_{k} e^{\left\|A x_{i}-A x_{k}\right\|^{2}}}, & if \quad j \neq i \\ 0, & , { if } \quad j=i\end{cases}$ (9)
The main objective of NCA is to select optimal data points for correctly classify the model under Eq. (10) as follows:
$f(A)=\sum_{i} \sum_{j \in C_{i}} p_{i j}=\sum_{i} p_{i}$ (10)
where, probability pi that point i will be correctly classified by Ci={j|ci=cj}.
4.4.2 ReliefF
ReliefF algorithm is an extension of the Relief feature selection algorithm and is used for multi-class feature selection. This algorithm is an attribute selection algorithm based on the instant. Instead of finding one near miss, the algorithm finds one near miss for each class and averages their contribution of updating the weights [32].
4.4.3 MRMR
The MRMR [33] is a sequential forward feature selection algorithm to find an optimal set of mutually and maximally dissimilar features and can represent the dependent variable effectively. The algorithm minimizes the inefficiency of the feature set and maximizes the relevance of the feature set to the dependent variable. The algorithm quantifies inefficiency and relevance using mutual and pairwise mutual information of features and the dependent variable.
4.5 Classification
The final phase of proposed model is classification. This phase deals with matching the target label to the predicted labels. In this research work, to classify multiple classes using this model. The following subsection describes classifiers that are used in proposed model and evaluates this model. The best model obtained using Artificial Neural Network with backpropagation in this particular application.
4.5.1 Artificial neural network (ANN)
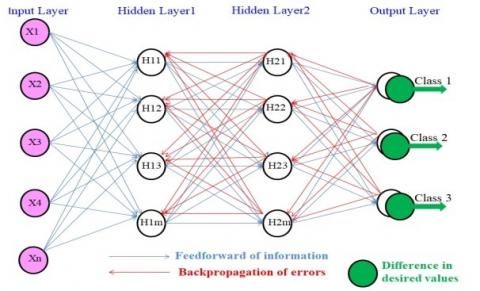
The ANN [34] with backpropagation structures into input layer, hidden layers and output layer. The input layer contains 1000 feature and output layer have 15 classes. Here chose two hidden layers, each contains 400 neurons and fix through a trial and error mechanism.
Here chose the conjugate gradient algorithm as the training function, and its convergence speed is higher than other training functions. Calculate cross-entropy for network performance during training and the sigmoid activation function to forecast the probability as an output. Here calculated the cross-entropy using Eq. (11) to evaluate the network performance during training. This neural network learns all the features from training sample validate data using cross-validation technique and test with given testing images.
Cross_entropy_loss $=-\sum_{c=1}^{M} y_{o, c} \log \left(P_{o, c}\right)$ (11)
where, M is number of classes, log is the natural log, y is Binary indicator (0 or 1) if class label c is the correct classification for observation o, P-Predicted probability observation o is of class c.
Figure 3 shows the network topology diagram for feed-forward backpropagation neural network containing input layer, two hidden layers, and output layer. The green circle indicates the difference in desired values, and the red line shows the errors' backpropagate.
Figure 3. ANN topology diagram
4.5.2 K-Nearest neighbour (KNN)
The K-Nearest Neighbour is a supervised machine learning algorithm that predicts each class based on feature similarity of target trained sample and test data. KNN classifier works better with a small number of input variables and the same scale of data [35]. Here, load the sample images and initializes the number of neighbor pixel (K) value is 5. Then apply the Euclidian distance method using Eq. (12) to find the distance between test data points and each row of training data using Eq. (12). The resultant distance values are sorted in ascending order and choose top K rows from the sorted array. Assign a class to the test points which are most frequent among the K training sample nearest to that test point
$d=\sqrt{\left(x_{1}-x_{2}\right)^{2}+\left(y_{1}-y_{2}\right)^{2}}$ (12)
where, xi, yi is data points d (Euclidian distance) is the shortest distance between two data points.
4.5.3 Random Forest (RF)
Random Forest is a classifier that works based on the ensemble learning approach [36]. The Ensemble learning approach used multiple machine learning models and tried to output a particular problem. Randomly select the subset of features set. The process of choosing a random sample of the observation is known as bagging. The bagging technique is design to improve the stability, accuracy and reduce the variance of the model. Here choose multiple decision tree models (set number of decision tree=200). Each decision tree has its role. Pick each node for an optimal split from the root node and subsequent splits in the decision tree based on the Gini impurity value. The Gini impurity is the probability of incorrectly classifying a randomly chosen element in the dataset if it is randomly labeled according to the dataset's class distribution. Gini impurity calculated using Eq. (13) as follows:
$G=\sum_{i=1}^{c} P(i)^{*} \quad(1-P(i))$ (13)
where, c represents a number of classes and P(i) is the probability of randomly picking an element of class i. The training is complete with 200 decision trees; combine all decision trees' training accuracy and calculate the mean of the training accuracy. Whenever give test data to these decision trees, each one predicts some labeled value. These predicted results count the maximum number of the decision tree's similar output using the majority voting technique. This result is taken and aggregated as the model's output.
In this section, analyze various feature extraction techniques and their combinations. The features are extracted and analyzed using five feature extraction methods LBP, PHOG, GIST, GLCM, and HOG, with three classifiers (ANN, KNN, RF) and three datasets (Swedish Leaves, Flavia, D Leaf). The summaries of the results are in Table 1(a), (b), (c). In Table 2(a), (b), (c) found that a combination of features provides better results than a single feature for classification. From Table 3(a), (b), (c), evaluated all the feature selection methods and found NCA gives a better optimal feature set than ReliefF and MRMR. It is found that combining two or more feature extraction techniques provides high accuracy, which helps identify plants easily. Here choose three feature extraction techniques LBP, PHOG, and GIST for the combination. The proposed model analyses with three classifiers, such as ANN, KNN, and RF. The proposed model outperforms using the ANN classifier with the Swedish Leaves dataset. Proposed model has been implemented using the following specifications. Windows 10, 64 bit, Intel(R) Core(TM) i7-3770 CPU @ 3.40GHz 3.40 GHz, 4 GB RAM and MATLAB R2019b.
Calculate proposed model accuracy, precision, recall and F1 score using the parameters such as True Positive (TP), False Positive (FP), True Negative (TN), and False Negative (FN). The confusion matrix helps to calculate these parameters.
Accuracy $=\left(\frac{\text { No.ofcorrectlyrecognizedsamples }}{\text { totalnoofsamples }} \quad\quad \right) * \quad \%$ (14)
Precision $=\frac{\sum \text { TruePositive }}{\sum \text { Predicted ConditionPositive }}$ (15)
Recall $=\frac{\sum \text { TruePositive }}{\sum \text { ConditionPositive }}$ (16)
$F_{1}$ Score $=2 * \frac{\text { Precision } \quad ^{*} \quad \text { Recall }}{\text { Precision }+\text { Recall }}$ (17)
5.1 Evaluation of feature extraction method
Extract features from leaf images and analyses using five feature extraction methods such as LBP, PHOG, GIST, GLCM, and HOG, with three classifiers (ANN, KNN, RF) on three datasets (Swedish Leaves, Flavia, D Leaf).
Table 1(a) shows the evaluation of feature extraction method using Swedish leaves dataset, and found that LBP and GIST has better results in terms of accuracy and computational time, GLCM achieved 80.47% accuracy using ANN classifiers and HOG achieved 90.21% classification accuracy with high computational time using RF classifier.
The high-performance measures indicate in the bolded face. Prec-Precision, Rec- Recall, F1-F1 Score, Acc-Accuracy, T(s)- Computational Time in seconds.
Table 1(a). Analysis of feature extraction methods using Swedish leaves
|
Classifier |
Features method |
Swedish Leaves dataset (Mean) |
||||
|
Prec |
Rec |
F1 |
Acc (%) |
T(s) |
||
|
ANN |
LBP |
0.97 |
0.97 |
0.97 |
97.22 |
140.49 |
|
GIST |
0.97 |
0.97 |
0.97 |
97.22 |
222.92 |
|
|
PHOG |
0.93 |
0.93 |
0.93 |
92.19 |
62.69 |
|
|
GLCM |
0.80 |
0.79 |
0.80 |
80.47 |
33.25 |
|
|
HOG |
0.71 |
0.70 |
0.70 |
69.94 |
844.03 |
|
|
KNN |
LBP |
0.96 |
0.96 |
0.96 |
95.84 |
130.44 |
|
GIST |
0.94 |
0.94 |
0.94 |
93.77 |
217.96 |
|
|
PHOG |
0.86 |
0.85 |
0.85 |
84.15 |
39.95 |
|
|
GLCM |
0.68 |
0.68 |
0.68 |
67.54 |
15.58 |
|
|
HOG |
0.90 |
0.89 |
0.89 |
88.63 |
802.28 |
|
|
RF |
LBP |
0.95 |
0.96 |
0.96 |
95.40 |
66.7 |
|
GIST |
0.94 |
0.94 |
0.94 |
94.21 |
124.83 |
|
|
PHOG |
0.94 |
0.94 |
0.94 |
93.62 |
39.81 |
|
|
GLCM |
0.68 |
0.68 |
0.68 |
67.46 |
19.19 |
|
|
HOG |
0.90 |
0.90 |
0.90 |
90.21 |
847.36 |
|
Table 1(b). Analysis of feature extraction methods using Flavia
|
Classifier |
Features method |
Flavia dataset (Mean) |
||||
|
Prec |
Rec |
F1 |
Acc (%) |
T(S) |
||
|
ANN |
LBP |
0.96 |
0.96 |
0.96 |
95.79 |
265.89 |
|
GIST |
0.94 |
0.94 |
0.94 |
94.17 |
341.25 |
|
|
PHOG |
0.90 |
0.91 |
0.90 |
90.08 |
96.81 |
|
|
GLCM |
0.68 |
0.68 |
0.68 |
66.53 |
48.63 |
|
|
HOG |
0.82 |
0.83 |
0.83 |
82.08 |
323.41 |
|
|
KNN |
LBP |
0.93 |
0.92 |
0.93 |
92.58 |
211.40 |
|
GIST |
0.91 |
0.90 |
0.91 |
90.42 |
314.17 |
|
|
PHOG |
0.87 |
0.84 |
0.85 |
84.10 |
59.18 |
|
|
GLCM |
0.60 |
0.59 |
0.60 |
59.31 |
35.99 |
|
|
HOG |
0.86 |
0.85 |
0.86 |
84.38 |
1,269.31 |
|
|
RF |
LBP |
0.93 |
0.93 |
0.93 |
92.71 |
144.86 |
|
GIST |
0.93 |
0.93 |
0.93 |
92.92 |
319.37 |
|
|
PHOG |
0.93 |
0.93 |
0.93 |
92.71 |
67.99 |
|
|
GLCM |
0.63 |
0.63 |
0.63 |
62.50 |
33.05 |
|
|
HOG |
0.84 |
0.83 |
0.84 |
82.29 |
1,154.62 |
|
Table 1(c). Analysis of feature methods using D Leaf
|
Classifier |
Features method |
D Leaf dataset (Mean) |
||||
|
Prec |
Rec |
F1 |
Acc (%) |
T(S) |
||
|
ANN |
LBP |
0.92 |
0.92 |
0.92 |
91.39 |
365.81 |
|
GIST |
0.90 |
0.89 |
0.90 |
89.12 |
299.80 |
|
|
PHOG |
0.72 |
0.71 |
0.71 |
71.49 |
80.45 |
|
|
GLCM |
0.55 |
0.55 |
0.55 |
53.09 |
128.19 |
|
|
HOG |
0.87 |
0.87 |
0.87 |
84.54 |
1,210.92 |
|
|
KNN |
LBP |
0.87 |
0.83 |
0.85 |
83.98 |
91.00 |
|
GIST |
0.76 |
0.74 |
0.75 |
73.28 |
251.57 |
|
|
PHOG |
0.64 |
0.61 |
0.63 |
59.79 |
51.86 |
|
|
GLCM |
0.53 |
0.51 |
0.52 |
50.64 |
74.20 |
|
|
HOG |
0.58 |
0.58 |
0.58 |
56.33 |
1230.92 |
|
|
RF |
LBP |
0.87 |
0.87 |
0.87 |
87.76 |
97.28 |
|
GIST |
0.83 |
0.83 |
0.83 |
82.48 |
240.80 |
|
|
PHOG |
0.84 |
0.84 |
0.84 |
83.15 |
46.14 |
|
|
GLCM |
0.55 |
0.54 |
0.54 |
54.78 |
58.69 |
|
|
HOG |
0.89 |
0.88 |
0.88 |
87.60 |
1,523.40 |
|
Table 1(b) shows the evaluation of the feature extraction method using the Flavia dataset and found LBP has better results achieved 95.79% accuracy than GIST and GLCM features using ANN classifiers. Here, PHOG achieved 92.71% classification accuracy using the RF classifier, and HOG achieved 84.38% accuracy using the KNN classifier. Here LBP feature perform better in ANN and KNN classifier and GIST feature perform better in RF classifier.
Table 1(c) shows the evaluation of the feature extraction method using D Leaf dataset. From the analysis found better results for LBP with 91.39% accuracy and GIST achieved second highest accuracy 89.12% using ANN classifier, and PHOG achieved 83.15% accuracy, GLCM achieved 54.78% accuracy and HOG achieved 87.60% accuracy using RF classifier. Here LBP perform better in all three classifiers.
Here chose LBP, GIST and PHOG feature extraction methods based on higher accuracy rate and less computational time from the above evaluation.
5.2 Evaluation of a combination of feature set
Table 2(a) analyses different combinations of feature extraction techniques using LBP, GIST and PHOG evaluated using ANN, KNN and RF classifier and tested on Swedish dataset. It is found that the combined feature set (LBP+PHOG +GIST) has better classification results and achieved 98.99% with 353.4 seconds and next highest results using the combination of LBP and GIST with accuracy 98.22% in 157.99 seconds using ANN.
Table 2(a). Analyse combination of feature set using Swedish Leaves
|
Classifier |
Combined Feature |
Swedish Leaves |
|
|
Acc(%) |
T(s) |
||
|
ANN |
LBP+GIST |
98.22 |
157.99 |
|
LBP+PHOG |
97.63 |
164.1 |
|
|
GIST+PHOG |
97.63 |
149.08 |
|
|
LBP+GIST+PHOG |
98.99 |
353.4 |
|
|
KNN |
LBP+GIST |
97.62 |
158.45 |
|
LBP+PHOG |
97.03 |
77.00 |
|
|
GIST+PHOG |
94.06 |
138.42 |
|
|
LBP+GIST+PHOG |
97.92 |
236.81 |
|
|
RF |
LBP+GIST |
97.03 |
169.54 |
|
LBP+PHOG |
95.54 |
88.03 |
|
|
GIST+PHOG |
94.36 |
148.23 |
|
|
LBP+GIST+PHOG |
97.92 |
184.40 |
|
Table 2(b). Analyze combination feature set using Flavia
|
Classifier |
Combined Feature |
Flavia Dataset |
|
|
Acc(%) |
T(s) |
||
|
ANN |
LBP+GIST |
97.08 |
297.27 |
|
LBP+PHOG |
95.83 |
186.56 |
|
|
GIST+PHOG |
95.83 |
248.00 |
|
|
LBP+GIST+PHOG |
97.50 |
321.32 |
|
|
KNN |
LBP+GIST |
93.54 |
279.39 |
|
LBP+PHOG |
94.37 |
142.14 |
|
|
GIST+PHOG |
91.04 |
205.76 |
|
|
LBP+GIST+PHOG |
95.41 |
360.57 |
|
|
RF |
LBP+GIST |
93.54 |
275.94 |
|
LBP+PHOG |
93.75 |
158.11 |
|
|
GIST+PHOG |
93.12 |
239.59 |
|
|
LBP+GIST+PHOG |
95.00 |
317.73 |
|
Table 2(b) analyses combinations of feature extraction techniques and evaluate with ANN, KNN and RF classifier tested on Flavia dataset and achieved better results 97.50% accuracy with 321.32 seconds using ANN.
Table 2(c) analyses combinations of feature extraction techniques with ANN, KNN and RF classifier tested on D Leaf dataset and achieved better results 94.84% accuracy with 242.16 seconds using ANN.
Table 2(c). Analysis of Combination feature set using D Leaf
|
Classifier |
Combined Feature |
D- Leaf Dataset |
|
|
Acc(%) |
T(s) |
||
|
ANN |
LBP+GIST |
92.78 |
215.98 |
|
LBP+PHOG |
92.26 |
217.85 |
|
|
GIST+PHOG |
90.20 |
196.86 |
|
|
LBP+GIST+PHOG |
94.84 |
242.16 |
|
|
KNN |
LBP+GIST |
86.30 |
172.51 |
|
LBP+PHOG |
86.82 |
77.29 |
|
|
GIST+PHOG |
74.41 |
164.14 |
|
|
LBP+GIST+PHOG |
87.85 |
201.03 |
|
|
RF |
LBP+GIST |
91.21 |
215.10 |
|
LBP+PHOG |
91.47 |
91.43 |
|
|
GIST+PHOG |
88.37 |
177.88 |
|
|
LBP+GIST+PHOG |
91.98 |
183.77 |
|
5.3 Evaluation of feature selection method for an optimal feature set
Table 3(a) analyses combined feature set using NCA, feature selection method and tested with Swedish leaves, Flavia and D Leaf dataset. Results show optimal feature set using NCA with ANN classifier provides better performance with accuracy 98.99% in 353.4 seconds on Swedish Leaves data.
Table 3(b) analyses combined feature set using ReliefF feature selection method and tested on Swedish leaves, Flavia, and D Leaf dataset. Results show optimal feature set using NCA with ANN classifier has 98.22% accuracy with 284.27 seconds on Swedish Leaves.
Table 3(c) analyses combined feature set using the MRMR feature selection method and tested on Swedish leaves, Flavia and D Leaf dataset. Results show optimal feature set using NCA with ANN classifier has better accuracy 97.63% with 392.01 seconds on Swedish Leaves.
From the above Table 3(a), (b), (c), found that NCA feature selection provides optimal feature set and it applied in ANN classifier on the Swedish Leaves dataset gave better accuracy.
Table 4 shows the number of features suitable for getting reasonable classification accuracy starting from 600 to 1400. It is found that increasing the number of features increases the accuracy with an increase in the computational time. After a certain number of features (here set 1000 features) the result may not much difference and this is done by trial and error mechanism. In Table 4 shows the average accuracy of the proposed model is 98.99% in 353.39seconds. The cross-entropy of the proposed classification model 0.0007 indicates a measure of performance of a model. When the network is learning, the model aims to get the lowest value of cross-entropy. The cross-entropy value goes to 0 indicates the model is better. The best validation performance is 0.002 in 54 epochs.
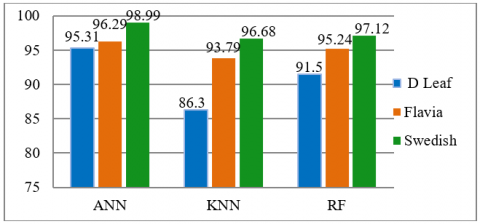
Figure 4 shows proposed model accuracy in different classifiers and datasets. This analysis shows that the proposed model has high accuracy (98.99%) using the ANN classifier and Swedish leaves dataset. This bar chart shows proposed model's performance using the Swedish, Flavia, and D-leaf datasets in all three classifiers (ANN, KNN, and Random forest (RF)).
Table 3(a). Analysis of combined feature set using NCA
|
Classifier |
Combined Feature set |
Swedish Leaves (Mean) |
Flavia dataset (Mean) |
D-Leaf dataset (Mean) |
|||
|
Acc(%) |
T(s) |
Acc(%) |
T(s) |
Acc(%) |
T(s) |
||
|
ANN |
LBP+GIST+PHOG |
98.99 |
353.4 |
97.50 |
321.32 |
94.84 |
242.16 |
|
KNN |
LBP+GIST+PHOG |
97.92 |
236.81 |
95.41 |
360.57 |
87.85 |
201.03 |
|
RF |
LBP+GIST+PHOG |
97.92 |
184.40 |
95.00 |
317.73 |
91.98 |
183.77 |
Table 3(b). Analysis of combined feature set using RelifF
|
Classifier |
Combined Feature set |
Swedish Leaves (Mean) |
Flavia dataset (Mean) |
D-Leaf dataset (Mean) |
|||
|
Acc(%) |
T(s) |
Acc(%) |
T(s) |
Acc(%) |
T(s) |
||
|
ANN |
LBP+GIST+PHOG |
98.22 |
284.27 |
96.67 |
415.37 |
92.26 |
246.53 |
|
KNN |
LBP+GIST+PHOG |
95.52 |
251.10 |
93.79 |
376.60 |
86.56 |
195.76 |
|
RF |
LBP+GIST+PHOG |
95.84 |
171.77 |
94.79 |
283.65 |
91.98 |
232.24 |
Table 3(c). Analysis of combined feature set using MRMR
|
Classifier |
Combined Feature set |
Swedish Leaves (Mean) |
Flavia dataset (Mean) |
D-Leaf dataset (Mean) |
|||
|
Acc(%) |
T(s) |
Acc(%) |
T(s) |
Acc(%) |
T(s) |
||
|
ANN |
LBP+GIST+PHOG |
97.63 |
392.01 |
97.50 |
794.72 |
93.29 |
313.75 |
|
KNN |
LBP+GIST+PHOG |
97.32 |
389.54 |
90.20 |
685.54 |
82.94 |
239.23 |
|
RF |
LBP+GIST+PHOG |
95.54 |
371.58 |
94.58 |
678.24 |
87.33 |
261.09 |
Table 4. Effect of increasing the number of different features on the accuracy of the Swedish Leaves dataset
|
Method |
No.of feature |
Precision (Mean) |
Recall (Mean) |
F1 Score (Mean) |
Accuracy % (Mean) |
Time(s)(Mean) |
Cross-Entropy (Mean) |
Best validation (mean) |
Epoch (Mean) |
|
LBP+PHOG+ GIST |
600 |
0.9791 |
0.9778 |
0.9785 |
97.99 |
335.62 |
0.0009 |
0.0033 |
53.20 |
|
700 |
0.9853 |
0.9877 |
0.9865 |
98.64 |
344.69 |
0.0008 |
0.0032 |
59.00 |
|
|
800 |
0.9812 |
0.9789 |
0.9808 |
97.99 |
358.85 |
0.0010 |
0.0144 |
54.30 |
|
|
900 |
0.9815 |
0.9807 |
0.9811 |
97.99 |
394.70 |
0.0010 |
0.0038 |
52.10 |
|
|
1000 |
0.9908 |
0.9906 |
0.9907 |
98.99 |
353.39 |
0.0007 |
0.0029 |
54.30 |
|
|
1100 |
0.9883 |
0.9846 |
0.9865 |
98.70 |
403.61 |
0.0007 |
0.0029 |
51.50 |
|
|
1200 |
0.9839 |
0.9831 |
0.9835 |
98.28 |
369.33 |
0.0007 |
0.0024 |
52.40 |
|
|
1300 |
0.9822 |
0.9841 |
0.9832 |
98.22 |
384.21 |
0.0012 |
0.0051 |
51.61 |
|
|
1400 |
0.9716 |
0.9833 |
0.9774 |
97.63 |
438.64 |
0.0010 |
0.0046 |
55.20 |
Figure 4. Comparison of proposed model with classifiers and dataset
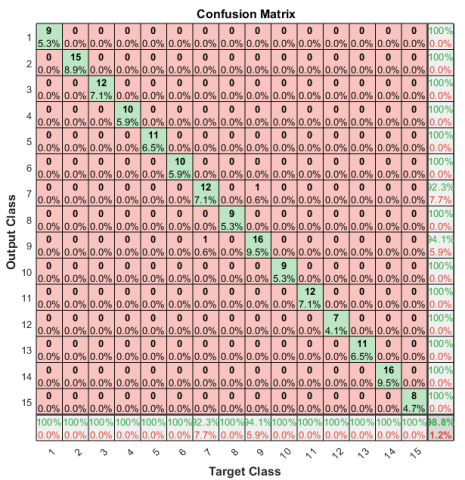
Confusion metrics are used to measure how many predicted classes were correctly predicted or not. Figure 5 represents target class indicates the actual class of plant leaf and the output class is the predicted class corresponding to the target class. Here class 7 is correctly predicted 12 plants and incorrectly predicted one. Class 9 correctly predicted 16 times and incorrectly predicted one. Diagonal values indicate correctly predicted results of each class.
Figure 5. Confusion matrix
Here have four parameters TP, TN, FP, FN.In multi-class, the diagonal value of the confusion matrix is the TP of the corresponding class. The total number of TN for a specific class will be the sum of all columns and rows, excluding that class's column and row. The total number of FP's for a class is the sum of values in the corresponding column, excluding the TP values. FN is the sum of values in the corresponding row, excluding the TP value.
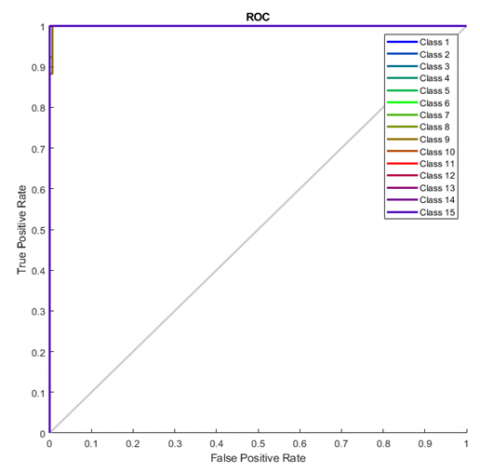
Figure 6 shows Receiver Operating Characteristics to analyze and visualize the performance of the output of a classifier. The X-axis represents a false positive rate (1- Specificity), and the Y-axis represents a true positive rate (Sensitivity). Here uses the one verse all method and get the ROC curve for each class. The top left corner of ROC plot is the ideal point. At this point, a false positive rate is zero, and a true positive rate is one. Here class 9th curve does not exactly match with this line, and all others approximately matched. From this analysis found that the model classified well.
Figure 6. Receiver characteristic curve
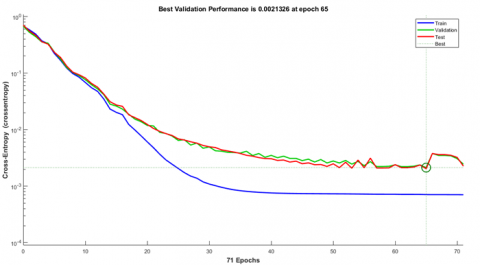
In Figure 7 network performance of proposed model shows the three curves indicating training, validation, and test performance of the proposed model. The X-axis represents the number of epochs. Y-axis represents a loss. Here used the cross-entropy loss function, and its loss value of 0.0 is the perfect model. These three lines indicate training, validation, and test curve. These three curves are diminishing, so the model does not have an overfitting problem. The best validation performance of this model is 0.0021326 at epoch 65, and the total number of epochs is 75.
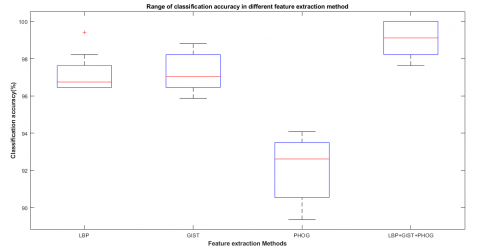
Figure 8 represents a standardized way of displaying data distribution based on the minimum, first quartile, median, third quartile, and maximum values. Figure 7 shows the range of model accuracy and determines how tightly grouped classification accuracy. After the ten executions, LBP's minimum accuracy is 96.45%, and the maximum is 99.41%. GIST minimum accuracy is 95.86%, and the maximum is 98.82%, PHOG minimum accuracy is 89.35% and maximum 94.08%, proposed model minimum accuracy is 97.63%, and the maximum is 100%. The Red line indicates the median value of the classification accuracy.
Figure 7. Network training, validation & test performance
Figure 8. Box plot for accuracy range of feature method
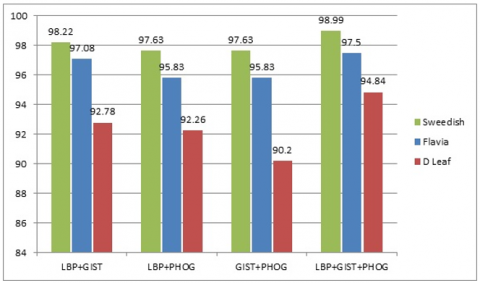
In the Figure 9 represent X-axis represents the combination of feature set and Y-axis represent the classification of accuracy. This bar graph shows that the Swedish leaves dataset has slightly better performance than the flavia and D leaf dataset in all the combination feature sets.
Figure 9. Dataset comparisons using proposed model (NCA)
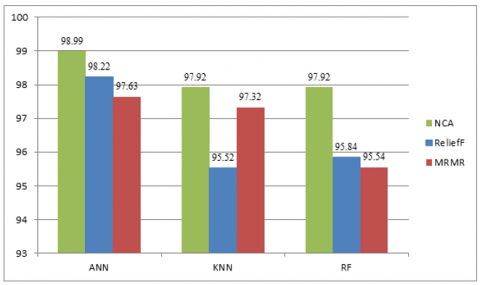
As shown in the Figure 10 X-axis represents classifiers, and Y-axis represents classification accuracy. Compare filter feature selection methods such as NCA, ReliefF, MRMR using a combined feature set with classifiers. NCA feature selection method achieved better performance in each classifier than ReliefF and MRMR in this particular application.
Figure 10. Comparison of feature selection method using Swedish leaves
Table 5 shows a comparison of the proposed classification model with existing methods. The proposed method has the highest average classification accuracy with 98.99%. The average precision-recall and F1 Score obtained are 0.9908,0.9906, and 0.9907, respectively in Table 4.
Table 5. Comparison of the proposed model with recent models
|
Classifier |
Feature method |
Acc (%) |
|
1-NN [37] |
MTD+LBP(HF) |
99.1 |
|
SVM [38] |
Color Features |
94.65 |
|
DT with PBPSO [39] |
GIST, LBP, geometric features |
98.58 |
|
MLP [40] |
features discriminable using the Fisher vector |
94.3 |
|
OMNCNN [41] |
----- |
98.70 |
|
CNN [42] |
GLCM and Canny Edge detection |
97.82 |
|
CNN ResNet18, ResNet34, ResNet50 [43] |
------ |
99 |
|
CNN ResNet50 [44] |
----- |
98.60 to 99.70 |
|
Proposed Technique |
LBP+GIST+PHOG |
98.99 |
This paper experimentally analyzed five feature extraction techniques, namely LBP, GIST PHOG, GLCM, and HOG to extract plant leaf images using Swedish leaves, Flavia, and D leaf datasets. In this experiment, LBP achieves 97.22% with 140.49 seconds run time, GIST is 97.22% with 222.92 seconds and GLCM is 80.47% with 33.25 seconds using ANN classifier with the Swedish leaves dataset, PHOG is 93.62% with 39.81 seconds and HOG is 90.21% with 847.36 seconds using RF classifier with the Swedish leaves dataset. Based on the above highest accuracy values obtained from Table 1(a), (b), (c), choose LBP, GIST, and PHOG feature extraction techniques for finding optimal feature set. It is found that the combined feature extraction method has achieved better results than the single features extraction method. For optimal feature set selection NCA is used and to reduce the size of the feature set. After evaluating NCA and ReliefF, MRMR results, NCA has better feature selection techniques in this model. The model achieved 98.99% classification accuracy in 353.39 seconds (Table 4) for the optimal feature set using ANN with the Swedish Leaves dataset. Plant species classification explored with deep learning techniques with the newly created dataset will be future work.
[1] Ellis, B., Daly, D.C., Hickey, L.J., Johnson, K.R., Mitchell, J.D., Wilf, P., Wing, S.L. (2009). Manual of Leaf Architecture. Published in Association with the New York Botanical Garden.
[2] Wäldchen, J., Rzanny, M., Seeland, M., Mäder, P. (2018). Automated plant species identification—Trends and future directions. PLoS Computational Biology, 14(4): e1005993. https://doi.org/10.1371/journal.pcbi.1005993
[3] Le, V.N.T., Apopei, B., Alameh, K. (2019). Effective plant discrimination based on the combination of local binary pattern operators and multiclass support vector machine methods. Information Processing in Agriculture, 6(1): 116-131. https://doi.org/10.1016/j.inpa.2018.08.002
[4] Narayan, V., Subbarayan, G. (2014). An optimal feature subset selection using GA for leaf classification. The International Arab Journal of Information Technology, 11(5): 447-451. https://ccis2k.org/iajit/PDF/vol.11,no.5/4924.pdf.
[5] Zhao, C., Chan, S.S., Cham, W.K., Chu, L.M. (2015). Plant identification using leaf shapes—A pattern counting approach. Pattern Recognition, 48(10): 3203-3215. https://doi.org/10.1016/j.patcog.2015.04.004
[6] Munisami, T., Ramsurn, M., Kishnah, S., Pudaruth, S. (2015). Plant leaf recognition using shape features and colour histogram with K-nearest neighbour classifiers. Procedia Computer Science, 58: 740-747. https://doi.org/10.1016/j.procs.2015.08.095
[7] Naresh, Y.G., Nagendraswamy, H.S. (2016). Classification of medicinal plants: An approach using modified LBP with symbolic representation. Neurocomputing, 173: 1789-1797. https://doi.org/10.1016/j.neucom.2015.08.090
[8] Yang, C., Wei, H., Yu, Q. (2016). Multiscale triangular centroid distance for shape-based plant leaf recognition. In ECAI, pp. 269-276. https://doi.org/10.3233/978-1-61499-672-9-269
[9] Rzanny, M., Seeland, M., Wäldchen, J., Mäder, P. (2017). Acquiring and preprocessing leaf images for automated plant identification: Understanding the tradeoff between effort and information gain. Plant Methods, 13(1): 1-11. https://doi.org/10.1186/s13007-017-0245-8
[10] Begue, A., Kowlessur, V., Mahomoodally, F., Singh, U., Pudaruth, S. (2017). Automatic recognition of medicinal plants using machine learning techniques. International Journal of Advanced Computer Science and Applications, 8(4): 166-175.
[11] Kan, H.X., Jin, L., Zhou, F.L. (2017). Classification of medicinal plant leaf image based on multi-feature extraction. Pattern Recognition and Image Analysis, 27(3): 581-587. https://doi.org/10.1134/S105466181703018X
[12] Hewitt, C., Mahmoud, M. (2018). Shape-only features for plant leaf identification. arXiv preprint arXiv:1811.08398.
[13] Ali, R., Hardie, R., Essa, A. (2018). A leaf recognition approach to plant classification using machine learning. In NAECON 2018-IEEE National Aerospace and Electronics Conference, Dayton, OH, USA, pp. 431-434. https://doi.org/10.1109/NAECON.2018.8556785
[14] Salve, P., Sardesai, M., Yannawar, P. (2018). Classification of plants using GIST and LBP score level fusion. In International Symposium on Signal Processing and Intelligent Recognition Systems, pp. 15-29. https://doi.org/10.1007/978-981-13-5758-9_2
[15] Mostajer Kheirkhah, F., Asghari, H. (2019). Plant leaf classification using GIST texture features. IET Computer Vision, 13(4): 369-375. https://doi.org/10.1049/iet-cvi.2018.5028
[16] Kuang, H., Ding, Y., Li, R., Liu, X. (2018). Defect detection of bamboo strips based on LBP and GLCM features by using SVM classifier. In 2018 Chinese Control and Decision Conference (CCDC), Shenyang, China, pp. 3341-3345. https://doi.org/10.1109/CCDC.2018.8407701
[17] Pacifico, L.D., Britto, L.F., Oliveira, E.G., Ludermir, T.B. (2019). Automatic classification of medicinal plant species based on color and texture features. In 2019 8th Brazilian Conference on Intelligent Systems (BRACIS), Salvador, Brazil, pp. 741-746. https://doi.org/10.1109/BRACIS.2019.00133
[18] Sujith, A., Neethu, R. (2021). Classification of plant leaf using shape and texture features. In Inventive Communication and Computational Technologies, pp. 269-282. https://doi.org/10.1007/978-981-15-7345-3_22
[19] Ahmed, N., Asif, H.M.S., Saleem, G. (2021). Leaf Image-based Plant Disease Identification using Color and Texture Features. arXiv preprint arXiv:2102.04515. https://arxiv.org/abs/2102.04515.
[20] Söderkvist, O. (2001). Computer vision classification of leaves from Swedish trees. https://www.cvl.isy.liu.se/en/research/datasets/swedish-leaf/, accessed on 12 July 2021.
[21] Wu, S.G., Bao, F.S., Xu, E.Y., Wang, Y.X., Chang, Y.F., Xiang, Q.L. (2007). A leaf recognition algorithm for plant classification using probabilistic neural network. In 2007 IEEE International Symposium on Signal Processing and Information Technology, Giza, Egypt, pp. 11-16. https://doi.org/10.1109/ISSPIT.2007.4458016
[22] Tan, J.W., Chang, S.W. (2018). D-Leaf Dataset. https://doi.org/10.6084/m9.figshare.5732955.v1
[23] Hamuda, E., Glavin, M., Jones, E. (2016). A survey of image processing techniques for plant extraction and segmentation in the field. Computers and Electronics in Agriculture, 125: 184-199. https://doi.org/10.1016/j.compag.2016.04.024
[24] Mythili, C., Kavitha, V. (2011). Efficient technique for color image noise reduction. The Research Bulletin of Jordan ACM, 2(3): 41-44.
[25] Oliva, A., Torralba, A. (2001). Modeling the shape of the scene: A holistic representation of the spatial envelope. International Journal of Computer Vision, 42(3): 145-175. https://doi.org/10.1023/A:1011139631724
[26] Prakasa, E. (2016). Texture feature extraction by using local binary pattern. INKOM Journal, 9(2): 45-48.
[27] Amirshahi, S.A., Koch, M., Denzler, J., Redies, C. (2012). PHOG analysis of self-similarity in aesthetic images. In Human Vision and Electronic Imaging XVII, 8291: 82911J. https://doi.org/10.1117/12.911973
[28] Ehsanirad, A., YH, S.K. (2010). Leaf recognition for plant classification using GLCM and PCA methods. Oriental Journal of Computer Science and Technology, 3(1): 31-36. http://www.computerscijournal.org/?p=2180.
[29] Dalal, N., Triggs, B. (2005). Histograms of oriented gradients for human detection. In 2005 IEEE Computer Society Conference on Computer Vision and Pattern Recognition (CVPR'05), San Diego, CA, USA, Vol. 1, pp. 886-893. https://doi.org/10.1109/CVPR.2005.177
[30] Soofivand, M.A., Amirkhani, A., Daliri, M.R., Rezaeirad, G. (2014). Feature level combination for object recognition. In 2014 4th International Conference on Computer and Knowledge Engineering (ICCKE), Mashhad, Iran, pp. 559-563. https://doi.org/10.1109/ICCKE.2014.6993395
[31] Manit, J., Youngkong, P. (2011). Neighborhood components analysis in sEMG signal dimensionality reduction for gait phase pattern recognition. In 7th International Conference on Broadband Communications and Biomedical Applications, Melbourne, VIC, Australia, pp. 86-90. https://doi.org/10.1109/IB2Com.2011.6217897
[32] Robnik-Šikonja, M., Kononenko, I. (2003). Theoretical and empirical analysis of ReliefF and RReliefF. Machine Learning, 53(1): 23-69. https://doi.org/10.1023/A:1025667309714
[33] Ding, C., Peng, H. (2005). Minimum redundancy feature selection from microarray gene expression data. Journal of Bioinformatics and Computational Biology, 3(02): 185-205. https://doi.org/10.1142/S0219720005001004
[34] Şekeroğlu, B., İnan, Y. (2016). Leaves recognition system using a neural network. Procedia Computer Science, 102: 578-582. https://doi.org/10.1016/j.procs.2016.09.445
[35] Zhang, S., Li, X., Zong, M., Zhu, X., Wang, R. (2017). Efficient kNN classification with different numbers of nearest neighbors. IEEE Transactions on Neural Networks and Learning Systems, 29(5): 1774-1785. https://doi.org/10.1109/TNNLS.2017.2673241
[36] Pal, M. (2003). Random forests for land cover classification. IGARSS 2003. 2003 IEEE International Geoscience and Remote Sensing Symposium. Proceedings (IEEE Cat. No.03CH37477), pp. 3510-3512. https://doi.org/10.1109/IGARSS.2003.1294837
[37] Yang, C. (2021). Plant leaf recognition by integrating shape and texture features. Pattern Recognition, 112: 107809. https://doi.org/10.1016/j.patcog.2020.107809
[38] Shrivastava, V.K., Pradhan, M.K. (2021). Rice plant disease classification using color features: A machine learning paradigm. Journal of Plant Pathology, 103(1): 17-26. https://doi.org/10.1007/s42161-020-00683-3
[39] Keivani, M., Mazloum, J., Sedaghatfar, E., Tavakoli, M.B. (2020). Automated analysis of leaf shape, texture, and color features for plant classification. Traitement du Signal, 37(1): 17-28. https://doi.org/10.18280/ts.370103
[40] Kurmi, Y., Gangwar, S., Agrawal, D., Kumar, S., Srivastava, H.S. (2021). Leaf image analysis-based crop diseases classification. Signal, Image and Video Processing, 15(3): 589-597. https://doi.org/10.1007/s11760-020-01780-7
[41] Ashwinkumar, S., Rajagopal, S., Manimaran, V., Jegajothi, B. (2021). Automated plant leaf disease detection and classification using optimal MobileNet based convolutional neural networks. Materials Today: Proceedings. https://doi.org/10.1016/j.matpr.2021.05.584
[42] Nigam, S., Jain, R. (2020). Plant disease identification using deep learning: A review. Indian Journal of Agricultural Sciences, 90: 249-257.
[43] Afifi, A., Alhumam, A., Abdelwahab, A. (2021). Convolutional neural network for automatic identification of plant diseases with limited data. Plants, 10(1): 28. https://doi.org/10.3390/plants10010028
[44] Taslim, A., Saon, S., Muladi, M., Hidayat, W.N. (2021). Plant leaf identification system using convolutional neural network. Bulletin of Electrical Engineering and Informatics, 10(6): 3341-3352. https://doi.org/10.3390/plants10010028i.org/10.11591/eei.v10i6.2332