Zarith Liyana Zahari* | Mahfuzah Mustafa | Zaridah Mat Zain | Rafiuddin Abdubrani | Faradila Naim
© 2021 IIETA. This article is published by IIETA and is licensed under the CC BY 4.0 license (http://creativecommons.org/licenses/by/4.0/).
OPEN ACCESS
The prolonged stress needs to be determined and controlled before it harms the physical and mental conditions. This research used questionnaire and physiological approaches in determine stress. EEG signal is an electrophysiological signal to analyze the signal features. The standard features used are peak-to-peak values, mean, standard deviation and root means square (RMS). The unique features in this research are Matthew Correlation Coefficient Advanced (MCCA) and multimodal capabilities in the area of frequency and time-frequency analysis are proposed. In the frequency domain, Power Spectral Density (PSD) techniques were applied while Short Time Fourier Transform (STFT) and Continuous Wavelet Transform (CWT) were utilized to extract seven features based on time-frequency domain. Various methods applied from previous works are still limited by the stress indices. The merged works between quantities score and physiological measurements were enhanced the stress level from three-levels to six stress levels based on music application will be the second contribution. To validate the proposed method and enhance performance between electroencephalogram (EEG) signals and stress score, support vector machine (SVM), random forest (RF), K- nearest neighbor (KNN) classifier is needed. From the finding, RF gained the best performance average accuracy 85% ±10% in Ten-fold and K-fold techniques compared with SVM and KNN.
stress, EEG, MCCA, multimodal, indices, accuracy
Stress is an environmental pressure that can harm the physical, emotional, or physiological strain. Stress has a huge impact on mental well-being and will also cause a detrimental repercussion on the human body, particularly mental health disorder. The physiological signal is defined as a signal that is generated and contains information that can be extracted from this signal. The signal enables to examine the physiological system's functioning. The stress features are analyzed from physiological signal measurement to present in various ways such as level classification and quantities scale deriving from a questionnaire. The physiological measurement in stress detection is countable for most researchers because it is performed with high accuracy and reliability with low-cost efficiency. The stress detection system is founded on the link between the numerical scales in the questionnaire but the real discrepancy existed between the calculated stress score and the actual stress environment [1]. Therefore, most researchers recognized the physiological measurement as the actual stress condition. The Electroencephalogram (EEG) signal is used as a physiological measurement to observe the mental stress signal. For quantities scale, a self-assessment stress questionnaire is being used to identify the stress level such as Perceived Stress Scale (PSS) [2], State-Trait Anxiety Inventory (STAI) [3], Depression Anxiety Stress Scale (DASS-21) [4], and International Stress Management Association (ISMA) [5] are some examples of self-assessment stress questionnaire to recognize the human stress condition. In order to explore the human stress level in stress classification, a combination of physiological measurement and a self-stress assessment questionnaire implementation as features is important. Currently, most of the quantities scale for stress level is presented in low, medium, and high-stress levels. Even though, many methods are used to present the reliability and validity of works in stress level with high accuracy result but have a limited existing approach appear in the stress level improvements. Due to this reason, there is a need to improve stress levels, such as in this study works, which improved stress levels from three to six indices based on EEG signal stimuli features and an ISMA self-assessment stress questionnaire. The MCC application is extensively applied in previous works, but the lack of gain a high accuracy performance. Consequently in this works, the EEG signal stimuli from the music application feature applied the Matthew Correlation Coefficient Advanced (MCCA) and multimodal as a possibility features with three types of the classifier as validation features to measure the accuracy performance.
The EEG is a part of electrophysiological signal monitoring the signal communication and impulse activity in the desired region on the scalp region. The scalp region divides by the left and right hemisphere area described by the International Federation in Electroencephalography and Clinical Neurophysiology adapted standardization 10-20 electrode placement system. There are various techniques have been applied to examine and analyze the EEG signal [6-8] in signal processing. As a result, most scientists decide to utilize signal processing capabilities and functionality as a method implementation advantage. The advantages of method will be used to determine the standard amplitude and frequency bands in EEG signal. The standard amplitude of EEG signal was found by using a band-pass filter technique in the frequency domain [9]. The purpose of determining the standard amplitude is to remove the noise signal contains in the EEG signal. The EEG frequency band consists of five bands which a divergent description function as mention in Table 1 below [10]. Recent studies have revealed that the EEG signal frequency bands are compatible for implementation in signal processing. However, in this research the frequency band range was chosen from 0.5Hz to 16Hz.
Table 1. Overview of frequency band in EEG signal
|
Frequency band |
Frequency range (Hz) |
Description |
|
delta |
0.5-4 |
Slumber |
|
theta |
4-7 |
Early-stage of rest, sleep or drowsiness |
|
alpha |
8-12 |
Awake and resting |
|
beta |
13-16 |
Awake with high mental activity |
|
gamma |
16-40 |
Extremely high mental activity |
The consequence after eliminating the EEG signal noise and filtering the frequency bands is the features extraction stage. The features extraction stage is involved in the sphere of frequency and time-frequency domain. These domain characteristics were endowed with the ability to run the classifier effectively [11]. The EEG data should be evaluated spectrally and the frequency sphere's properties examined using Power Spectral Density (PSD). The works of Mert and Akan [12] have utilized the PSD method in order to estimate the power ratio and power intensity which extracted from the frequency domain [13]. Aside from power ratio and power intensity, power distribution in EEG data can also be evaluated using a PSD approach in the frequency domain. Akin and Aslan [14] discussed that the Short-Time Fourier Transform (STFT) is pertinent in relation to present the EEG signal and Continuously Wavelet transform (CWT) in the time-frequency region to determine the energy distribution value is stated by Ieracitano et al. [15]. Hence, these researchers used STFT and CWT to determine the energy distribution value. The energy distribution is also considered as a familiar feature for EEG signal analysis. In addition to these approaches, the result of power distribution value and energy distribution value in the area frequency time-frequency to find the peak-to-peak value, mean, standard deviation, root means square (RMS) were employed as potential features. Although these features were being used as common features, this work is innovative in how it addresses the research gap. Whereby, the unique of research is MCCA and multimodal features will be also added as the features. Seven features will be used in signal processing in order to improve the stress indices level for four frequency band.
The overview of MCCA and multimodal features are described in this part. The MCCA was modified method from Matthew correlation coefficient (MCC) method. The origin function of MCC is to measure unbalanced data in large data sizes in the range from -1 to 1. Another function is capability of measuring the predicted and classes of various functions [16-18]. In some cases, the accuracy of the MCC measurement prior works but limited to address the best accuracy performance to show the features obtained which produce the better result. Due to this issue, MCCA is established for improvement purposes. MCCA is an advanced method which is an enhancement parameter from the MCC concept. The advantage of this MCCA is it produces a high accuracy performance compare with the origin MCC [19] based on music application. The modalities understanding can be described as a consideration process of separate that can be visible for one modality while blind to others. Separate unimodal data from the start, then gather information into extracted features and perform an action [20]. The involved process leads to achieve the optimal result in the classification process. In summary, the purpose of adding the MCCA and multimodal is because both features show high accuracy and optimal result for enhancing the indices of stress level from three indices to six stress levels.
Besides overcoming the research gap problem, the classifier part is an important aspect to be considered in exploring the enhancement of the stress level. Some works in EEG signal processing features and classifier will be used in computational methods approach likes support vector machine (SVM), random forest (RF), and K- nearest neighbor (KNN). These works for stress classifiers are done by Al-Shargie [21] for SVM, KNN [22] and RF [23] used to present the reliability of computational methods classifier works. This research also applied this classifier method to recognize human stress levels. The point of a classifier has introduced the distribution of stress conditions, but the other computational implication can be considered in this research is signal processing based on music application. The proposed of presenting the music listening implementation because it will manifest the anxiety, stress, and relaxation in human. The simulation experience from music listening response influences the physiological signal in the human brain [24]. From the brain responses to the signal, music can calm the emotion and be considered as a part of alternative therapy to humans [25] and some investigation works to analyze the music level in low and high rhymes are done by Alipour et al. [26]. Similar approaches have been used in this research to identify the human stress level. The music approach describes as the baby rhythm for low rhymes and pop-punk for high rhymes.
The physiological signal in stress indices measurement approach is acceptable to be analyzed. However, the stress level improvement is identified as research gap for the study due to the previous studies pursued insufficiently. From this gap, this study will extend the characterization of human stress level up to six levels approach. The extended of stress level would be able to perform the significant correlation exists between physiological signal and quantities scale in numerical scale.
These studies assure a better understanding of enhancement of stress indices based on physiological signal and self-stress assessment which started by explanation about overview of stress and followed by the EEG signal characteristic. Signal processing features, extraction and classification would be the participant in the main contribution achieved and aim. Therefore, the paper primary contribution can be explained simply as follows:
1. The proposed MCCA and multimodal features from EEG signal for frequency and time-frequency domain analysis to achieve the high human stress accuracy.
2. The new development of features extraction from EEG signal will be enhance the stress level from three-level to six stress levels based on music application.
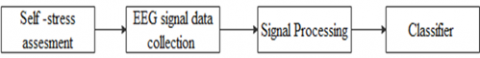
The proposed frameworks to improve the stress level indices using common and proposed features in responses to two different types music rhythms and relaxed conditions using EMOTIV headband. Refer to Figure 1 shows the system enhancement is consists of four steps which are self-assessment questionnaire, EEG data collection, signal processing, and classification. The self-assessment stress ISMA questionnaire applied to recognized human stress levels in a qualitative score. The EEG signal of 34 subjects is recorded using EMOTIV headband responses to two different musical rhythms and in relaxed conditions. For signal processing stage, it filtered the raw EEG signal in pre-processing part and features extraction were described about the standard features, MCCA and multimodal features extracted from four frequency bands for each subject. Three principal stress classifiers will be able to characterize human depression into six stress levels. The validation of stress indices level, Ten-fold cross-validation and k-fold are used which splits the data into ten segmentations. The segmentation contains 90% for training and 10% for testing. The following subsection describes the details for each block.
Figure 1. The framework of stress enhancement using self-stress assessment and EEG signal
2.1 Self-stress assessment questionnaire
ISMA stress questionnaire is a self-assessment to recognize human stress levels. This assessment contains 25 questions and written in English. Therefore, the subject needs to comprehend the question in English language before choosing the answer. All subjects need to answers all questions and tick only one answer for each question. The tick box shows either a yes or no answer. The yes answer score is one and the no answer score is zero. Then, sum the total answer score to diagnose the stress level. From the ISMA questionnaire, total scores were diagnosed subject in three levels but the enhancement of this level produced six stress levels. The value of fractional stress level measurement has been calculated experimentally using standard deviation value 3.76 ± 4 [27, 28]. The proposed six stress levels are obtained directly from the standard deviation techniques described in Table 2 below.
Table 2. Stress level description
|
Level |
Score |
Stress State |
|
L1 |
0-3 |
No stress |
|
L2 |
4 -7 |
Low stress |
|
L3 |
8-11 |
Mild stress |
|
L4 |
12-15 |
Moderate Stress |
|
L5 |
16-19 |
Severe stress |
|
L6 |
20-25 |
Extreme stress |
2.2 EEG signal
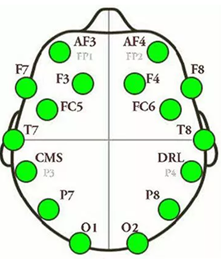
The subject's experiment is carried out under the ethical identity number IREC 2021-039, which has been accepted by the IIUM Research Ethics Committee (IREC). In the experimental data collection, 34 subjects were located in a comfortable place with a quiet environment. The subject was instructed to sit comfortably on the chair and was encouraged to move as little as possible during the session. Subjects were directed to answer the self-assessment stress questionnaire. Then, sum up the score of the subject to measure the latest condition in which the condition level was designed by ISMA. For the offline recording of the brain signal of the participants, this experiment was using EMOTIV Epoc+ headband device with targeted areas in the frontal left and right areas. The channel position divide into an odd number (AF3, F7, F3, FC5, and T7) in the left and an even number (AF4, F4, F8, FC6, and T8) in the right position as shown in Figure 2. This device is designated with a saline-based electrode up to 14 channels EEG. It is also wirelessly connected with 9 axis motion sensors. An earphone device is used while listening to music. The EEG data were collected while listening to two types of music and relaxed. Each condition was recorded for four minutes.
Figure 2. Emotive electrode placement
2.3 Signal processing
In signal processing, it contains a four sub-section topic which begin with pre-processing and features extraction. Then, follow by MCCA and multimodal. This sub-section will be thoroughly discussed below.
2.3.1 Pre-processing
In this section, it describes the signal processing function of EEG signal that involved pre-processing and features extraction. In pre-processing, the raw EEG signal needs to be filtered to gain a standard EEG signal amplitude range between -100 μv until 100 μv by using the bandpass filter technique. Then, the frequency band was obtained in four frequency bands which are delta (0.5-4Hz), theta (4-7 Hz), alpha (8-12Hz), and beta (13-16Hz).
2.3.2 Features extraction
For features extraction, seven features established from the EEG signal that includes MCCA and multimodal features for each subject. All features are obtained in the concept of frequency and time-frequency analysis. The estimation features like coefficient power and power distribution are measured by filtering the bands properly in frequency domain analysis [29, 30]. The power distribution value was expending the function in common features such as minimum, maximum, and mean [31]. Concurrent works from the common features, Kumari and Abirami [32] has also considered the standard deviation and root mean square features in PSD to be evaluated in signal detection and classification process. The PSD method's features have been widely acknowledged in prior studies, therefore, it can be considered to be used in this paper.
To make it simple, time-frequency domain is defined as a production of signal occur in both time and frequency spectrum in EEG signal. Continuous Wavelet Transform (CWT) and Short Time Fourier Transform (STFT) methods in the area of time-frequency are most widely used to measure energy value [33]. The existing value can be modified to derive the minimum, maximum, and median features value in the time-frequency domain [34]. The CWT method approach determined the standard deviation and root mean square features [35]. Similar works of method and features have also been used in this research works for the time-frequency domain. Although the same approach is exploited in this work for both domains, the stated idea of the MCCA and multimodal should be taken in features benefit.
2.3.3 MCCA
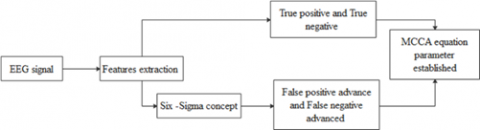
MCCA is a more sophisticated approach which could solve the accuracy issue in Matthew Correlation Coefficient (MCC) that be previously address in this research. Utilizing the MCCA function, the enhancement in MCC can be resolved in a solution manner using an Eq. (1) and illustrate the process in Figure 3. The process of MCCA is started with gained EEG signal, then obtained a features extraction from the signal. Next is identifying TP and TN of the parameter's value. Lastly, calculated the advanced value that can be devised based on six-sigma concept. The description for equation is T is for true, while P is for positive, and N for negative value, FPa is false positive advance, and FNa is false negative advanced. A true positive and true negative value is directly obtained from the EEG signal features while false positive advanced and false negative advanced is gained from the calculation method. The simplest calculation method used in both advance parameters is by multiplying the false positive and false negative value up to six times. The approach of six times is based from six-sigma concepts, where this capable in offering a viable solution in accuracy performance. As implemented in this research, the six-sigma notion is to improve the measurement approach in engineering problems [36].
Figure 3. The illustration process of MCCA parameter establish
$M C C A=\frac{T P \times T N-F P_{a} \times F N_{a}}{\sqrt{\left(T P+F P_{a}\right)\left(T P+F N_{a}\right)\left(T N+F P_{a}\right)\left(T N+F N_{a}\right)}}$ (1)
2.3.4 Multimodal
Multimodal leads to resolve the accuracy of practical issue of the classifier process that has been discussed in introduction. The outcome of these issues is highlighted in Eq. (2) below. In this equation applied three important parameters to measure the multimodal features. These three parameters are α, for weighted factor, $p_{e e g}^{x}$ , for EEG signal features and $p_{\text {music }}^{x}$ , for music types. The equation has been expressed in the weighted factors by referring to the stress level in ISMA stress categories, the EEG signal features being analyzed in spectrum frequency domain and time-frequency spectrum and music types are defined in low and high rhymes. Then, all the parameter values was calculated to show the significant of parameter and determined the multimodal results.
$p_{\text {multimodal }}^{x}=a p_{\text {eeg }}^{x}+(1-a) p_{\text {music }}^{x}$ (2)
2.4 Classifier
The classifier part is a major concern for examining the enhancement of stress levels in performance measurement, especially in accuracy results. A second issue is an improvement from three to six levels based on the questionnaire and EEG signal. Therefore, this research was employed multiple classifiers methods to validate the result. The validation was performed in order to provide confident results using SVM, KNN, and RF methods for frequency domain and time-frequency domain analysis. A new dataset for EEG signal based on music application was used to simulate the kernel polynomial parameter in SVM classifier is a different approach [7]. However, this approach applied the same implementation of data division. Further confirmed classifier works are given by the studies [2, 21] that show the SVM is capable of reducing the over-fitting risk and produce high efficient measurement. For KNN classifier, it has been experimentally demonstrated in several techniques of data segmentation [37-39]. Nevertheless, the KNN parameter used in this study when k is 1 in ratio of 9(training): 1(testing) values in order to evaluate the merged features in physiological measurement and a self-stress assessment. The estimation of decision classifier on various sample datasets in predictive accuracy performance is proved by applied RF classifier. This classifier is tested using 200 tresses and the ‘bag’ parameter for Ten-fold cross-validation and k-fold supported by the researches [37, 40]. Additionally, cross validation applied two techniques are dependent and independent techniques. The purposed of applied different techniques of cross validation is to test and analyzes the effect of random variables or dependent variables in scientific measurement. Therefore, dependent for Ten-fold method and independent for K-fold method is used.
This section summarizes the finding and contributions works made into three parts. Firstly, were explained the finding for the enhancement of stress level using a self-stress assessment. Next, the filtered EEG signal result will be shown. Lastly, the attribute result of physiological measurement and a self-stress evaluation utilizing a classifier mechanism with signal processing will also be discussed.
3.1 Self-stress assessment questionnaire
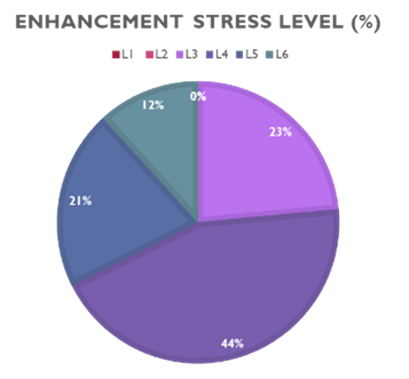
A pie diagram of stress level is illustrated in percentage result is shown in two figures. The figures are the results measurement from ISMA scoring value and the enhancement works of stress indices. Using the enhancement approach stress level from three to six levels for analyzing data be proved in Figure 4 (a) when the scoring result shown in percentage format for each stress level after improvement implementation. The observation from the result of improvement seems to indicate that 0% for L1 and L2. Then follows by L3 is 23% while L4 is 44%. Next, L5 is 21%. Lastly is 13% for L6. The detailed level description from level 1 to level 6 is explained in Table 2. The study has diverse the properties and capabilities of ISMA scoring value done by comparing the result in three levels prior enhancement works were contribute the score more than 50% apportion to high-stress report in Figure 4 (b). The precise percentage distribution indicates that the result will begin at medium stress and go up from there. Assuming that, all subjects are experience stress but the percentage was reduced below 50% is contribute in stress dominantly contribute after the formation of fractional stress level. Therefore, it appears that standard deviation method applied is an important factor in term of percentage distribution result. The significance of the stress result between stress and high stress is demonstrated by the accuracy of distinguishing stress at various levels.
(a)
(b)
Figure 4. Result ISMA scoring for a) 6 levels b) 3 levels
3.2 Signal processing
3.2.1 Pre-processing
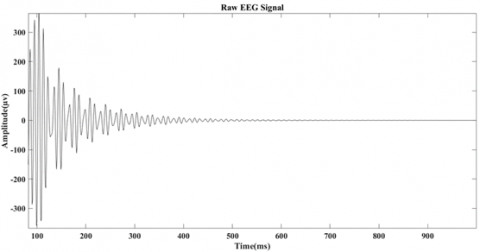
The predicted result of the bandpass filter method agrees with our expectations shown in the figures. Figure 5 shows two types of EEG signals. The similarity of those two signals is that both contained an EEG signal, but the latter differ in term of after filtered process which is artefact and unwanted signal be removed. From this explanation, these types of the EEG signals demonstrated the differences of signal improvement for amplitude references in vertical line values (Y-axis). The first figure has shown the raw EEG signal references value range in 300μv to -300 μv. The amplitude range indicated that the signal is in raw condition and has not yet being filtered. After the filtering procedure is complete, the amplitude should shift to the typical EEG amplitude range, as illustrated in the second image. An advantage of the method approach is usually performed a satisfactory filtered result as expected outcome.
Figure 5. a) Raw EEG signal
Figure 5. b) Filtered EEG signal
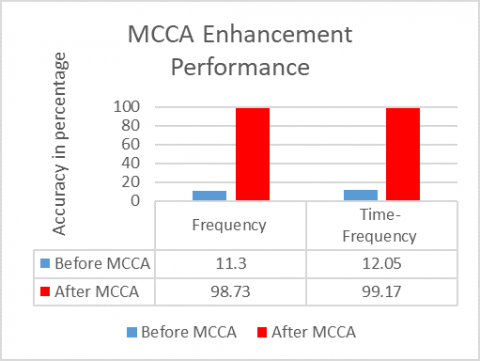
Figure 6. The MCCA enhancement performance in accuracy percentage
3.2.2 MCCA
Based on the Figure 6, it shows the MCCA approach give a beneficial in features performance in this research since it is justifiable to prove when the accuracy value is consistently increased for both frequency domain and time-frequency domain. The accuracy percentage behavior reveals a substantial increase of 87.43% and 87.12% in the frequency and time-frequency region respectively. The high significant changes analyze in MCCA is therefore acceptable to implement as a feature in this work. The results reported that the uniqueness of the proposed features is a potential way to bridge the gap between prior efforts on accuracy measurements technique. The results emphasize the importance of six sigma concept usage in improvement measurement features. Therefore, the best features measurement results will be effected the contributes of classification achievement which is agreed by Arunkumar et al. [41].
3.2.3 Multimodal
The unique features proposed in feature extraction are further explored using the multimodal features covered in this sub-section. These features can be analyzed by examining the parameter of weighted factor, EEG signal features and music types in accuracy result. The parameter of weighted and music will be applied from qualitative value while EEG signal features is gained from the features extraction process which were performed the accuracy performance in frequency and time-frequency domain shown in Table 3. From this interesting finding result, undeniably, it could be hypothesized that high accuracy value will be found in frequency and time-frequency domain. In connection with this finding were shown that the multimodal features are valuable and reliable to implement as a feature in this work.
Table 3. Multimodal performance result
|
Domain |
Accuracy in percentage |
|
Frequency |
97.44 |
|
Time-frequency |
97.49 |
3.3 Classifier
The classifier techniques would be one option to evaluate the impact of stress other than the questionaries’ method. However, combining the physiological signal and the self-stress questionnaire into the study could be a more efficient alternative to address the limitations of previous studies outline. Therefore, the proposed classifier will be using Ten-fold cross-validation and k-fold method to evaluate and validate the improvement works result demonstrate in two domain analysis. Hence, data were analyzed in separate primary contributing aspects such as MCCA and Multimodal. The result indicates that the objectives were discussed in perceptive of frequency and followed by time-frequency includes the MCCA and Multimodal features factors.
3.3.1 Frequency domain
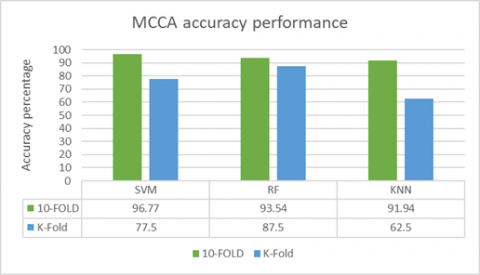
The finding of all classifier methods was evaluated in different features shown in the figures below. All classifiers (SVM, RF and KNN) in Ten-fold method exhibited higher accuracy as compare to K-fold method in MCCA features. For the MCCA result in Figure 7, Ten-fold method remarks SVM classifier with a high accuracy of 96.77% followed by RF of 93.54% and KNN of 91.94%. Nevertheless, K-fold is in contrast of Ten-fold method when RF achieved more accuracy of 87.5% as compared with SVM of 77.5% and KNN of 62.5%. In addition, Figure 8 presents the multimodal accuracy in both methods. The trend of increasing accuracy percentage in Ten-fold method began with SVM of 80.64%, KNN of 82.26%, and RF of 91.94%. For K-fold in multimodal, KNN shows a major gap difference when it achieved 55% accuracy compared to SVM and RF achieved 97.5% and 90% respectively. Overall, based on the summary of results in the frequency domain, the best performance accuracy for MCCA and multimodal is RF because it successfully obtained a high accuracy in Ten-fold and K-fold method with demonstrated average result of 90.52% and 90.97% respectively. In comparison to SVM and KNN methods, the RF methods approach is more suitable for estimating at the final decision level in order to classify the stress level [42].
Figure 7. MCCA accuracy performance in percentage for ten-fold and K-fold
Figure 8. Multimodal accuracy performance for ten-fold and K-fold in percentage
3.3.2 Time-frequency domain
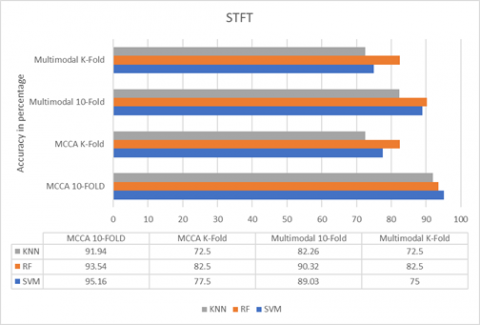
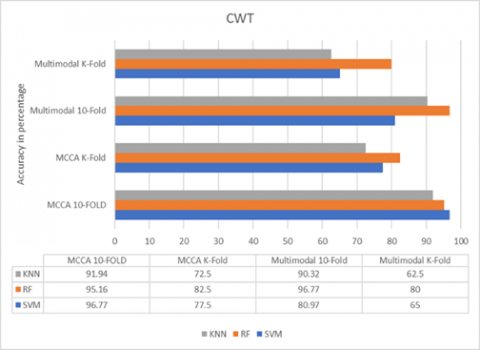
To validate the proposed method and enhancement performance between EEG signal and stress score, this work was conducted a secondary analysis of the signal processing in the time-frequency spectrum using STFT and CWT methods. These methods applied the same techniques as frequency domains are Ten-fold and K-fold for MCCA and multimodal features respectively. The purpose of comparing the features in Ten-fold and K-fold is to against the scenario performance between dependent and independent functions. The dependent is examining the features in randomize data segmentation while the selected data segmentation applied independent function. The primary means of differentiate the data segmentation techniques be shown in percentage performance such as, STFT methods found a possible high accuracy about the MCCA Ten-fold when achieved the accuracy more than 90% and most of the classifier gets nearly 90% accuracy in multimodal features to report in Figure 9. For the K-fold method, it performed the accuracy range between 72.5% to 82.5% for both MCCA and multimodal respectively. The result of CWT in MCCA and multimodal using KNN, RF, and SVM are illustrated in Figure 10. It is an interesting found that all classifiers based on MCCA and multimodal by producing an accuracy range from 80% to 97%. Therefore, to confirm the high accuracy shown a significant of result evidence is supported by the researches [21, 43]. However, the underlying mechanism using K-fold methods attribute to performance of a moderate accuracy shown when most of the results obtained less than 80% become a study limitation of this works. The limitation studies required to improve the K-fold values should be considered in future works.
Figure 9. STFT performance in MCCA and multimodal using ten-fold and K-fold
Figure 10. CWT performance in MCCA and multimodal using ten-fold and K-fold
The outcome of various measurement techniques leads to present the increasing of accuracy consistently using MCCA and multimodal here is thought to be novel since they have not been used previously in any classifier for stress level. This research also contributed scientifically to enhance the stress in multiple levels in order to determine the stress level precisely. It also obtained information that RF classifier is better than SVM and KNN. Other findings were demonstrated that the Ten-fold application performed better than K-fold.
The conclusion that can be drawn from this work is a new development of features extraction from EEG signal in frequency and time-frequency domain has made a substantial involvement. As expected, the proposed MCCA and multimodal features are powerfully executed, revealing that the high accuracy result is successfully realized as the initial contribution. The second contribution is stress indices enhancement by persuading the high accuracy for the majority of the methods employed as evidence to indicate that this strategy is reliable to utilize. The proposed features and various technique involved consistently demonstrated an efficiency impact of accuracy performance. Furthermore, it would be also interesting to modify the K-fold methods for more efficient accuracy performance.
[1] Panicker, S.S., Gayathri, P. (2019). A survey of machine learning techniques in physiology based mental stress detection systems. Biocybernetics and Biomedical Engineering, 39(2): 444-469. https://doi.org/10.1016/j.bbe.2019.01.004
[2] Arsalan, A., Majid, M., Butt, A.R., Anwar, S.M. (2019). Classification of perceived mental stress using a commercially available EEG headband. IEEE Journal of Biomedical and Health Informatics, 23(6): 2257-2264. https://doi.org/10.1109/JBHI.2019.2926407
[3] Asif, A., Majid, M., Anwar, S.M. (2019). Human stress classification using EEG signals in response to music tracks. Computers in Biology and Medicine, 107: 182-196. https://doi.org/10.1016/j.compbiomed.2019.02.015
[4] Zanon, C., Brenner, E.R., Baptista, M.N., Vogel, D.L., Rubin, M., Al-Darmaki, F.R., Gonçalves, M., Heath, P.J., Liao, H., Mackenzie, C.S., Topkaya, N., Wade, N.G, Zlati, A. (2020). Examining the dimensionality, reliability, and invariance of the depression, anxiety, and stress Scale – 21 (DASS-21) across eight countries. Assessment, 28(6): 1531-1544. https://doi.org/10.1177/1073191119887449
[5] Olaitan, O.O, Olanrewaju, O.I., Akinmoladun, F.O., Fadupin, G.T. (2020). Central obesity and stress- predisposing factors to hypertension among health workers in Jos University teaching hospital, Plateau State, Nigeria. Current Research in Diabetes & Obesity Journal, 12(4): 111-116. https://doi.org/10.19080/CRDOJ.2020.12.555845
[6] Hu, X., Li, F., Ng, J.T.D. (2018). On the relationships between music-induced emotion and physiological signals. 19th International Society for Music Information Retrieval Conference, Paris, France, pp. 362-369.
[7] Martínez-Rodrigo, A., García-Martínez, B., Alcaraz, R., González, P., Fernández-Caballero, A. (2019). Multiscale entropy analysis for recognition of visually elicited negative stress from EEG recordings. International Journal of Neural Systems, 29(2): 1-17. https://doi.org/10.1142/S0129065718500387
[8] Al-shargie, F., Tang, T.B., Badruddin, N., Kiguchi, M. (2018). Towards multilevel mental stress assessment using SVM with ECOC: An EEG approach. Medical & Biological Engineering & Computing, 56(1): 125-136. https://doi.org/10.1007/s11517-017-1733-8
[9] Rahman, N.A.A., Mustafa, M., Samad, R., Abdullah, N.R.H., Sulaiman, N., Pebrianti, D. (2018). Classification of EEG signal for body earthing application. Journal of Telecommunication, Electronic and Computer Engineering, 10(1-2): 81-85.
[10] Saeed, S.M.U., Anwar, S.M., Khalid, H., Majid, M., Bagci, U. (2020). EEG based classification of long-term stress using psychological labeling. Sensors (Switzerland), 20(7): 1-15. https://doi.org/10.3390/s20071886
[11] Abdulrahman, A., Baykara, M. (2021). A comprehensive review for emotion detection based on EEG signals: Challenges, applications, and open issues. Traitement du Signal, 38(4): 1189-1200. https://doi.org/10.18280/ts.380430
[12] Mert, A., Akan, A. (2018). Emotion recognition from EEG signals by using multivariate empirical mode decomposition. Pattern Analysis and Applications, 21(1): 81-89. https://doi.org/10.1007/s10044-016-0567-6
[13] Alam, M.N., Ibrahimy, M.I., Motakabber, S.M.A. (2021). Feature extraction of EEG signal by power spectral density for motor imagery based BCI 2021 8th International Conference on Computer and Communication Engineering (ICCCE). pp. 234-237. http://irep.iium.edu.my/id/eprint/92949
[14] Akin, M., Aslan, Z. (2020). Automatic detection of schizophrenia by applying deep learning over spectrogram images of EEG signals. Traitement du Signal, 37(2): 235-244. https://doi.org/10.18280/ts.370209
[15] Ieracitano, C., Mammone, N., Hussain, A., Morabito, C. (2019). A novel multi-modal machine learning based approach for automatic classification of EEG recording in dementia. Neural Networks, 123: 176-190. https://doi.org/10.1016/j.neunet.2019.12.006
[16] Chicco, D., Tötsch, N., Jurman, G. (2021). The Matthews correlation coefficient (MCC) is more reliable than balanced accuracy, bookmaker informedness, and markedness in two-class confusion matrix evaluation. BioData Mining, 14: 13. https://doi.org/10.1186/s13040-021-00244-z
[17] Patidar, S., Panigrahi, T. (2017). Detection of epileptic seizure using Kraskov entropy applied on tunable-Q wavelet transform of EEG signals. Biomedical Signal Processing Control, 34: 74-80. https://doi.org/10.1016/j.bspc.2017.01.001
[18] Patidar, S., Pachori, R.B., Upadhyay, A., Rajendra Acharya, U. (2017). An integrated alcoholic index using tunable-Q wavelet transform based features extracted from EEG signals for diagnosis of alcoholism. Applied Soft Computing, 50: 71-78. https://doi.org/10.1016/j.asoc.2016.11.002
[19] Mustafa, M., Zahari, Z.L., Abdubrani, R. (2021). A optimal accuracy performance in music-based EEG signal using Matthew Correlation Coefficient Advanced (MCCA). J. Teknol., 83(6): 53-61. https://doi.org/10.11113/jurnalteknologi.v83.16750
[20] Saitis, C., Kalimeri, K. (2021). Multimodal classification of stressful environments in visually impaired mobility using EEG and peripheral biosignals. IEEE Transactions on Affective Computing, 12(1): 203-214. https://doi.org/10.1109/TAFFC.2018.2866865
[21] Al-Shargie, F. (2019). Early detection of mental stress using advanced neuroimaging and artificial intelligence. arXiv:1903.08511.
[22] Perez-Valero, E., Lopez-Gordo, M.A., Vaquero-Blasco, M.A. (2021). Biomedical signal processing and control EEG-based multi-level stress classification with and without smoothing filter. Biomedical Signal Processing and Control, 69: 102881. https://doi.org/10.1016/j.bspc.2021.102881
[23] Ahuja, R., Banga, A. (2019). Mental stress detection in university students using machine learning algorithms. Procedia Computer Science, 152: 349-353. https://doi.org/10.1016/j.procs.2019.05.007
[24] Asif, A., Majid, M., Anwar, S.M. (2019). Human stress classification using EEG signals in response to music tracks. Computers in Biology and Medicine, 107: 182-196. https://doi.org/10.1016/j.compbiomed.2019.02.015
[25] Ramirez, R., Planas, J., Escude, N., Mercade, J., Farriols, C. (2018). EEG-based analysis of the emotional effect of music therapy on palliative care cancer patients. Front. Psychol., 9: 1-7. https://doi.org/10.3389/fpsyg.2018.00254
[26] Alipour, Z.M., Khosrowabadi, R., Namazi, H. (2018). Fractal-based analysis of the influence of variations of rhythmic patterns of music on human brain response. Fractals, 26(5): 1-17. https://doi.org/10.1142/S0218348X18500809
[27] Vinayakumar, N. (2019). Evaluation of effectiveness of five point system of yoga on stress reduction among. EPRA International Journal of Multidisciplinary Research, 5(9): 101-109. https://eprajournals.com/jpanel/upload/422pm_20.Dr.%20Nithya%20Vinayakumar-3620-1.pdf.
[28] Arun, P.G., Thayill, J., Shetty, P., Ashwin, V.P. (2019). Deep relaxation technique improves sleep quality and reduces stress in healthy volunteers during fasting therapy. Journal of Dental and Medical Sciences, 18(12): 56-62. https://doi.org/10.9790/0853-1812125662
[29] Wilaiprasitporn, T., Ditthapron, A., Matchaparn, K., Tongbuasirilai, T., Banluesombatkul, N., Chuangsuwanich, E. (2020). Affective EEG-based person identification using the deep learning approach. IEEE Transactions on Cognitive and Developmental Systems, 12(3): 486-496. https://doi.org/10.1109/TCDS.2019.2924648
[30] Chen, J.X., Mao, Z.J., Yao, W.X., Huang, Y.F. (2019). EEG-based biometric identification with convolutional neural network. Multimedia Tools and Applications, 79: 10655-10675. https://doi.org/10.1007/s11042-019-7258-4
[31] Chin, T.Z., Saidatul, A., Ibrahim, Z. (2019). Exploring EEG based authentication for imaginary and non-imaginary tasks using power spectral density method exploring EEG based authentication for imaginary and non-imaginary tasks using power spectral density method. IOP Conference Series: Materials Science and Engineering, 557: 6-11. https://doi.org/10.1088/1757-899X/557/1/012031
[32] Kumari, R.S.S., Abirami, R. (2019). Automatic detection and classification of epileptic seizure using radial basis function and power spectral density. 2019 International Conference on Wireless Communications Signal Processing and Networking (WiSPNET). pp. 6-9. https://doi.org/10.1109/WiSPNET45539.2019.9032800
[33] Delpozo-Banos, M., Travieso, C.M., Weidemann, C.T., Alonso, J.B. (2015). EEG biometric identification: A thorough exploration of the time-frequency domain. Journal of Neural Engineering, 12(5): 056019. https://doi.org/10.1088/1741-2560/12/5/056019
[34] He, H., Zhao, W., Fujimoto, K. (2019). Identification of EEG-based music emotion using hybrid CoA features and t-SNE. ACM Int. Conf. Proceeding Ser., pp. 95-102. https://doi.org/10.1145/3326172.3326183
[35] Deivasigamani, S., Senthilpari, C., Yong, W.H. (2020). Machine learning method based detection and diagnosis for epilepsy in EEG signal. Journal of Ambient Intelligence and Humanized Computing, 12: 4215-4221. https://doi.org/1007/s12652-020-01816-3
[36] Hasan, M.J., Kim, J.M. (2019). A hybrid feature pool-based emotional stress state detection algorithm using EEG signals. Brain Sci., 9(12): 376. https://doi.org/10.3390/brainsci9120376
[37] Purnamasari, P.D., Fernandya, A. (2019). Real time EEG-based stress detection and meditation application with K-nearest neighbor. 2019 IEEE R10 Humanitarian Technology Conference (R10-HTC)(47129), pp. 49-54. https://doi.org/10.1109/R10-HTC47129.2019.9042488
[38] Yudhana, A., Muslim, A., Wati, D.E., Puspitasari, I., Azhari, A., Mardhia, M.M. (2020). Human emotion recognition based on EEG signal using fast Fourier transform and K-nearest neighbor. Adv. Sci. Eng. Syst. J., 5(6): 1082-1088. https://doi.org/10.25046/aj0506131
[39] Sharma, R., Chopra, K. (2020). EEG signal analysis and detection of stress using classification techniques. Journal of Information and Optimization Sciences, 41(1): 229-238. https://doi.org/10.1080/02522667.2020.1714187
[40] Edla, D.R., Mangalorekar, K., Dhavalikar, G., Dodia, S. (2018). Classification of EEG data for human mental state analysis using random forest classifier. Procedia Computer Science, 132: 1523-1532. https://doi.org/10.1016/j.procs.2018.05.116
[41] Arunkumar, A., Ramkumar, K., Venkatraman, V., Abdulhay, E., Fernandes, S.L., Kadry, S., Segal, S. (2017). Classification of focal and non-focal EEG using entropies. Pattern Recognition Letters, 94: 112-117. https://doi.org/10.1016/j.patrec.2017.05.007
[42] Saitis, C., Kalimeri, K. (2021). Multimodal classification of stressful environments in visually impaired mobility using EEG and peripheral biosignals. IEEE Transactions on Affective Computing, 12(1): 203-214. https://doi.org/10.1109/TAFFC.2018.2866865
[43] Chen, K., Wang, C., Hua, K., Chiu, S. (2019). Developing one-sided specification six-sigma fuzzy quality index and testing model to measure the process performance of fuzzy information. International Journal of Production Economics, 208(57): 560-565. https://doi.org/10.1016/j.ijpe.2018.12.025