Mahraz Kabache* | Mhania Guerti
© 2021 IIETA. This article is published by IIETA and is licensed under the CC BY 4.0 license (http://creativecommons.org/licenses/by/4.0/).
OPEN ACCESS
We propose in this study an acoustic analysis called objective, based on physical measurements, to extract the acoustic characteristics of the voice of patients with Unilateral Laryngeal Paralysis. Our experiments were made at the Otorhinolaryngology service of the hospital of Bab El Oued. Algiers. (Algeria). In this work, an acoustic analysis of the vocal signal is based on measurements of the instability of the amplitude and frequency of the vibrations of the vocal cords. The results obtained are compared with those of a group of reference of subjects who normally speak. The study of the results obtained by the acoustic analysis of the pathological voice during the rehabilitation phase shows a strong correlation of the acoustic parameters between the pathological voice and the reference one. The exclusive use of hearing to evaluate the effect of voice rehabilitation in the Algerian hospital environment remains insufficient. It is important to correlate the perceptual information with the interpreted acoustic measurements, in a manner to be able to develop a therapeutic project appropriate to the patient’s expectations and difficulties.
acoustic analysis, vocal signal, speech pathology, unilateral laryngeal paralysis
The evaluation of the voice quality of laryngeal paralysis after rehabilitation in Oto-Rhino-Laryngologist (ENT) services is based on a subjective method using perceptual judgement. In this method the orthophonist is responsible for evaluating the quality of the voice by listening, which results in an unreliable perceptive assessment. From there, a reliable perceptive evaluation requires several expert speech-language pathologists and several listening sessions, which increases time and human resources, and does not allow regular use in medical practice [1, 2]. Another major disadvantage of subjective evaluation is the inter- and intra-listener variability in the perception of the voice by a board of experts. This variability can be influenced by context, emotional state or listener’s attention [3, 4]. The objective evaluation of the voice based on the acoustic analysis makes it possible to make measurements, obtain indices, identify trends, and do so quantitatively and objectively [5]. This instrumental method can assist the speech language pathologist in assessing the quality of the voice during the rehabilitation period [6-8].
In this sense, research has been carried out to objectively assess the voice in the Algerian clinical setting, nevertheless, they remain insufficient in relation to the protocol and conditions of recording of pathological voice which require technical precautions to acoustic evaluation [1, 9].
In this study, we propose an acoustic analysis for an objective evaluation of pathological voices in subjects with laryngeal paralysis at the ENT department of the Bab El Oued Hospital. Algiers (Algeria). The objective of this work is to show that the acoustic analysis and its results can help the othophonist in rehabilitation, and to evaluate, objectively, the evolution of this rehabilitation over time. We will show in this work, the degree of convergence of acoustic parameters of pathological voice and normal voice after rehabilitation, we will also mount the contribution of the objective method based on the acoustic analysis of the vocal signal on the evaluation of the voice after rehabilitation at the level of the ENT service.
Dysphonia is an alteration of the voice resulting in the isolated or combined achievement of the three acoustic parameters of the voice which are the pitch, intensity and timbre. The main causes of dysphonia are functional disorders, organic alterations or neurological affected.
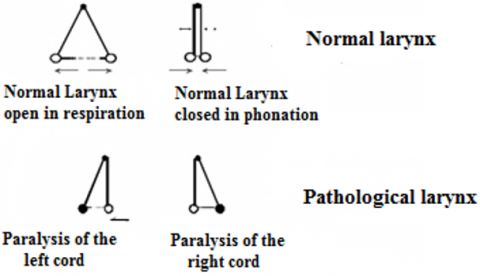
Figure 1. Representative diagram of the functioning of the vocal cords
Laryngeal immobility is defined as a complete decrease or stop of the abduction and/or abduction movement of the larynx (Figure 1). Depending on their laryngeal topography (uni or bilateral, position rather abduction or adduction), they will expose to a vital risk due to respiratory or swallowing problems and to a functional risk related to the various functions of the larynx: phonation, swallowing and breathing.
Unilateral paralysis accounts for 90% of laryngeal paralysis. They are more common on the left, probably for anatomical reasons (longer path on this side) [10, 11]. The voice of a laryngeal paralysis is blown and hoarsely with a significant air leak causing shortness of breath at the end of sentences and a continuous projected voice impossible.
3.1 Selected subjects
The subjects selected for this works consists of nine Algerian female patients aged 42 to 56 with Unilateral Laryngeal Paralysis (ULP), six are left and three are right (Table 1). Patients over the age of 56 were eliminated in this study to give reliability to our results (Figure 2). A recording is made after a 9-month speech rehabilitation. In this study, we only selected patients who followed a regular rehabilitation protocol. The same corpus was pronounced by 3 normal female speakers between the ages of 40 and 50 years, not presenting voice disorders (reference standard).
Table 1. Pathological population
|
Patients |
Sexe |
Age |
Type of Pathology |
|
|
ULP Right |
ULP Left |
|||
|
ULP 1 |
F |
42 |
x |
|
|
ULP 2 |
F |
56 |
|
x |
|
ULP 3 |
F |
43 |
|
x |
|
ULP 4 |
F |
47 |
|
x |
|
ULP 5 |
F |
53 |
|
x |
|
ULP 6 |
F |
52 |
|
x |
|
ULP 7 |
F |
53 |
x |
|
|
ULP 8 |
F |
45 |
x |
|
|
ULP 9 |
F |
48 |
|
x |
Figure 2. Distribution of patients by age
3.2 Recording equipment’s
The voice corpus was recorded with an external M-audio pro sound card, with a Signal/Noise ratio of 100 dB and 24 bits of resolution. We selected a sampling frequency of 44.1 kHz. A dynamic microphone of the Sennheiser e815S type is used for recording with sound software Sound Forge version 10. To measure the intensity, we used a digital sonometer model Chauvin Arnoux C.A 832, has a dynamic sound level 37 to 130 dB. We calibrated the sonometer on the A-weighting that approximates the sensitivity of the human ear. The A-weighting allows to measure sound levels between 37 and 85 dB. The Distance between a patient’s mouth and a sonometer was precisely respected for all patients.
3.3 Protocol recording and condition
The voice recordings were made in an acoustically quiet room to eliminate parasitic sound sources. When recording the vocal corpus, a distance of 5 cm is respected between the microphone and the patient's mouth. The microphone is placed at 45° laterally to the mouth, its gain has been adjusted to have an optimal quality of the recording and to avoid the saturation of the sound. The patient should hold the vowel [a] as long as possible with a strong inspiration at comfortable intensity [12]. No demonstration is given to the patient beforehand, not to influence the height.
3.4 Acoustic analysis
The acoustic data studied were extracted using PRAAT software version 6.1. [13]. A duration of two seconds was chosen in the most stable part of the recorded signal. Since dysphonia is primarily concerned with the voice source, we propose in this article an acoustic analysis based on measurements of the instability of the frequency and amplitude of the laryngeal vibration [1, 2]. In this study, the acoustic parameters chosen are: the average fundamental frequency (Pitch) Fo, the Coefficient of Variation of Fo (CV) which measures the overall instability of the voice over the whole sample, the jitter which evaluates instability of fundamental frequency, the intensity (energy), the shimmer which evaluates instability of the amplitude of Fo, the energy ratio of the Harmonic spectrum and that of the Noise spectrum (HNR) and the Maximum Phonation Time (MTP) [14, 15].
The acoustic parameters used in this study were defined and calculated as follows:
The mean fundamental frequency Fo is a very important acoustic indicator for determining the biomechanical characteristics of the vocal cords. To measure it, PRAAT has a frequency interval of values of 75 to 600 Hz [1]. The average frequency can be calculated by the following relationship:
Fo average $(H z)=\frac{1}{N} \sum_{i=1}^{N} F 0_{i}$ (1)
Jitter factor is the most commonly used parameter in vocal pathology. It is available since version 4.0 of PRAAT [10]. It consists of averaging all the differences, in absolute value, between two consecutive periods of the signal, and dividing this mean by the average length of the periods of the signal [1, 16, 17].
Jitter factor $=\frac{\sum_{i=1}^{n-1} \frac{\left|T_{i}-T_{i+1}\right|}{n-1}}{\sum_{i=1}^{n} \frac{T_{i}}{n}}$ (2)
The shimmer factor is based on exactly the same principle as the Jitter factor. The mean of the absolute differences between the maximum amplitude of two successive periods is divided by the mean of the maximum amplitudes of each period [1, 16, 17].
Shimmer factor $=\frac{\sum_{i=1}^{n-1} \frac{\left|A_{i}-A_{i+1}\right|}{n-1}}{\sum_{i=1}^{n} \frac{A_{i}}{n}}$ (3)
The Signal to Noise ratio HNR is an acoustic parameter used to indicate the rate of presence (or absence) of noise during the phonation. It is calculated by a temporal method [18]. Twenty-five consecutive cycles of the voiced signal allow to establish an average undulatory form; the subtraction between the original signal and the average form allows to obtain a residue considered as the noise. If H is the energy of the periodic averaged wave and N is the energy of the residual noise, the H/N ratio calculated regularly, provides the value of the HNR possibly converted into dB.
The TMP varies according to lung capacity, and according to glottic leakage during phonation. A reduction in TMP may be the result of low lung capacity or glottic air loss. TMP can be measured by a stopwatch but for reasons ease, we measured it directly in the time window of PRAAT.
Figure 3 shows the temporal signal of the sustained vowel [a] for a normal voice compared with a pathological voice for a patient with laryngeal paralysis (Figure 3). The periodicity of the pathological signal is altered which gives a voice with a significant degree of hoarseness perceptible to listening. The aperiodicity of the pathological signal is explained by irregularity of the vibrations of the vocal cords.
Table 2 shows the results obtained after the acoustic analysis by the PRAAT software. We performed acoustic analysis of pathological voices before, after 6 months and at the end of rehabilitation. For each acoustic parameter, we took the average of the results. We compared the results with a reference standard of three normal voices.
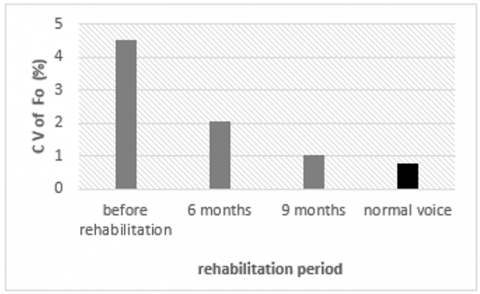
The evolution of the average value of Fo with its Coefficient of Variation during the rehabilitation period is shown in Figure 4 and 5. The average value 172 Hz of the Fo is normal for a woman’s voice, however, its standard deviation 7.82 Hz and its coefficient of variation 4.53% confirm a significant instability of the Fo. The coefficient of variation of the F0 is therefore the best index to explore the stability of the fundamental frequency in the medium term. At the end of rehabilitation, is observed a significant improvement in the average Fo (224.89 Hz), its standard deviation 2.33 Hz and its coefficient of variation 1.03% shows good stability of the Fo compared to the reference value.
Figure 3. Wavefrom of the vowel [a]
Figure 4. Evolution of Fo during the Rehabilitation Period
Table 2. Results obtained from acoustic analysis of pathological and normal voices
|
|
Acoustic parameters
|
Rehabilitation phase |
Reference Voice (Average value ) |
||
|
Before rehabilitation |
6 months |
9 months |
|||
|
Parameters of stability of Fo |
Average Fo (Hz) |
172.41 |
203.59 |
224.89 |
254.35 |
|
standard deviation of Fo (Hz) |
7.82 |
4.16 |
2.33 |
1.97 |
|
|
CV of Fo (%) |
4.53 |
2.04 |
1.03 |
0.77 |
|
|
Jitter factor (%) |
0.69 |
0.67 |
0.27 |
0.19 |
|
|
Parameters of amplitude stability of Fo |
Intensity average (dB) |
63.05 |
64.21 |
70.11 |
80.60 |
|
standard deviation of intensity (dB) |
1.79 |
0.76 |
1.21 |
0.55 |
|
|
CV of average Intensity (%) |
2.83 |
1.18 |
1.72 |
0.68 |
|
|
Shimmer (%) |
4.15 |
2.83 |
4.86 |
1.42 |
|
|
Analysis of noise |
HNR (dB) |
17.57 |
18.71 |
24.08 |
25.48 |
|
Aerodynamic Parameter |
MTP (s) |
5.53 |
8.10 |
10.60 |
12.80 |
Figure 5. Evolution of CV of the Fo during the rehabilitation period
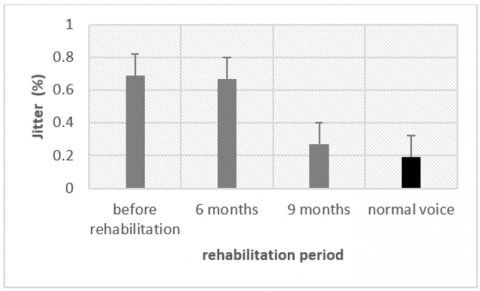
The short-term instability of Pitch F0 results in variations in frequency between each oscillation cycle, and is measured by Jitter. The Figure 6 shows the variation of Jitter during the rehabilitation period. Before rehabilitation, a jitter factor of 0.69% for an average Fo of 172 Hz is high compared to the reference standard, resulting in short-term instability of the laryngeal vibrator. On the other hand, at the end of rehabilitation, a Jitter factor of 0.27 was measured for an average Fo of 224.89 Hz, a very normal value compared to the reference standard.
Figure 6. Evolution of jitter factor during the rehabilitation period
The average intensity of 63 dB before rehabilitation and 64 dB during rehabilitation shows a weak voice. An average intensity of 71 dB at the end of rehabilitation is an average value and close to the reference standard (Figure 7).
Figure 7. Evolution of the average intensity
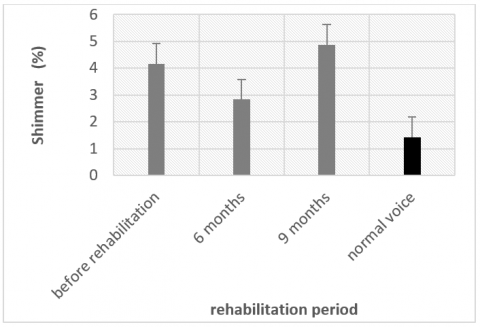
The Coefficient of Variation of the intensity (Figure 8) and the Shimmer (Figure 9) remain high with variable values during the rehabilitation phase, this variation is explained by the short-term instability of the amplitude of the vibration which results in amplitude variations between each oscillation cycle.
Figure 8. Evolution of the CV of the average intensity
Figure 9. Evolution of shimmer factor during the rehabilitation period
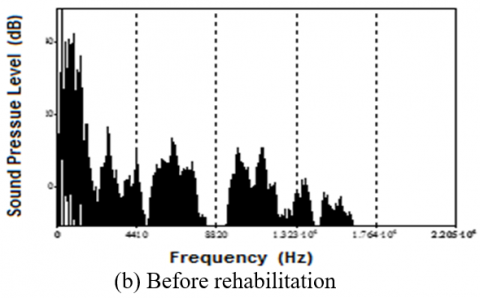
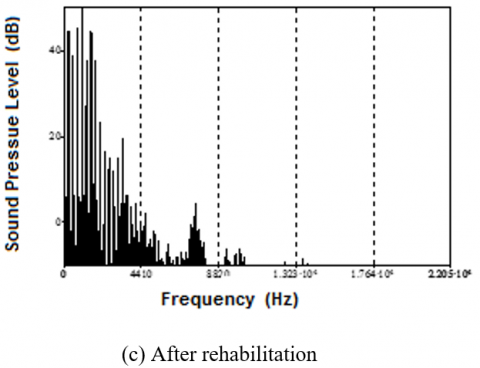
Figure 10. Vowel spectrum [a] in decibel as a function of frequency
Figure 11. Evolution of HNR during the rehabilitation period
Figure 12. Evolution of MTP during the rehabilitation period
The breath of a voice is a noise added to the vocal signal of the laryngeal vibration. Spectral analysis shows a well-defined line spectrum for a normal voice signal of good quality, a continuous full spectrum for a voice signal, which is due to air leakage for a pathological voice before rehabilitation and a significant decrease in blast noise at the end of the REHABILITATION (Figure 10).
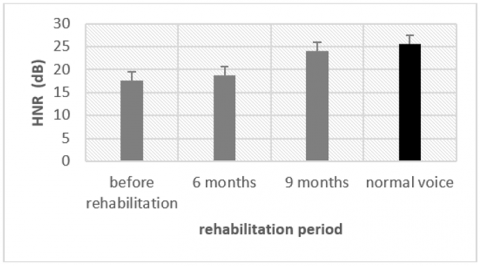
The ratio between the energy of the harmonic spectrum and that of the noise spectrum is the signal-to-noise ratio. This noise can be an aerodynamic flow noise created by a constriction of the vocal duct or by an excessive airflow [18]. The HNR found no significant changes during the first six months of rehabilitation (17.57 dB and 18.71 dB). There was a marked improvement in the last three months of rehabilitation, when the HNR increased from 18.71 dB to 24.08 dB and was a normal value compared to the reference standard (Figure 11).
Before rehabilitation, a very low MTP was noted (5.53 seconds). The MTP evolved during the rehabilitation phase: it reached 10.6 seconds, an average value close to the reference standard (Figure 12).
The aim of this work was to evaluate the results of the vocal rehabilitation of a unilateral laryngeal paralysis type dysphonia with an objective evaluation, based on physical parameters. After 9 months of rehabilitation, overall, the analysis of the results obtained shows a general stability of the laryngeal vibration and therefore the absence of problems of pneumo-phonic control. This overall finding is confirmed by the subjective evaluation by the orthophonist. however, the study of the results obtained by acoustic analysis during the rehabilitation phase, allowed us to extract some important findings. We noted a significant improvement in the average value of Pitch Fo with its coefficient of variation, which explains the normal functioning of the motionless vocal cord due to recurrent nerve paralysis. However, we found a very low improvement in Jitter in the first six months of rehabilitation, which shows short-term instability of the laryngeal vibrator during this period of rehabilitation. This can be explained by the patient’s slow adaptation with the rehabilitation method adopted by the ENT department of the Bab El Oued Hospital which uses the François Le Huche method as a rehabilitation technique [8]. The low results for intensity, the HNR and MTP compared to the reference standard in the first phase of rehabilitation (after six months) show a significant glottic leakage caused by a bad adduction of the vocal cords. These parameters were improved at the end of rehabilitation. On the other hand, we recorded an increase in the Coefficient of Variation and the Shimmer at the end of rehabilitation, which raises questions about this increase in values of these two parameters. These results still show the presence of short-term instability in the amplitude of the vibration of the vocal cords at the end of rehabilitation, despite the improvement of the intensity. This is explained by a rehabilitation based on breathing work more than vocalization work or sustained vowels which makes it possible to vibrate the vocal cords in good condition [8].
Overall, we found a strong correlation between objective evaluation based on acoustic parameters and subjective evaluation. However, we noted insufficient values for certain acoustic parameters, he latter is confirmed by the orthophonist, who affirm that the majority of patients refuse to apply the entire rehabilitation protocol as singing exercises, this gives a low stability of the laryngeal vibration [19].
The exclusive use of hearing to evaluate the effect of voice rehabilitation in the Algerian hospital environment remains insufficient. It is important to correlate the perceptual information with the interpreted acoustic measurements, in a manner to be able to develop a therapeutic project appropriate to the patient’s expectations and difficulties. In this study, we noted, the lack of a therapeutic strategy based on the manipulation of acoustic analysis software. It is important to strengthen the skills and knowledge of the speech language pathologist in order to adapt his rehabilitation technique according to the results and physical interpretations found. The rehabilitation protocol adopted by the ENT service of the Hospital of Bab El Oued which uses the Huche François method as a rehabilitation technique is not adapted to the Algerian pathological population, who has difficulty applying some vocal rehabilitation exercises We concluded at the end of this work that objective analysis based on physical parameters will not replace the subjective (perceptive) assessment used by the speech language pathologist, but it can help him to improve his rehabilitation technique for a periodic and objective evaluation during the rehabilitation period.
[1] Kabache, M., Guerti, M. (2021). Multi parametric method for the objective acoustic evaluation of the voice produced by laryngectomy patients. Instrumentation Mesure Métrologi, 20(3): 137-142. https://doi.org/10.18280/i2m.200303
[2] Lathadevi, H.T., Guggarigoudar, S.P. (2018). Objective acoustic analysis and comparison of normal and abnormal voice. Journal of Clinical and Diagnostic Research, 12(12): MC01-MC04. https://doi.org/10.7860/JCDR/2018/36782.12310
[3] Saltürk, E., Özdemir, E., Kumral, T.L., Karabacakoğlu, E., Kumral, E., Yildiz, H.E., Mersinlioğlu, G., Atar, Y., Berkiten, G., Yildirim, Y., Uyar, Y. (2017). Subjective and objective voice evaluation in Sjögren's syndrome. Logopedics Phoniatrics Vocology, 42(1): 9-11 https://doi.org/10.3109/14015439.2015.1116606
[4] Dahmani, M., Guerti, M. (2020). Cross-recurrence plots and quantification of glottal signal for pathological voice assessment. Traitement du Signal, 37(2): 307-317. https://doi.org/10.18280/ts.370217
[5] Öcal, B., Tatar, E.Ç., Toptaş, G., Barmak, E., Saylam, G., Korkmaz, M.H. (2020). Evaluation of voice quality in patients with vocal fold polyps: The size of a polyp matters or does it? Journal of Voice, 34(2): 294-299 https://doi.org/10.1016/j.jvoice.2019.04.009
[6] Yu, P., Ouaknine, M., Revis, J., Giovanni, A. (2001). Objective voice analysis for dysphonic patients: A multiparametric protocol including acoustic and aerodynamic measurements. Journal of Voice, 15(4): 529-542. https://doi.org/10.1016/S0892-1997(01)00053-4
[7] Jiang, J.J., Zhang, Y., MacCallum, J., Sprecher, A., Zhou, L. (2009). Objective acoustic analysis of pathological voices from patients with vocal nodules and polyps. Folia Phoniatr Logop, 61(6): 342-349. https://doi.org/10.1159/000252851
[8] Kreiman, J., Gerratt, B.R. (2005). Perception of aperiodicity in pathological voice. Journal of the Acoustical Society of America, 117(4): 2201-2211. https://doi.org/10.1121/1.1858351
[9] Ferrat, K., Guerti, M. (2012). A study of sounds produced by Algerian esophageal speakers. African Health Sciences, 12(4): 452-458. https://doi.org/10.4314/ahs.v12i4.9
[10] Roux-Burckle, M. (2017). Analyse multiparamétriques des voix de paralysie laryngée unilatérale. Doctorat Thesis. University oh Nice SOPHIA-ANTIPOLIS. French.
[11] Spector, B.C., Netterville, J.L., Billante, C., Clary, J., Reinisch, L., Smith, T.L. (2001). Quality-of-life assessment in patients with unilateral vocal cord paralysis. Otolaryngology–Head and Neck Surgery, 125(3): 176-182. https://doi.org/10.1067/mhn.2001.117714
[12] Patel, R., Awan, S., Barkmeier-Kraemer, J., Courey, M., Deliyski, D., Eadie, T., Paul, D., Švec, J., Hillman, R. (2018). Recommended protocols for instrumental assessment of voice: American speech-language-hearing association expert panel to develop a protocol for instrumental assessment of vocal function. American Journal of Speech-Language Pathology, 27(3): 887-905. https://doi.org/10.1044/2018_AJSLP-17-0009
[13] Maryn, Y., Weenink, D. (2015). Objective dysphonia measures in the program Praat: Smoothed cepstral peak prominence and acoustic voice quality index. Journal of Voice, 29(1): 35-42. https://doi.org/10.1016/j.jvoice.2014.06.015
[14] Klingholz, F., Martin, F. (1985). Quantitative spectral evaluation of shimmer and jitter. Journal of Speech, Language, and Hearing Research, 28(2): 169-174. https://doi.org/10.1044/jshr.2802.169
[15] Johnson, A.M., Goldfine, A. (2016). Intrasubject reliability of maximum phonation time. Journal of Voice, 30(6): 775.e1-775.e4. https://doi.org/10.1016/j.jvoice.2015.11.019
[16] Baken, R.J. (1990). Irregularity of vocal period and amplitude: A first approach to the fractal analysis of voice. Journal of Voice, 4(3): 185-197. https://doi.org/10.1016/S0892-1997(05)80013-X
[17] Brockmann, M., Drinnan, M.J., Storck, C., Carding, P.N. (2011). Reliable jitter and shimmer measurements in voice clinics: the relevance of vowel, gender, vocal intensity, and fundamental frequency effects in a typical clinical task. Journal of Voice, 25(1): 44-53. https://doi.org/10.1016/j.jvoice.2009.07.002
[18] De Krom. G. (1993). A cepstrum-based technique for determining a harmonic-to-noise ratio in speech signals. Journal of Speech and Hearing Research, 36(2): 254-266. https://doi.org/10.1044/jshr.3602.254
[19] Vaz Freitas, S., Melo Pestana, P., Almeida, A., Ferreira, V. (2015). Integrating voice evaluation: correlation between acoustic and audio-perceptual measures. Journal of Voice, 29(3): 390.e1-390.e7. https://doi.org/10.1016/j.jvoice.2014.08.007