Gutta Srinivasa Rao* | Atluri Srikrishna
© 2021 IIETA. This article is published by IIETA and is licensed under the CC BY 4.0 license (http://creativecommons.org/licenses/by/4.0/).
OPEN ACCESS
As a fruit of technological advancement, satellite images have been applied in many scientific fields, especially in surveillance. However, some satellite images are taken from an ultrahigh orbit in very dim situation. Data loss might occur due to the weak contrast between the dull pixels in such images, which cover a vast geographical area. Thus, it is necessary to improve the quality and contrast of satellite images. There are only a few techniques to improve the view and contrast of these images. To make matters worse, the contrast enhancement methods face many drawbacks. After estimating the brightness of each pixel, this paper integrates improved discrete wavelet transform (IDWT) with improved fuzzy C means clustering (IFCM) segment each poor-quality satellite image into multiple homogenous parts, and carries out morphological operations to enhance the contrast of the image. In addition, the proposed method was compared with traditional approaches. The results show that our method achieved the best performance in improving the quality of satellite images.
morphological operations, satellite images, image segmentation, contrast enhancement, pixel-by-pixel identification, dull pixels, bright pixels
The quality of captured images is often dragged by irregularities like low contrast [1]. The contrast of an image depends on the difference between bright and dull pixels. The standard strategies to enhance image contrast include histogram equalization, and histogram balancing. Many histogram-based strategies mainly deal with a portion of the original image [2]. Besides, neighborhood information can also be utilized to enhance the contrast, and improve the quality of images. One of the key steps of contrast enhancement is to identify poor-quality pixels, and improve their quality through morphological operations [3].
Image enhancement helps to make the original image more perceptible, and eliminate unwanted irregularities. There are two ways of image enhancement: the space -based approach, and the recurrence based approach [4]. The former mainly controls the contrast of dull pixels, while the latter manages the spatial recurrence of the original image. For the images with repetitive spatial histograms, the image quality is generally improved by place separation, homomorphic scanning, and lead element analysis [5]. Although these methods are designed to treat dull images, none of them can effectively shade the background.
The fundamental thought of image enhancement is to highlight the important details or striking features of the original image [6]. The primary way to upgrade the image is to increase contrast, and make the image clearer [7]. Image enhancement is badly needed for satellite images, which contain a massive amount of data but face a low clarity. Traditionally, satellite images are enhanced through histogram equalization, morphological procedures, and so on.
Remote image detection is advancing quickly in recent years. This technique serves many aspects of our society: empowering urbanization, observing the climate, and identifying secret places [8]. With the aid of satellites, remote image detection provides all sorts of signs and symbols, which greatly facilitate the logical prospection of the earth. The high-resolution remote images taken by satellites offer rich, itemized data, and supports high-quality visual translation [9]. Refined data can be extracted from the high-resolution images. As a result, satellite images have been broadly adopted for land survey, urban investigation, forest estimation, risk prediction, and many other applications.
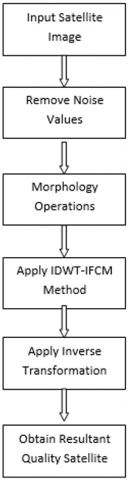
High resolution satellite images can be generated by either hardware approach or programming approach. The hardware approach always faces some constraints, namely, imaging sensors, and financial issue [10]. This paper adopts the programming approach to create ultra-high resolution spatial images through image processing and fusion. The process of remote sensing is depicted in Figure 1.
Figure 1. Remote sensing technology
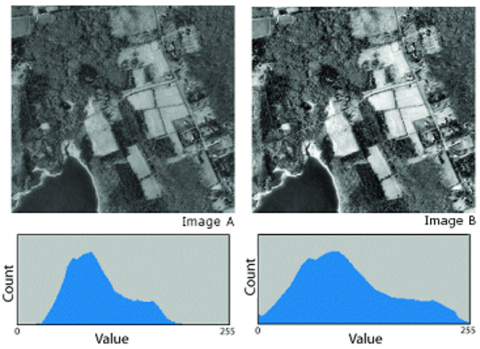
Remote images captured in unfavorable natural conditions have several common defects: low contrast and few contrast levels. The low contrast of these images comes from the long shooting range [11]. Before being used for security purposes, the low-contrast satellite images must go through morphological operations to improve their contrast [12]. Thus, it is necessary to measure and calculate the contrast in each image. Figure 2 presents a satellite image and its contrast.
Figure 2. Satellite image contrast level identification
After identifying the contrast of each satellite image, this paper applies the improved discrete wavelet transform (IDWT) with improved fuzzy C-means clustering (IFCM) to enhance the quality of that image [13]. The satellite images contain lots of information, a prerequisite for security applications. However, the changes in image quality indices, e.g., intensity, color, and brightness, cannot be recognized by naked eyes. Hence, manual processing cannot effectively recover the subtle changes in satellite images [14]. This calls for processing satellite images with advanced morphological operations [15].
Image segmentation provides the way to gather pixels by any attribute of the original image. The aim of image segmentation is to improve the image depiction, making the image more significant and simpler to analyse [16]. Although an image only has 256 different levels of intensity, a color satellite image might contain an exceptionally high number of colors [17]. For example, a RGB image could cover up to 256*×256*×256 colors. To solve the problem, this paper designs the IDWT-IFCM to segment each satellite image by separating bright pixels from dull pixels [18]. Based on the dull pixels, morphological operations were performed to enhance image contrast [19].
The contrast of a satellite image can be improved by several strategies, including histogram equalization, and discrete cosine transform. A popular histogram equalization technique is histogram balancing, which improves image quality by normalizing image intensities. The pixel intensity is assumed to fall between 0 and L1, where L is the total number of potential high-intensity pixels. Then, the standard histogram Pn for each possible pixel in the image can be derived from the number of pixels on the intensity of n with the total number of pixels P.
Each image comprises of pixels arranged in the form of a two -dimensional (2D) network. Every pixel contributes to the intensity of the whole image [20]. In spatial domain, some of the highly interdependent contiguous pixel values might be redundant [21]. To improve image quality, the redundancy should be eliminated through operations like discrete wavelet transform (DWT), which changes spatial area pixel values into recurrence space data and divides them into various groups.
To improve the quality of medical images, Khan and Ravi [1] proposed a morphological operation to select the parts of each image that are useful for morphological analysis. Sathya and Manavalan [2] designed a framework to extract the parts from bright and dull images, and successfully rebuilt the original images with the extracted parts. Based on image segmentation, Bhanu et al. [3] derived a calculation for the bright and dull pixel areas; then, the bright and dull areas at each scale were compared to obtain the brightest and dullest areas of the original image; after that, image quality was improved by increasing the contrast between various areas.
Islam et al. [4] presented two enhancement strategies for image quality in mammograms: one technique relies on multifractal approach, and the other on numerical morphology (NM). In the latter approach, the contrast is improved based on the difference between top- and base-levels of the modified images. This approach can be implemented iteratively to yield a high-quality final image. Suri and Mahak [5] created a novel morphology-based homomorphic encryptor to extract image features and improve pixel quality. Firstly, each image was divided into multiple parts through homomorphic scale-invariant feature transform (SIFT). Then, other contrast-based calculations were carried out to optimize each part of the image. Murinto et al. [6] established an edge positioning channel, which recognizes the edges by inclination, and then applies pointwise morphological segmentation.
Ahmad and Hadinegoro [7] expounded a technique that improves image shapes through multiscale gradient direction quantization. Gabor wavelet was utilized to recognize the width of each pixel in each image block. After that, a series of morphological opening operations were applied according to the specific scale of the image. Shang et al. [8] came up with a two stage approach: improving the boundaries and edges, and enhancing the contrast of dull pixels. Interestingly, the original image was split into 3×3 high-quality blocks, which were remapped to the original image. The two-stage approach was proved strong and robust on dull, shaded medical images. Guan et al. [10] proposed a feature extractor to improve the edge morphological expansion and segmentation were carried out on dull images to improve the quality of fine pixels. Experimental results show that their extractor can successfully enhance contrast, reduce noise level, and fill the gap between ruined extensions.
Liu et al. [11] invented a generic histogram equalization, in which images are enhanced through histogram equalization with reconfigured pixel dividing strategy, and improved through generic methods. The images improved by this method were found to outshine those processed by other approaches. Wang et al. [13] improved the quality of RGB color images in two steps: (1) meshing the original image into linear boxes, and changing the intensity in each box by nonlinear methods (2) increasing the contrast of each pixel in every box against the neighborhood, and restoring the RGB image based on the pixels of balanced intensity.
In the light of image features, Chen and Ramli [14] extended Livewire method into a stage -based client -controlled segmentation strategy, which provides an ideal way for characterizing tissue or anatomical structure in medical images at a low manual cost.
Wang and Ward [15] proposed a color image segmentation strategy for perceptive robots. The strategy integrates color thresholding, closest neighbor order, shading space thresholding, and probabilistic techniques. On each full resolution color image, every pixel was identified, and combined into areas of different colors. Then, the centroid box and range of each type of pixels were acquired. This strategy can speed up robot operations with low-quality images, and facilitate the continuous applications of mobile robots. Yoon et al. [16] segmented images on old chronicled reports through binarization: the levelness of the foundation was determined by a direct guess, and the original image was normalized by correcting the pixel values against the guess of the line plane.
Buzuloiu et al. [17] proposed a multi-scale edge detector to pinpoint edges under heavy constraints. The detector firstly searches for an edge representation at each scale, and then stitches the representations by heuristics. In this way, the support edges that span across multiple scales can be identified and limited, laying the basis for multi-scale segmentation using anisotropic dispersion plot.
Naik and Murthy [18] described an image segmentation approach based on pairwise area examination. The desired blocks were produced with the global properties of being not very common and not too refined. The approach is time efficient in handling a large number of images. Li and Asari [19] proposed a standardized image cropping and segmentation method. Through standardized cropping, the divergence between pixel clusters and the convergence within each cluster were estimated, and then utilized for image segmentation. The method was further enhanced with the sum of eigenvalues. Inspired by finite Gaussian mixture (FGM) model, Liao et al. [20] developed a color image segmentation technique. Each color image was treated as a combination of multi-variation densities, and the expectation-maximization (EM) algorithm was introduced to estimate the relevant parameters. The k-means clustering was adopted to initialize the FGM parameters. In addition, the number of mixed parts was controlled naturally by importing the Minimum Message Length (MML) criterion into EM. This technique is highly innovative in that it couples parameter estimation with model determination.
Numerical morphology refers to the techniques dependent on Minkowski’s set hypothesis, and characterized on a unique structure known as an interminable cross section [21, 22]. Morphological operations include segmentation, widening, opening, closing, cell counting. These operations can be characterized by paired or grayscale images in any number of measurements. They can likewise be characterized with Euclidean or non-Euclidean distances [23].
The fundamental applications of numerical morphology tools are image restoration, material sciences, and machine vision, where morphological changes are especially helpful for image analysis and image quality enhancement. Numerical morphology plays an important role in improving the quality of remote images captured by satellites.
For each image from the satellite image dataset, morphological operations are applied to enhance the contrast. Through fuzzification, the grayscale differences are spread over a wider range. Here, the grayscales are mapped to the interval [0, 1]. Then, the original image can be represented as a matrix of fuzzy singletons A×B, each with a high brightness. The fuzzy representation of an image is represented as:
$I(x, y)=\cup_{p=0}^{A-1} \mathrm{f}(\mathrm{x}, \mathrm{y}) U_{q=0}^{B-0} \frac{f(x, y)}{f_{\max }}$ (1)
In morphology, images are usually mapped with Euclidean space. Let I (x) be an image; E be the grayscale structuring element, S be the space of b(x). Then, the erosion of I by a pixel p in the image can be given by:
$I \ominus E(x)=\inf _{\mathrm{p} \in \mathrm{S}}(I(x+s))^{+} f(x, y)$ (2)
where, inf is the infimum operation representing the greatest upper bound.
The dilation of I by p can be given by:
$I \oplus E(x)=\operatorname{suf}_{\mathrm{p} \in \mathrm{S}}(I(x-s))$ (3)
where, suf is the supremum operation representing the least upper bound.
The contrast transform of each pixel can be completed by:
$I\left(p_{\mathrm{i}}\right)=\left\{\begin{array}{l}\mathrm{E}_{\mathrm{i}} \log \left(\mathrm{f}(\mathrm{x}+1)+\prod_{\mathrm{x}} \mathrm{f}\right. \\ \mathrm{E}_{\mathrm{i}} \log \left(\mathrm{f}(\mathrm{y}+1)+\prod_{\mathrm{y}} \mathrm{f}\right.\end{array} \quad f<T\right.$ (4)
where, T is the threshold; x and y are the coordinates of a pixel in the image.
The fuzzy set theory can be adopted for image segmentation, as it allows the presence of fuzzy limits between different groups. Each pixel has a membership relative to an area or a limit. Among the various fuzzy methods for image segmentation, the most popular one is the IDWT-IFCM. Through fuzzy allocation, the IFCM allows a given pixel to exist in several clusters with a membership within [0, 1]. During IFCM-based image segmentation, the pixels of the original image are gathered to clusters, which have no brightness limit. The objective function of the optimal segmentation can be expressed as:
Iopt $=\sum_{j=1}^{N} \sum_{i=1}^{c} U_{i j}^{m}\left\|X_{j}-Y_{i}\right\|^{2}+\mathrm{X} * \mathrm{Y}+I(x-s)$ (5)
where, U is the set of pixels in the image; x and y are the coordinates of a pixel in the image. The original image is considered to comprise of two parts: the light reflected by clouds, and the light reflected by the ground. The pixel positions in the two parts are denoted as P and Q respectively. Then, the segmentation process can be described as:
I(P,Q)=π[Tr(P,Q)]=mLr(P,Q)* (P,Q)+H[1−t(x,y)] (6)
where, I (P, Q) is an image from the satellite image dataset D={I1, I2,…..In}; Tr (P, Q) is the reflectivity of the ground; G (P, Q) is the transmittance of the cloud; H is the power of the light; m is the weakening coefficient of the light during barometrical transmission. The estimations of Lr (P, Q), G(P, Q) and m are in the range of [0 1].
Suppose the satellite image I(P,Q) has a total of T pixels. The main goal is to divide T into L clusters. The fuzziness can be quantified as:
$U_{i, j}=\sum_{k=1}^{c}\left\{\frac{|| X_{j}-V_{i} \|}{\left||X_{j}-V_{K}\right||}\right\}^{-\frac{2}{m}-1}+\operatorname{Iopt} * \mathrm{I}(\mathrm{P}, \mathrm{Q})$ (7)
$V_{i}=\frac{\sum_{j=1}^{n}\left(U_{i j}\right)^{m} X_{j}}{\sum_{j=1}^{n}\left(U_{i j}\right)^{m}}$ (8)
For i=1,2,….c and for j=1,2,…n.
Figure 3. Proposed framework
As shown in Figure 3, our method IDWT-IFCM can enhance the contrast of poor quality images.
Step 1. Select a poor-quality satellite image from the dataset.
Step 2. Equalize the image by general morphological strategy.
Step 3. Apply the IDWT to improve the contrast of the image without changing its shape.
Step 4. Divided the image into four blocks, denoted as LL, LH, HL, and HH.
Step 5: Divide the value of each block into multiple levels.
$f(t)=\sum_{k} c_{j . k} \phi_{j . k}(t)+\sum_{j} \sum_{k} d_{j . k}(t)+\sum_{j=1}^{n}\left(U_{i j}\right)^{m} X_{j}$ (9)
Step 6. Divide the grayscale levels in each block based on the estimated values of dull pixels.
$\alpha_{N} h(a)=\left\{\wedge h\left(a^{\prime}\right) \mid a^{\prime} \in N_{G}(a) \cup h(a)\right\}-f(t)$ (10)
Step 7. Represent the quality of neighbouring pixels with brightness.
$\beta_{N} h(a)=\left\{\vee h\left(a^{\prime}\right) \mid a^{\prime} \in N_{G}(a) \cup h(a)\right\}+U_{i j}^{m}|| X_{j}-Y_{i}||^{2}$ (11)
Step 8: Establish a matrix of Euclidean distance (ED).
$\mathrm{ED}=\mathrm{f}(\mathrm{t})-\beta_{N} h(a)+\mathrm{V}_{\mathrm{i}}+\mathrm{X}-\mathrm{Y}$ (12)
Assign a weight to each pixel with a low contrast.
$w_{j},=\frac{1}{\frac{|| x-v|| * x}{1+e\left\{\frac{\frac{1}{x}-1}{\frac{1}{x^{2}}-2}+\frac{1}{1\left(\frac{c}{n}\right)}\right\}}}$ (13)
Step 9: Define the first identified pixel and the pixels after contrast enhancement.
$\Gamma_{N} h(a)=h(a)-\delta_{N} h(a)=h(a)-\beta_{N \alpha_{N}}$ (14)
Step 10: Apply inverse transform on the dull pixels to make them brighter.
$\Gamma^{\prime} h(a)=\sigma_{N} h(a)-h(a)=\alpha_{N} \beta_{N} h(a)-h(a)$ (15)
Step 11: Compute the pixel contrast in different blocks.
$f^{(t+1)}(x, y)=f^{(t)}(x, y)+\frac{1}{k} \sum_{k=1}^{k} w_{k}^{-1}\left(\left(\left(g_{k}-g_{k}^{(t)}\right) d+\beta\right) * h\right)-\Gamma^{\prime} h(a)$ (16)
Step 12: Measure the error rate.
Mean Square Error Rate $(E r)=\frac{1}{N_{1} N_{2}} \frac{\sum_{x=1}^{N_{1}} \sum_{y=1}^{N_{2}}(\hat{f}(x, y)-f(x, y))^{2}}{\sum_{x=1}^{N_{1}} \sum_{y=1}^{N_{2}}(f(x, y))^{2}}+\beta_{N} h(a)$ (17)
Our method was simulated on MATLAB using the satellite images from https://www.ncdc.noaa.gov/data-access/satellite-data/satellite-data-access-sorted-satellite-instrument. By the IDWT-IFCM each input image was segmented into multiple blocks. Then, the pixels were extracted from each block, and subjected to contrast calculation. Based on the contrast values, weights were assigned to the pixels to enhance the contrast of the whole image. Figure 4 provides an example of the contrast enhancement process.
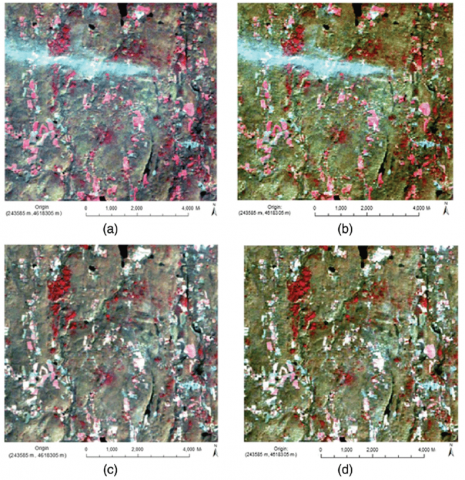
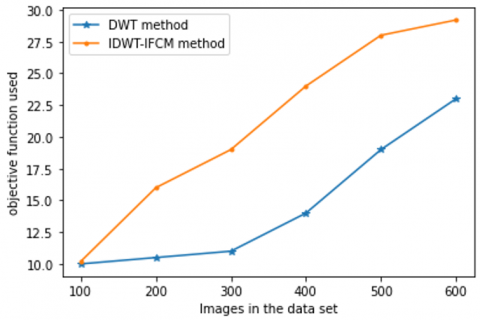
In Figure 4, each pixel is extracted for intensity calculation; the pixels with low contrast are enhanced to improve image quality. To get a better outcome, the images from the satellite dataset undergo different stages. Figure 5 shows the improvement of a low-quality image by our method; Figure 6 presents the intensities of the pixels in the said image; Figure 7 depicts the objective function of intensity for the pixels extracted from the dataset.
Figure 8 explains the process of pixel identification and pixel contrast enhancement. Table 1 records the contrasts of pixels identified and enhanced by our method. The low-contrast pixels were clearly enhanced.
Figure 4. Image contrast enhancement process
Figure 5. Image quality improvement
Figure 6. Image intensity identification by pixels
Figure 7. Objective functions of image
Figure 8. Object identification in satellite image
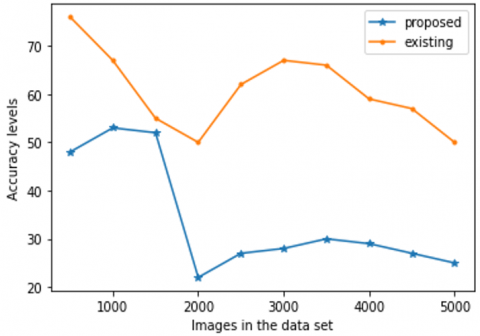
Figure 9 compares the accuracies of our method and several traditional methods. Obviously, our method was more accurate than the contrastive methods.
Table 2 presents the mean squared error rates (MSERs) of our method and traditional methods. It can be inferred that our method achieved the lowest MSER.
Table 3 lists the image qualities obtained by morphological operations and IDWT-IFCM, morphological transform (MT), and modified MT (MMT). The quality of each image was assessed by multiple parameters. The PSNR values are indicated in Table 3 that indicates the image quality.
Figure 9. Accuracy levels
Table 1. Contrasts of pixels identified and enhanced by different methods
|
Methods |
Minimum range contrasts of identified pixels |
Maximum range contrasts of identified pixels |
Minimum range contrasts of enhanced pixels |
Maximum range contrasts of enhanced pixels |
|
DWT |
19% |
25% |
11% |
32% |
|
Continuous Wavelet Transform (CWT) |
16% |
23% |
15% |
26% |
|
Second Generation Wavelet Transform (SGWT) |
17% |
31% |
8% |
24% |
|
IDWT-IFCM |
8% |
37% |
23% |
39% |
Table 2. MSERs of different methods
|
Images |
MSER of Enhance Local Contrast (CLAHE) |
MSER of decorrelation stretching |
MSER of histogram equalization |
MSER of morphological operations |
MSER of our method |
|
100 |
0.1202 |
0.1503 |
0.0688 |
0.1244 |
0.0085 |
|
200 |
0.0305 |
0.0402 |
0.0472 |
0.2287 |
0.0214 |
|
300 |
0.1109 |
0.0112 |
0.1825 |
0.1532 |
0.0311 |
|
400 |
0.0232 |
0.1532 |
0.4100 |
0.2541 |
0.0045 |
|
500 |
0.1377 |
0.1855 |
0.1522 |
0.3214 |
0.0023 |
Table 3. Image quality parameters
|
Method name |
MSER |
PSNR |
Entropy |
SSI |
Tenengrad |
|
|
Input |
Output |
|||||
|
MT |
34.26 |
55.32 |
12.36 |
15.24 |
0.95 |
762246 |
|
MMT |
21.54 |
35.65 |
9.67 |
13.26 |
0.72 |
612234 |
|
IDWT-IFCM |
6.32 |
12.38 |
8.85 |
15.63 |
0.28 |
342289 |
Thanks to the development of satellites, remote image detection provides various signs and symbols that facilitate the logical prospection of the earth. The high-resolution remote images taken by satellites offer rich, itemized data, and supports high-quality visual translation. Currently, satellite images are being utilized in many fields, especially in the field of security. One of the main defects of satellite images lies in the poor contrast, as they are captured from a long range and cover a large region. There are only a few techniques to enhance the view and contrast of satellite images. What is worse, the contrast enhancement approaches face multiple drawbacks. To solve the problem, this paper carries out morphological operations on low-quality satellite images, and then implements the IDWT-IFCM to segment each original image into several blocks; the contrast of the entire image is enhanced without changing the image structure, making the pixels more salient and clearer. Experimental results show that our method can extract, identify, and enhance all dull pixels for a better image quality and outperform the traditional approaches.
[1] Khan, A.M., Ravi, S. (2013). Image segmentation methods: A comparative study. International Journal of Soft Computing and Engineering (IJSCE), 3(4): 84-92.
[2] Sathya, B., Manavalan, R. (2011). Image segmentation by clustering methods: Performance analysis. International Journal of Computer Applications, 29(11): 27-32. https://doi.org/10.5120/3688-5127
[3] Bhanu, B., Lee, S., Ming, J. (1995). Adaptive image segmentation using a genetic algorithm. IEEE Transactions on Systems, Man and Cybernetics, 25(12): 1543-1567. https://doi.org/10.1109/21.478444
[4] Islam, S., Ahmed, M. (2013). Implementation of image segmentation for natural images using clustering methods. International Journal of Emerging Technology and Advanced Engineering, 3(3): 175-180.
[5] Suri, P., Mahak, R. (2012). Image segmentation with modified k-means clustering method. International Journal of Recent Technology and Engineering (IJRTE).
[6] Murinto, Putra, W.P., Handayaningsih, S. (2008). Analisis perbandingan histogram equalization dan model logarithmic image processing (LIP) untuk image enhancement. Jurnal Informatika, 2(2): 200-208.
[7] Ahmad, N., Hadinegoro, A. (2012). Metode histogram equalization untuk perbaikan citra digital. Proceeding of Seminar Nasional Teknologi Informasi dan Komunikasi Terapan, pp. 439-445.
[8] Shang, H., Shui, P., Zhang, S. (2006). Detection of unknown nonlinear FM signals by time-frequency morphological filtering. 2006 8th international Conference on Signal Processing. https://doi.org/10.1109/ICOSP.2006.346008
[9] Li, H., Xiao, D., Zhao, X. (2009). Morphological filtering assisted field-pipeline small leakage detection. 2009 IEEE International Conference on Systems, Man and Cybernetics, pp. 3769-3774. https://doi.org/10.1109/ICSMC.2009.5346676
[10] Guan, M., Ren, H., Ma, Y. (2009). Multi-sale morphological filtering method for preserving the details of images. 2009 Asia-Pacific Conference on Computational Intelligence and Industrial Applications (PACIIA), pp. 417-420. https://doi.org/10.1109/PACIIA.2009.5406568
[11] Liu, Z., Wang, J., Liu, B. (2011). ECG signal denoising based on morphological filtering. 2011 5th International Conference on Bioinformatics and Biomedical Engineering, pp. 1-4. https://doi.org/10.1109/icbbe.2011.5780239
[12] Kim, Y.T. (1997). Contrast enhancement using brightness preserving bi-histogram equalization. IEEE Trans. Consumer Electronics, 43(1): 1-8. https://doi.org/10.1109/30.580378
[13] Wang, Y., Chen, Q., Zhang, B. (1999). Image enhancement based on equal area dualistic sub-image histogram equalization method. IEEE Transactions on Consumer Electronics, 45(1): 68-75. https://doi.org/10.1109/30.754419
[14] Chen, S.D., Ramli, A.R. (2003). Contrast enhancement using recursive mean-separate histogram equalization for scalable brightness preservation. IEEE Transactions on Consumer Electronics, 49(4): 1301-1309. https://doi.org/10.1109/TCE.2003.1261233
[15] Wang, Q., Ward, R.K. (2007). Fast image/video contrast enhancement based on weighted threshold histogram equalization. IEEE Transactions on Consumer Electronics, 53(2): 757-764. https://doi.org/10.1109/TCE.2007.381756
[16] Yoon, H., Han, Y., Hahn, H. (2009). Image contrast enhancement based sub histogram equalization technique without over-equalized noise. International Conference on Control, Automation and System Engineering, pp. 176-182.
[17] Buzuloiu, V., Ciuc, M., Rangayyan, R.M., Vertan, C. (2001). Adaptive neighborhood histogram equalization of color images. Journal of Electron Imaging, 10(2): 445-459.
[18] Naik, S.K., Murthy, C.A. (2003). Hue-preserving color image enhancement without gamut problem. IEEE Transactions on Image Processing, 12(12): 1591-1598. https://doi.org/10.1109/TIP.2003.819231
[19] Li, T., Asari, V.K. (2005). Adaptive and integrated neighborhood dependent approach for nonlinear enhancement of color images. Journal of Electron Imaging, 14(4): 043006-1-043006-14. https://doi.org/10.1117/1.2136903
[20] Liao, P.S., Chen, T.S., Chung, P.C. (2001). A fast algorithm for multilevel thresholding. Journal of Information Science and Engineering, 17: 713-727.
[21] Sherrier, R.H., Johnson, G.A. (1987). Regionally adaptive histogram equalization of the chest. IEEE transaction on Medical Imaging, 6(1): 1-7. https://doi.org/10.1109/TMI.1987.4307791
[22] Kim, Y.T. (1997). Contrast enhancement using brightness preserving bi-histogram equalization. IEEE Transaction on Consumer Electronics, 43(1): 1-8. https://doi.org/10.1109/30.580378
[23] Chen, S.D., Ramli, A.R. (2003). Contrast enhancement using recursive mean-separate histogram equalization for scalable brightness preservation. IEEE Transaction on Consumer Electronics, 49(4): 1301-1309. https://doi.org/10.1109/TCE.2003.1261233