Hafzullah İş | Taner Tuncer*
© 2021 IIETA. This article is published by IIETA and is licensed under the CC BY 4.0 license (http://creativecommons.org/licenses/by/4.0/).
OPEN ACCESS
It is highly important to detect malicious account interaction in social networks with regard to political, social and economic aspects. This paper analyzed the profile structure of social media users using their data interactions. A total of 10 parameters including diameter, density, reciprocity, centrality and modularity were used to comprehensively characterize the interactions of Twitter users. Moreover, a new data set was formed by visualizing the data obtained with these parameters. User profiles were classified using Convolutional Neural Network models with deep learning. Users were divided into active, passive and malicious classes. Success rates for the algorithms used in the classification were estimated based on the hyper parameters and application platforms. The best model had a success rate of 98.67%. The methodology demonstrated that Twitter user profiles can be classified successfully through user interaction-based parameters. It is expected that this paper will contribute to published literature in terms of behavioral analysis and the determination of malicious accounts in social networks.
social media analysis, interaction evaluation, deep learning, profile analysis
With the development of information technologies, Internet access has become more available and in turn, online social networks have gained an increasing number of users and are currently used for a variety of purposes. They have become digital interaction and communication platforms. The transformation of communication and social networks has considerable effects on economics, politics, society and many other global aspects. Social networking platforms do not just lead the changes in cultural transformation; they are also the important information resources for commerce, research, business, and many other fields.
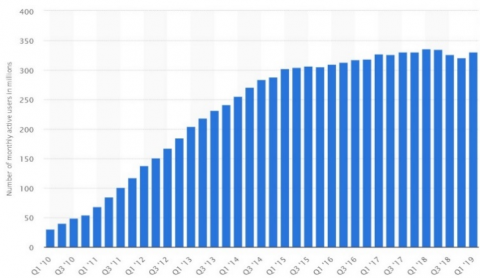
The digital world’s takeover of communication has accelerated the development of social media platforms. According to the We Are Social’s 4th quarterly report of 2019 [1], 5,155 billion people, 67% of the world population, are using the Internet and 3,725 billion people, 48% of the world population, are using social media. The report states that the number of social media users has increased by 3% since the last quarter. There is a 10% increase in Internet and social media use with respect to last year. Almost all Internet users are associated with social media. According to the GlobalWebIndex report of 2019 [2], Internet users spend a daily average of 2 hours and 15 minutes on social media, one third of the average of time users spend on the Internet [2]. Figure 1 shows the change in the number of users with respect to the last decade.
Social networks can be used to provide useful data in many aspects. These can be for gleaning information, marketing strategies, decision support processes, political tendency studies, business intelligence applications and advertisements. Many business segments, such as corporations, enterprises and entrepreneurs, can benefit from the interactions on social media. Misleading interactions between users on social networks may cause financial and intangible danger for businesses, producers, etc. Therefore, it is important to determine whether users on social network are malicious.
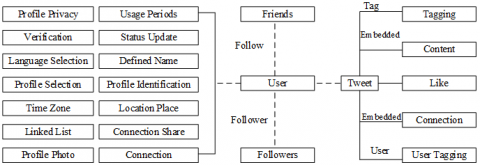
User interactions on Twitter form the measurable datasets. Accordingly, social network analysis can reveal the relationship structures based on the analysis of user behavior [3]. The parameters that form the profile and behavior of a Twitter user are presented in Figure 2.
Social media hosts different forms of abuse, one of which is fake interactions. These interactions can manipulate people in many ways. Fake interactions on e-commerce platforms with social media accounts sabotage the secure shopping environment for consumers. It is possible to create interactions such as news, comments and likes. Praises or criticize certain products and the perceptions created by these interactions can mislead consumers about certain products and services. Fake interactions coming from malicious accounts can manipulate statistical data and investment–support processes. Consequently, fake interactions can affect political processes along with the economy. Using fake followers, reputation and popularity can be achieved, and a strong profile image can be built in the eyes of society. This manipulative method can be used by some politicians to increase their number of interactions on social media with fake-bot accounts to increase their reputation [3]. Cyber criminals use Twitter for spamming, spreading malicious messages, sending phishing links or filling the network with fake accounts, and for other malicious activities.
Figure 1. The change in the number of twitter users by years [2]
Figure 2. Categorical interaction parameters of twitter users
Varol et al. reported that approximately 15% of Twitter accounts were bot accounts [4]. Social bots are the programs that automatically generate content, distribute it over a certain social network, and interact with its users [5]. Social bots are responsible for 35% of the content published on Twitter [6]. Malicious accounts are detected from the analysis of profile information and tweet parameters, but these can be misleading, because there are a lot of accounts that are in a passive state, that never tweet or interact, but have an original profile created by phishing forgery. According to the Twopcharts Twitter Report [7], 44% of 974 million registered Twitter users have never tweeted. These are called passive accounts. About 30% of Twitter’s existing accounts have posted 10 or fewer tweets. Only 13% of registered accounts posted more than 100 tweets.
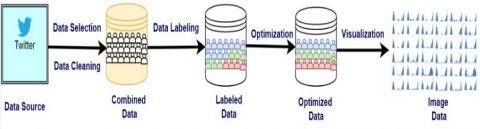
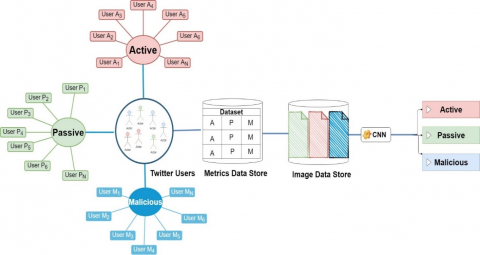
The main purpose of this study is to analyze the interaction of Twitter users, which is the most popular social networking platform with millions of users, as shown in Figure 1. This study presents a new approach to classify users on the Twitter social network as active, passive and malicious. An up-to-date and comprehensive data set was created, and the users were classified with the help of deep learning algorithms. In this paper, the proposed method was summarized by a systematic methodology. To classify Twitter users as malicious, active or passive, 10 different metrics were used: density, centrality, reciprocity, diameter, modularity, account age, follow-up, message routing, liking and tweeting averages. The profile of a total of 4,200 social media users was based on their current interaction data covering eight months. Data cleaning, integration, size reduction and optimization processes were performed on the data set. Metric data for all users were imaged by applying visualization methods to the data set after the filtering steps were completed. By applying deep learning algorithms to the data set, the classification performances of the active, passive and malicious categories were examined. Among the applied deep learning models, the performance of InceptionRN, MobileNetV2, ImageNet, Xception, Densenet201 and Resnet101 were evaluated.
The main contributions of this work are summarized below:
- The make-up of static and dynamic interaction of users in the network was extracted effectively by using fewer metrics. This is important for cost–performance considerations.
- For the first time, behavioral analysis was achieved in this study by simultaneously using 10 different dynamic interaction metrics, such as the number of tweets and account age.
- Deep learning algorithms were applied to the interaction data of the users.
- In this study, the quality of social network accounts was rated – in addition to malicious account detection and behavioral analysis – based on user interaction.
The rest of the article is organized as follows:
Studies from published literature were summarized in the second section, and the creation of the data set and the applied filters and methodologies were explained in the third section. In the fourth section, deep learning algorithms and the results obtained from the data set were presented. In the fifth section, the methodology was discussed and suggestions were offered to improve the performance. Finally, in the conclusion, the method used and the achievements obtained were summarized and opinions about the contribution of this study to the literature and the development of the method were expressed.
In this section, the published studies related to the identification and classification of social network users were examined along with the methods adopted to solve the problems that were handled in these studies, and the success rates were presented.
Social networks were the target of intense attacks from malicious accounts (spam, bots, sybils) due to the scope of the user databases and the size of the audience they had. It is important to prevent these attacks as they lead to manipulation that may have very negative political, social and economic consequences. There are many studies focusing on detecting malicious accounts, such as spam, bots and sybil attacks in social networks, and almost all of these studies use machine learning methods [8-14].
Cai et al. proposed a behavior-based deep learning model [15]. A dataset consisting of 5,658 social media users was used in the study. Performance was tested with four different algorithms and 87.32% accuracy was achieved with the proposed BeDM method. The use of this method was one of the first steps using deep neural networks for bot detection. The experiments conducted on a real-world dataset collected from Twitter also showed the effectiveness of the model. In a social bot detection study on Twitter data from 100,000 users, Kai-Cheng et al. proposed a model that tried to classify real-time tweet streams using the least amount of metadata [16]. Cross-validation was used to scale the performance of the model. A 5-Fold-Cross verification technique was performed on different data sets and a high-performance rate of 97% was achieved. Ling et al. focused on the detection of users according to their behavior on social networks [17].
Anand et al. proposed a deep learning-based method for the classification of age groups in social media interactions [18]. It was determined that age is an important parameter in determining the user character, and the interaction structures of same-age groups are similar. In their study, punctuation as well as the number of characters, media sharing and the subject of over 7,000 sentences were analyzed. In the classification by different algorithms, a 95% performance rate was achieved with Convolutional Neural Networks. In their image labeling and deep learning classification studies, Chengjiang et al. proposed a new method based on predicting image labeling by combining image content description with the social media context of each image on the social network [19]. The method is based on a new fully connected Conditional Random Fields algorithm that consists of two deep Convolutional Neural Networks (CNNs) and a Recurrent Neural Network (RNN) to model the textual and visual node where each node is an image. The data set is MIR-9K, consisting of 3,213 people, 34,942 words, 17,687 pictures and 24 classes. In the study, a 92.20% success rate was achieved with VGG 19, and a 92.13% success rate was achieved with ResNet-152.
3.1 Data set
The dataset used in this paper was created from up-to-date data with metrics measured by scope and effectiveness after analyzing enough users combined with the use of filtering processes. In the dataset, three different groups were defined as labels with the aim of conducting a behavioral analysis based on the physical interactions of Twitter users. These groups were active, passive and malicious. Users in what is called the “Enabled” group represent a community below 1% of Twitter users, and 99% of Twitter users follow this 1% segment. This group contains politicians, artists, athletes, players, brands, teams – a social media phenomenon recognized by society. The accounts in the passive group are very low-profile users in terms of Twitter interactions. One quarter of Twitter users never tweet. Twitter stated that 44% of its users never tweeted except in very rare cases. Such users are referred to as passive users. The group in which malicious accounts are classified consists of fake accounts such as spam, bots and sybil attacks [5].
Physical interaction performances and emotional imbalances of social media users were measured using various metrics, and a single image was obtained by visualizing all measured values. The images obtained were converted into a format that could be processed by deep learning algorithms, and character analyses were performed. In the study, 10 different metrics were used in the interaction analysis. These metrics were tweets, account age, follower rank, average retweet, average likes, diameter, density, density, reciprocity, centrality and modularity.
Descriptions of these metrics and their intended use are below:
$F R=\frac{F D}{F W}$ (1)
$C=\frac{N *(N-1)}{2}$ (2)
$D N=\frac{C}{P}$ (3)
The term eii in equation 6 is the probable percentage of the edges in module i, and ai in Eq. (7) is the percentage of the edges ending in at least one side of module i.
$e_{i i}=\left|\left\{(u, v): u \in V_{i}, v \in V_{i},(u, v) \in E\right\}\right| / E \vee$ (6)
$a_{i}=\left|\left\{(u, v): u \in V_{i},(u, v) \in E\right\}\right| / E \vee$ (7)
$M D=\sum_{i=1}^{c}\left(e_{i i}-a_{i}^{2}\right)$ (8)
Twitter data of 4,200 users were obtained using the Twitter Rest API. The data cover a maximum of eight months for each user. There were 1,871 users in the active category, 929 in the passive category, and 1,400 in the malicious category. As shown in Figure 3, data visualization preprocessing steps were applied to the data set after data selection, cleaning, reduction, augmentation, integration, conversion and optimization. In particular, the data set was guaranteed to contain an optimal number of samples using data augmentation and data reduction methods. After clearing the data set, the size reduction was achieved with a time series, and the variance difference was eliminated with Min–Max Optimization. Afterwards, all user data were visualized with deep learning, in accordance with image classification.
Figure 3. Pre-processing the data
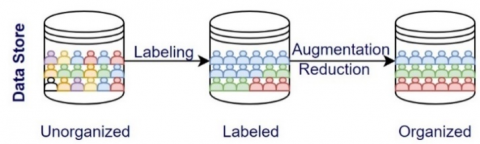
In data augmentation, different techniques such as rotation, translation and scaling were used. As shown in Figure 4, data reduction was applied to the active data in the data set, and data augmentation was applied to the passive data set to ensure the inclusion of an equal number of images from all three categories.
Figure 4. Process of labeling, reducing and increasing data
As a result, 673,440 metric data units and 2,820,000 tweets of 4,200 users were analyzed to measure interaction in the data set.
The data were created in visual format as in Figure 5 to be processed and classified by the image processing algorithms of the Convolutional Neural Networks with deep learning. In the classification methods applied to the images, the visuals created from the data obtained by the simple motion average can be analyzed in a better way and classified with better performance rates; therefore, the visuals created using this method have been used for deep learning.
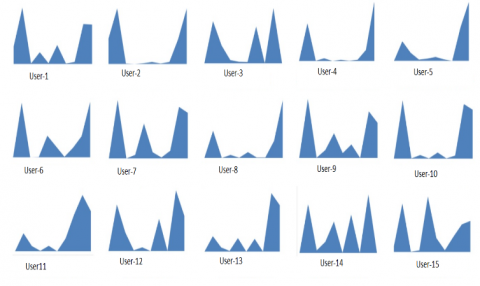
In the visualization process, different tools and methods were used to determine the most suitable format. Visualization can be created in formats such as field creation, spectrograms, color maps, histograms and scatter plots. Figure 5 shows 27 images obtained from the metric data of Twitter users.
Advanced hardware is needed in image classification with deep learning. To overcome this issue, 4,200 user images were divided into six sub-data sets. Each dataset containing 700 images included the same proportion of data from the three classes – active, passive and malicious.
3.2 Methods
Deep learning is a version of feature engineering that has evolved into architectural structural engineering and that forms the basis of machine learning. In Artificial Neural Networks, the network becomes incapable of analysis and system performance decreases when the number of hidden layers exceeds five to ten. Deep learning architectures, on the other hand, solve this problem with their multilayered structures and the hyper parameters they use.
Figure 5. Deep learning data set sample images
Figure 6. Methodology applied in the classification of twitter users based on their interactions
Deep learning architectures aim to make big calculations with big data. In deep learning, the design of the multilayered Artificial Neural Network, the number of layers, the number of neurons, the optimization algorithm to be used and the activation function have all been made more effective. With the increase in the hardware capabilities of graphics cards, RAM and processing power of computers in general, it has become possible to create more layers when designing the neural network. With a good architectural design and the use of appropriate hyper parameters, deep learning exhibits high performance in finding solutions to problems. With machine learning, information is extracted with algorithms applied to the features extracted from the data in Artificial Neural Network approaches. However, with many interlayers, filters and algorithms used in deep learning, the system itself can extract attributes during the learning process.
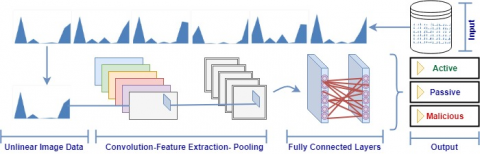
In this paper, the basic operations applied to the data obtained for the classification of Twitter users and the deep learning model structure are presented in Figure 6.
Qualities obtained from users have been converted into images. The images obtained are given as input to deep learning algorithms. Deep learning algorithms classify Twitter users (images) into active, passive and malicious categories. The basic architectures and parameters of deep learning algorithms were detailed in the following sections.
3.2.1 Convolutional Neural Networks (CNN)
Convolutional Neural Networks (CNN) are commonly used in image classification problems. In CNN, layers are arranged in three dimensions: width, height and depth. Additionally, neurons in one layer are connected to only a small portion of neurons in the next layer, not to all neurons. Finally, the final output is reduced to a single vector of probability points arranged across the depth dimension. In Convolutional Neural Networks, attributes are extracted and reproduced in the convolution layer. There are layers such as convolution, pooling and full connectivity in this architecture [20]. Figure 7 shows the CNN architecture applied to the images.
Figure 7. CNN architecture used in image classification with deep learning
CNN Architecture Layers:
3.2.2 Hyper parameters Used in Convolutional Neural Networks
Convolutional Neural Networks have parameters that must be entered manually by the designer. The classification category and data set size, number of filters to be used and filter size, activation function, learning coefficient, package size, optimization, and dilution and filtering processes to be applied on the image are all called hyperparameters – defined by the system designer [21].
In models created with the best combination of hyperparameters, education can be achieved with less cost and higher performance. The hyper parameters used can be collected into six groups [21]. These hyper parameters are:
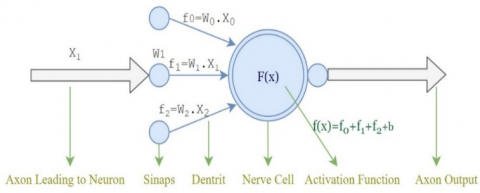
Figure 8. Using the activation function in a nerve cell [21]
A neuron in a neural network is the basic computing unit that receives n inputs and produces a single output. An artificial neuron calculates the sum of the weights, w, of the x inputs and adds a bias value to produce an output as in Eq. (9):
$f(x)=\operatorname{Activation}\left(\sum(w * x+b)\right)$. (9)
Activation is applied to the value transferred to the output of the artificial neural network, f(x). The value to which the activation function is applied will be the input of another layer. The output signal for values without the activation function becomes a simple linear function. The nonlinear activation functions enable stronger network learning. The activation functions commonly used in deep learning are ReLU, Leaky ReLU and ELU [21].
Although there are many Convolutional Neural Network models in published literature, the most common and highest performing ones are listed in this paper including LeNet, AlexNet, GoogleNet (ImageNet, Places365), ResNet (18, 50, 101), VGG (16, 19), InceptionV3, InceptionResnetV2, SqueezeNet, DenseNet201, MobileNetV2, ShuffleNet, Xception and Nasnet (Mobile, Large). The most important feature that distinguishes these models from each other is the number of layers, the arrangement of the layers and the number of parameters they use in image processing.
Analysis of 4,200 Twitter user images in this study requires sophisticated hardware. Classification algorithms have been carried out on 3 different platforms to identify active, passive and malicious users. In this paper, the classification of the data was carried out using the Google Colab cloud platform as well as Dell workstations and laptops. Google has developed the Colab platform to solve deep learning-related problems with advanced hardware [22]. Table 1 shows the platforms and features used for classification of Twitter users.
Table 1. Hardware specifications of the application platforms
|
Platform |
RAM |
CPU |
Display Card |
|
DELL Inspiron 15-7577 |
16 GB |
7 |
NVIDIA GeForce 1050 Ti |
|
Dell Precision 7820 Tower |
23GB |
32 |
NVIDIA Quadro P2000 |
|
Google Colab |
13.342 |
Tesla K80 GPU |
NVIDIA T4 GPUs |
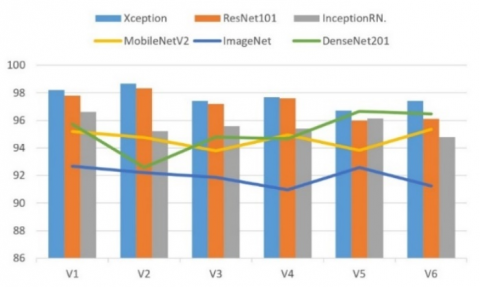
Convolutional Neural Network models were run in the Matlab environment and the performance on the dataset was tested according to different parameters. These parameters are the hyper parameters such as filter number, filter size, activation function, optimization and image preprocessing. With deep learning architectures like Xception, ResNet18, ResNet50, ResNet101, InceptionResNetV2, MobileNetV2, ImageNet, DenseNet201, NasnetLarge, InceptionV3, SqueezeNet, AlexNet, VGG16 and VGG19, data were classified using the most appropriate parameters. With these models applied to the data set on multiple platforms with different hyper parameters, a total of 200 training iterations were carried out, and the results of the applications were analyzed. In the analyses, those with an average performance of over 90% with these models were evaluated and detailed architectural and hyper parameter analyses were performed. The performance rates were obtained for Xception, Resnet101, InceptionRN, MobileNetV2, ImageNet and DenseNet201, which are the Convolutional Neural Network models used in the study. Classification performance results for these models with 6 different data sets are presented in Table 2 and Figure 9.
In the classifications, the best result in the Dell Precision 7820 Tower platform with 10 epochs and 10 package parameters was obtained with the Xception model resulting in a success rate of 98.67%, followed by ResNet101 and DenseNet201, respectively. The success rates achieved in the first six training models were above 90%.
In the classifications, the best results in the DELL Inspiron 15-7577 platform were obtained by the Xception model with 5 epochs and 4 package parameters, with a 96.67% performance level (Table 3). This was followed by ResNet101 and DenseNet201, respectively. The success rates achieved in the first six training models were above 88%. Table 4 shows the performance rates compared by hyper parameters.
Table 4 shows the hyper parameters used by deep learning algorithms. The hardware resource consumptions of these algorithms are shown comparatively in terms of optimization types, learning rate and epoch/iteration types. The effects of hyper parameters used by algorithms on their success were determined.
The study of classification of visuals with deep learning on the Google Colab platform was very successful. The classification training process continued until the entire epoch and repetition was completed, and then the success rates were obtained. Fifty pictures were taken per iteration. The data were divided into three classes. The training was carried out with 1000 epochs. Class vectors were converted to binary form. A CONV layer with ReLU activation, consisting of 8 filters of 2×2 size, was added. Additionally, a CONV layer with ReLU activation, consisting of 16 filters of 3×3 size, was added. The MAXPOOL layer, consisting of a 2×2 size frame, was added and 20% of the neurons were dropped so that new properties could be detected each time. A ReLU activation FC layer consisting of 32 neurons was added and 25% was dropped in each iteration. Softmax-activated neurons were added to the output layer equal to the number of classes. The Rmsprop optimization method and cross entropy loss function were used, and training was carried out. Table 5 shows the classification performance and hyper parameters for each platform.
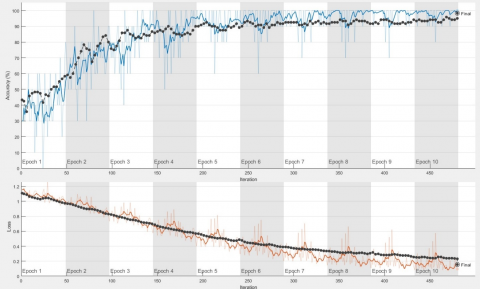
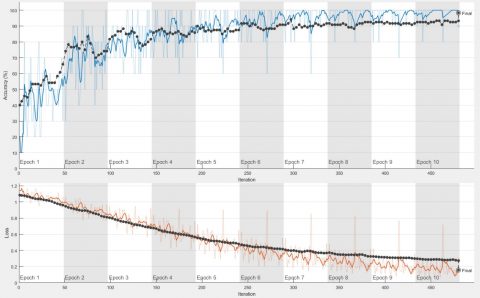
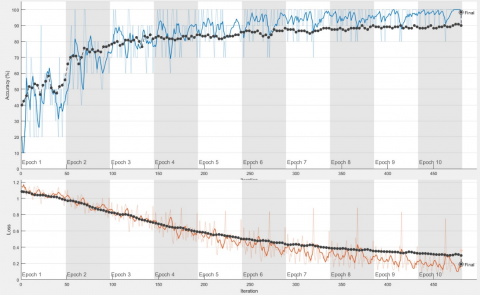
In the studies carried out in the Google Colaboratory – with the advantage of its hardware resources – the training processes could be performed more accurately, and a success rate of 99.04% was achieved. In experimental studies performed in the Matlab environment with a Dell Precision 7820 Tower workstation, the performance and error graphs of the three most successful (Xception, Resnet101, Densenet101) of the six algorithms (DenseNet201, ImageNet, Xception, ResNet101, MobileNetV2 and InceptionRN) are presented in Figures 10, 11 and 12.
Figure 9. Classification of performance rates
Table 2. Performance ratings of classification done in a dell precision 7820 tower workstation environment (%)
|
Model |
D1 |
D2 |
D3 |
D4 |
D5 |
D6 |
A.P. |
M.S.R. |
|
Xception |
98.20 |
98.67 |
97.42 |
97.67 |
96.70 |
97.41 |
97.67 |
98.67 |
|
ResNet101 |
97.80 |
98.33 |
97.20 |
97.62 |
96.00 |
96.10 |
97.17 |
98.33 |
|
InceptionRN |
96.62 |
95.20 |
95.58 |
95.40 |
96.13 |
94.76 |
94.94 |
95.58 |
|
MobileNetV2 |
95.20 |
94.75 |
93.80 |
94.96 |
93.83 |
95.35 |
94.64 |
95.35 |
|
ImageNet |
92.67 |
92.20 |
91.87 |
90.96 |
92.59 |
91.24 |
91.92 |
92.67 |
|
DenseNet201 |
95.73 |
92.57 |
94.80 |
94.67 |
96.67 |
96.48 |
95.15 |
96.67 |
(D: Data Set, A.P.: Average Performance, M.S.R.: Most Successful Result)
Table 3. Performance ratings of classification studies done in the DELL Inspiron 15-7577 environment (%)
|
Model |
D1 |
D2 |
D3 |
D4 |
D5 |
D6 |
A.P. |
M.S.R. |
|
Xception |
96.20 |
95.87 |
96.42 |
96.67 |
95.70 |
96.41 |
96.21 |
96.67 |
|
ResNet101 |
95.80 |
94.92 |
95.20 |
95.62 |
96.00 |
95.10 |
95.44 |
96.00 |
|
InceptionRN |
89.62 |
89.20 |
90.67 |
90.40 |
90.13 |
89.76 |
89.96 |
90.67 |
|
MobileNetV2 |
89.20 |
88.75 |
89.80 |
87.96 |
89.83 |
90.00 |
89.25 |
90.00 |
|
ImageNet |
89.33 |
88.82 |
87.95 |
88.94 |
89.25 |
89.02 |
88.88 |
89.33 |
|
DenseNet201 |
91.73 |
92.57 |
91.80 |
92.67 |
92.62 |
91.48 |
92.14 |
92.67 |
Table 4. Performance rates based on hyperparameters
|
Model |
Optimization (Solver) |
Learning Rate |
Iteration/Max Iteration/Epoch |
Process (+/-) |
Max Success |
|
Xception |
Sgdm |
0.0001 |
530/530/10 |
+ |
98.67 |
|
Xception |
Rmsprop |
0.0001 |
530/530/10 |
+ |
95.87 |
|
Xception |
Adam |
0.01 |
530/530/10 |
+ |
95.70 |
|
ResNet101 |
Sgdm |
0.0001 |
480/480/10 |
+ |
98.33 |
|
ResNet101 |
Rmsprop |
0.01 |
480/480/10 |
+ |
95.44 |
|
ResNet101 |
Adam |
0.0001 |
480/480/10 |
+ |
94.92 |
|
InceptionRN |
Sgdm |
0.0001 |
480/480/10 |
+ |
95.58 |
|
InceptionRN |
Rmsprop |
0.0001 |
480/480/10 |
+ |
84.44 |
|
InceptionRN |
Adam |
0.0001 |
284/480/10 |
- |
83.28 |
|
MobileNetV2 |
Sgdm |
0.0001 |
480/480/10 |
+ |
95.35 |
|
MobileNetV2 |
Rmsprop |
0.0001 |
480/480/10 |
+ |
93.75 |
|
MobileNetV2 |
Adam |
0.01 |
130/480/10 |
- |
92.96 |
|
ImageNet |
Sgdm |
0.0001 |
530/530/10 |
+ |
92.67 |
|
ImageNet |
Rmsprop |
0.01 |
378/530/10 |
- |
91.82 |
|
ImageNet |
Adam |
0.0001 |
243/530/10 |
- |
89.95 |
|
DenseNet201 |
Sgdm |
0.0001 |
480/480/10 |
+ |
96.67 |
|
DenseNet201 |
Rmsprop |
0.0001 |
480/480/10 |
+ |
94.57 |
|
DenseNet201 |
Adam |
0.0001 |
140/480/10 |
- |
93.48 |
(Process, +: Completed, -: Not Completed.)
Table 5. Classification performance by hyper parameters
|
Platform |
RAM |
CPU |
Epoch/Package Number |
Filter Number/Size |
Success |
|
DELL Inspiron 15-7577 |
16 GB |
7 |
5/4 |
8/2×2 |
96.67 |
|
Dell Precision 7820 Tower |
23 GB |
32 |
5/12 |
8/2×2 |
98.67 |
|
Google Colab |
13.342 GB |
Tesla K80 GPU |
1000/50 |
16/3×3 |
99.04 |
Figure 10. Accuracy–loss graph with Xception using 10 epochs and 10 package parameters
Figure 11. Accuracy–loss graph with Resnet101 using10 epochs and 10 package parameters
Figure 12. Accuracy–loss graph with Densenet201 using 10 epochs and 10 package parameters
One of the biggest problems in social media platforms such as Twitter are bots, sybils, and fake and spam accounts, which are usually controlled by automated software used for malicious activities. It is important to identify bot, sybils, and fake and spam accounts to identify the source of inaccurate information, thereby preventing disinformation and manipulation. In this paper, a different solution was offered to solve this problem. Table 6 shows the achievements and comparison of the methodologies proposed in this paper compared to the studies conducted with deep learning and different categories. Comparison of the literature with the results obtained through the proposed method is presented in Table 6.
According to Table 6, the classification performance is high because the visualization of user metrics is simple. For this reason, the features representing the users could be extracted correctly during deep learning, and consequently, Twitter users were classified with high accuracy. This simplicity is the biggest factor in achieving high performance. Regarding the problem of categorizing social media accounts targeted in the classification, the classification of Twitter users can be done successfully, although it would require updating and increasing the number of metrics in a study on the data from different platforms. In terms of deep learning, the originality of this paper is that the method used has never been the subject of any other study. The best performance percentages for the Xception, ResNet101 and DenseNet201 algorithms which yielded the best results in the classification made with the Convolutional Neural Network models with deep learning were 98.67%, 98.33% and 96.67%, respectively. In this paper, profile pictures of social media users, the pictures they share and other interactions with the visuals were not included in the data set. In this respect, the data set is open to development. Depending on the results, valuable indicators about deep learning practices were obtained. It is possible to increase the classification performance by using an optimized learning model and appropriate hyper parameters. The lack of hardware resources for such studies is the biggest factor affecting the performance.
Table 6. Methods and performance used in some studies in literature
|
Ref. |
Method |
Dataset/Features |
Success (%) |
|
[15] |
BeDM |
5658 Accounts; 5,122,000 Tweet, LSTM Memory: 256 |
87.32 |
|
[23] |
CNN |
1.2 Million Images, 1000 Classes, 60 Million parameters |
84.7 |
|
[24] |
CNN |
1.2 Million Images, 1000 classes, Training rate: 0.00001 |
86.4 |
|
[25] |
CNN |
180 Images, CNN Filter; Size:224, Batch Size:6, |
95-97 |
|
[26] |
CNN |
480 Images, 7 Layer Self Designed CNN |
90-94 |
|
[27] |
CNN |
52,000 Images, 96 different 11*11 filters, 0.0010172 learning rate, |
98.00 |
|
Proposed Method |
CNN |
673,440 metrics, 2,820,000 tweets, 4,200 users’ images, 3 classes, |
98.67 |
In social networks, users can be grouped according to their activity and basic descriptive qualities, or they can be grouped according to their behavior on the network [28, 29]. As in daily life, users cannot be divided into highly distinct groups on social networks, and their relationship types cannot be excluded only by what they share, or by their descriptive qualities. The interactions and relationships of profiles with multiple communities may differ. However, the studies show that there is a similarity between the daily life characteristics of social network users and their behavior on social media platforms. In this paper that focuses on this identification, behavioral analyses were made on the structure of the interactions of the social media users, and the classification processes were categorized into categories that would be compatible with their characters by creating an updated data set. In the experimental results, it was shown that the classification models performed to a high degree.
The data set used in the paper was up-to-date and comprehensive, which is one of the main reasons for an effective result. The high-performance rates of the most popular deep learning algorithms used in the classification revealed the accuracy of the applied methodology. As a result, achieving 98.67% success in classifying social media users with deep learning methods is an indication that it has brought a successful solution to the detection of active, passive and malicious Twitter accounts. However, hardware qualification is one of the key parameters to improve performance. Considering the results obtained, deep learning algorithms are very promising methods for the classification of social network users. It is possible to increase the classification performance by using an optimized learning model and appropriate hyper parameters.
[1] Kemp, S. We are Social Digital 2019 and Global Digital Statshot Report. https://wearesocial.com/, accessed on February 3 2021.
[2] Global Web Index 2019 Report, https://www.globalwebindex.com/reports/trends-20/, accessed on February 3 2021.
[3] İŞ, H., Tuncer, T. (2018). Confidence index analysis of Twitter users timeline. 2018 International Conference on Artificial Intelligence and Data Processing (IDAP), Malatya, Turkey, pp. 1-8. https://doi.org/10.1109/IDAP.2018.8620917
[4] Varol, O., Ferrara, E., Davis, C.A., Menczer, F., Flammini, A. (2017). Online human-bot interactions: Detection, estimation, and characterization. arXiv preprint arXiv:1703.03107.
[5] Smith, C. 400 amazing twitter statistics and facts, https://expandedramblings.com/index.php/, accessed on February 3 2021.
[6] Ferrara, E., Varol, O., Davis, C., Menczer, F., Flammini, A. (2016). The rise of social bots. Communications of the ACM, 59(7): 96-104. https://doi.org/10.1145/2818717
[7] Twopcharts Twitter Report 2018, https://twopcharts.com/tweetanalysis, accessed on February 3 2021.
[8] İş, H., Tuncer, T. (2019). Interaction-based behavioral analysis of twitter social network accounts. Applied Science, 9: 4448. https://doi.org/10.3390/app9204448
[9] Chen, C., Wang, Y., Zhang, J., Xiang, Y., Zhou, W., Min, G. (2017). Statistical features-based real-time detection of drifted twitter spam. IEEE Transactions on Information Forensics and Security, 12(4): 914-925. https://doi.org/10.1109/TIFS.2016.2621888
[10] Amato, F., Castiflione, A., Santo, A.D., Moscato, V., Picariello, A., Persia, F., Sperli., G. (2018). Recognizing human behaviours in online social networks. Computer and Security, 74: 355-370. https://doi.org/10.1016/j.cose.2017.06.002
[11] Adewole, K.S., Han, T., Wu, W., Song, H., Sangaiah, A.K. (2018). Twitter spam account detection based on clustering and classification methods. The Journal of Supercomputing, 76: 1-36. https://doi.org/10.1007/s11227-018-2641-x
[12] Vorakitphan, V., Leu, F.Y., Fan, Y.C. (2018). Clickbait detection based on word embedding models. In: Barolli L., Xhafa F., Javaid N., Enokido T. (eds) Innovative Mobile and Internet Services in Ubiquitous Computing. IMIS 2018. Advances in Intelligent Systems and Computing, vol 773. Springer, Cham. https://doi.org/10.1007/978-3-319-93554-6_54
[13] Aiyar, S., Shetty, N.P. (2018). N-gram assisted YouTube spam comment detection. Procedia Computer Science, 132: 174-182. https://doi.org/10.1016/j.procs.2018.05.181
[14] Kiliroor, C.C., Valliyammai, C. (2019). Social context based naive bayes filtering of spam messages from online social networks. In: Nayak J., Abraham A., Krishna B., Chandra Sekhar G., Das A. (eds) Soft Computing in Data Analytics. Advances in Intelligent Systems and Computing, vol 758. Springer, Singapore. https://doi.org/10.1007/978-981-13-0514-6_66
[15] Cai, C., Li, L., Zeng, D. (2017). Behavior enhanced deep bot detection in social media. 2017 IEEE International Conference on Intelligence and Security Informatics (ISI), Beijing, China, pp. 128-130. https://doi.org/10.1109/ISI.2017.8004887
[16] Yang, K.C., Varol, O., Hui, P., Menczer, F. (2020). Scalable and generalizable social bot detection through data selection. Proceedings of the AAAI Conference on Artificial Intelligence, 34: 1096-1103. https://doi.org/10.1609/aaai.v34i01.5460
[17] Xing, L., Deng, K., Wu, H., Xie, P., Gao, J. (2019). Behavioral habits-based user identification across social networks. Symmetry, 11(9): 1134. https://doi.org/10.3390/sym11091134
[18] Antony, A., Dhandharia, S., Gupta, S., Azhagiri, M. (2019). Application of deep learning in analysis of age groups based on social media interactions. International Journal of Scientific & Technology Research, 8(11).
[19] Long, C., Collins, R., Swears, E., Hoogs, A. (2019). Deep neural network in fully connected CRF for image labeling with social network metadata. 2019 IEEE Winter Conference on Applications of Computer Vision (WACV), Waikoloa, HI, USA, pp. 1607-1615. https://doi.org/10.1109/WACV.2019.00176
[20] Amidi, A., Amidi, S. Convolutional Neural Networks, https://stanford.edu/~shervine/l/tr/teaching, accessed on February 3 2021.
[21] CS231n: Convolutional Neural Networks for Visual Recognition, http://cs231n.stanford.edu/index.html, accessed on February 3 2021.
[22] Google Colaboratory, https://colab.research.google.com/, accessed on February 3 2021.
[23] Krizhevsky, A., Sutskever, I., Hinton, G.E. (2017). ImageNet classification with deep convolutional neural networks. Communications of the ACM, 60(6): 84-90. https://doi.org/10.1145/3065386
[24] Howard, A.G. (2013). Some improvements on deep convolutional neural network based image classification. arXiv 1312.5402.
[25] Luaibi, A.R., Salman, T.M., Miry, A.H. (2021). Detection of citrus leaf diseases using a deep learning technique. International Journal of Electrical and Computer Engineering, 11(2): 1719. http://doi.org/10.11591/ijece.v11i2.pp1719-1727
[26] Malakar, S., Chiracharit, W. (2020). Detection of text and non-text signs using convolutional neural networks. International Conference on Engineering and Industrial Technology 2020 (ICEIT2020).
[27] Salama, A., Hassanien, A.E., Fahmy, A. (2019). Sheep identification using a hybrid deep learning and Bayesian optimization approach. IEEE Access, 7: 31681-31687. https://doi.org/10.1109/ACCESS.2019.2902724
[28] İş, H., Tuncer, T. (2019). Kalite Ölçekleme Kriterleri ile Sosyal Ağ Hesaplarının Etkinliğinin Belirlenmesi. Fırat Üniversitesi Mühendislik Bilimleri Dergisi, 31(1): 99-108.
[29] Iş, H., Tuncer, T. (2018). Twitter users’ emotion, emoticons and scaling metrics based categoric interaction analysis. Journal of Engineering Technology, 2(2): 10-18.