Fatih Titrek* | Ömer Kaan Baykan
© 2020 IIETA. This article is published by IIETA and is licensed under the CC BY 4.0 license (http://creativecommons.org/licenses/by/4.0/).
OPEN ACCESS
In recent years, Finger Vein (FV) Recognition System is frequently used where personal security is required. Image distortion caused by light scattering in the tissue is one of the major problems about the visibility of the FV. In this study, Homomorphic Filter and Anisotropic Diffusion are used for removing the light scattering problem in our captured FV image and to increase the visibility of the veined region. Novelty of the study is proposing two new features: Horizontal Total Proportion (HTP) and Vertical Total Proportion (VTP). These two new features were used together with both spatial and frequency domain features and it was observed that the success rates obtained by our attributes were significantly increased. Experimental results demonstrate that the proposed HTP and VTP features are effective and reliable to improve the classification success in FV recognition problem. According to the experiments, the use of Perona-Malik and Homomorphic Filter together has been shown to reduce the light scattering problem and improve vascular visibility by removing the noise in the finger vein image. In this study, four different classifiers are used: Complex Tree, Ensemble, Support Vector Machines (SVM), K-Nearest Neighbors (KNN). The best success rate was achieved by using the KNN classifier.
anisotropic diffusion, biometrics, feature extraction, finger vein recognition, HVTP features
Biometric recognition systems are becoming more important in the world and are being implemented in companies where security is at the forefront. Despite the fact that fingerprint, iris and face recognition are used for security, monitoring and access control, finger vein recognition systems have distinct advantages over other biometric recognition systems; User-friendly, vivid tissue detection, high reliability and little equipment space requirement [1]. For example, although the fingerprint is the most widely used biometric identification method, its presence on the outer surface of the skin creates safety gaps and can be easily copied. Iris and retina recognition systems come to the fore in terms of reliability. In practice, the difficulties that people have shown in bringing their eyes closer to a light source have been the biggest obstacle in spreading this recognition system. Facial recognition systems have difficulties in terms of sustainability, noise and reliability. As the vein recognition system eliminates all these difficulties, it has been used as an additional security measure in order to increase the reliability of the security methods used by the major financial sectors and banks in various countries of the world [2-4]. For example, in many countries, vein recognition systems have become more popular than fingerprint recognition systems, and vein recognition has become a preferred security method [5].
FV images are obtained using near infrared (NIR) wavelength rays. According to researches, it is determined that NIR rays can pass through human skin and absorbed by hemoglobin in the vessel at wavelengths between 740-960 nm [6]. Therefore, the reflection of the infrared ray is less in the tissue where the veins are dense and therefore the regions where the veins are dense appear dark. This can be visualized using near infrared sensitive Charge Couple Device (CCD) cameras [6]. In a study by Kumar and Zhou, it was shown that the FV images are different even in identical twins and the vascular network of each finger is different from each other [7].
However, despite all these distinctive features of the FV, there are some difficulties in the use of FV images. Light scattering in the tissue and thus image defect is one of the main problems that occur when FV image is taken by CCD cameras [8]. This light scattering problem significantly affects the visibility of the vessels as poorly and reduces the success of classification [9]. For these reasons, in this study, Homomorphic Filter and Perona-Malik Diffusion, have been applied in order to get rid of the light scattering in our captured image, to increase the image quality and the visibility of the vein regions and to prepare our image for segmentation step. In addition, two new features have been proposed based on the ratio of the distance between the veins intersecting the horizontal and vertical lines passing through the center of gravity of the FV images in order to improve the classification success in FV recognition.
The rest of this paper is organized as follows. Section 2 provides information about some of the studies in the literature for FV recognition. Information about the main methods used in this study can be found in Section 3. In Section 4, information can be found about the flowchart of our algorithm and the definitions of the new attributes we propose. The results of our study and comparisons of similar studies in the literature are explained in Section 5. Finally, the conclusion of this study is shown in Section 6.
Due to the poor quality of the FV images, many studies have been carried out in the field of improving FV images. Histogram equalization based studies have been performed to improve contrast in vascular images [10]. In his study, Fu et al. [11] combined Fuzzy and Retinex theory to improve vascular images obtained by near infrared-sensitive cameras. Pi et al. [12] has tried to reduce the noise in the vessel images by using the edge-protected filter and the elliptical high pass filter. In his study, Gao et al. [13] used histogram equalization method and a filter that increases the high frequency in the image to increase the contrast. Oh and Hwang [14] tried to improve the visibility of dark blood vessels with a morphologically based Homomorphic Filter. Lee et al. [15] and Rosdi et al. [16] tried to improve the discrimination of FV images using Gaussian Based High Pass Filter. In the studies of Yang and Shi [17], a new Directional Filter method based on Gabor Filter was used to increase the visibility of the vascular region. Shin et al. [18] improved the FV visibility using the Fuzzy-Based Fusion Method with the help of 4-way Gabor Filter and Retinex Filter. Light scattering is one of the most important factors affecting image quality poorly. Optical model based scattering remove has been performed to minimize the effects of light scattering and increase the visibility of the vein areas on the fingers [8]. Studies such as Multi-channel Gabor filter design that uses the orientation information of the veins to increase the visibility of the veins in the fingers [19], Hybrid methods based on Gabor Wavelets and Circular Gabor Filter [20], also some methods using the Angle and Firengi Filter together [21] have been made.
In the literature, different methods have been used to extract descriptive features from images of FV networks. In the study performed by Ma and Zhang in 2019, a new method based on finger vein patterns was proposed by extracting the region of interest and oriented elements features [22]. In 2018, JosephP and Ezhilmaran investigated the efficiency of affine invariant features using fuzzy image retrieval in FV biometrics [23]. In 2017, Yang et al. [24] by using a method based on Adaptive Vector Field Estimation, they performed FV matching by comparing the extracted attributes. In 2016, Matsuda et al. [25] made FV Authentication based on Feature Point Matching. In the study performed by Guan et al. [26], using FV images taken from 292 individuals, the features extracted with the help of Wavelet Transform and Principal Component Analysis (PCA) were classified with Nearest Neighbor method and the success rate reached up to 94.35%. Wang et al., using the Harbin Engineering University FV database of 300 people, proposed selecting a sub-block approach and extracting PCA features after performing wavelet moment. They proposed a method of fuzzy matching scores for matching and identification after LDA transform is performed. The error rate FAR that they have achieved was 0.7% and the rejection rate FRR was 1.05% [27]. In the study performed by Yang and Li with images taken from 100 people, the energy properties extracted by the help of steerable filter by determining the location of the finger according to the finger joint, and the identification process was carried out by classifying with the Nearest Neighbor Classification Technique and obtained the highest success rate of 98.7% [28]. Mean curvature was used in the study conducted by Song et al. on a database consisting of 125 classes by eliminating noise with Gaussian Straightening Filter and the proposed method achieves 0.25% equal error rate [29]. Despite these studies in the literature, some extra studies are needed to improve the quality of FV images and to obtain more discriminative features.
In this article, after reduce the light scattering problem of the image by using Homomorphic Filter, Perona-Malik which is a Nonlinear Anisotropic Diffusion Filter is used to reduce the noise in FV images and to improve image quality. In addition, studies have been done to obtain new features that will increase the success rate in FV networks.
3.1 Finger vein image database
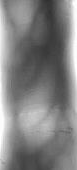
Yang and Zhang [30] was asked to submit a database of FV images. The finger vein database consists of 15 index finger images of 64 persons. The dimensions of the samples in our database are 170x80 pixels on average and *.jpg format. Our database consists of 960 images in total. FV images were obtained via NIR sensitive CCD camera using NIR light source at 760 nm wavelength [28]. Figure 1 shows a sample FV image from the database.
Figure 1. Original FV image
3.2 Homomorphic filter
Homomorphic Filters are widely used in digital image processing to enhancement and restoration to get rid of local imbalances in exposure. This exposure imbalances usually occur when a part of an object is strongly illuminated while the other part of the object is slightly illuminated. The difference between the illumination can depends on the property of the object under the light source. Since biological tissues have a high degree of inhomogeneous optical environment, there may be lots of light scattering in the images obtained with these entering rays [14].
Homomorphic Filter is based on the theory that the light distribution in a digital image is defined by a multiplication of the reflectance of the objects and the scene illumination as described by:
$Image(x, y)=\operatorname{Light}(x, y) *RefObj (x, y)$ (1)
where, Light(x,y) is the intensity of the illuminating Light source and RefObj(x,y) is the reflectance of the object between 0 and 1. Transforming the image into the log domain, this can be expressed in the density domain as
$\ln (I)=\ln (L)+\ln (\rho)$ (2)
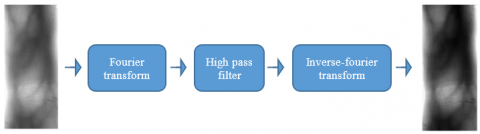
thereby creating a new image description, $\ln (L)$ is low pass and $\ln (\rho)$ is high pass and we have an $\operatorname{Image} I=\ln (I)$ which has additive noise can be selectively filtered by a linear filter. Since the illumination is assumed to have low-pass characteristics, the filter needs to be high pass with sufficiently large spatial support to cover the variations of the illuminating lightsource [31]. This leads to the common implementation of the above equation taking a Fourier Transform, applying High Pass Filter and taking the inverse Fourier Transform It has effectively divided the lightsource contributions out of the image. The certain contributions of the lightsource are still in the image, whereas certain contributions of the object are no longer present, based upon the quality of the filter choice. Figure 2 shows the operation steps, input and output pictures of the Homomorphic Filter.
Figure 2. Flowchart of homomorphic filter
3.3 Perona-Malik diffusion
Smoothing is the result of a diffusion process. Diffusion processes derive from Fick’s law [32] is a physical process which balances the concentration difference without destroying the data. So that smoothing process can be considered as a diffusion process. Perona-Malik Diffusion, which is an Anisotropic Diffusion, is the space variant smoothing filter depending on the data content [33, 34]. This technique reduces the high frequency components, without removing significant parts of the data content.
Diffusion equation can be considered as [34]:
$\frac{\partial u}{\partial t}=\frac{\partial}{\partial x}\left(C \cdot \frac{\partial}{\partial x} u\right)$ (3)
where, C is the diffusion coefficient, u is the input data. If the value of C=1 then the result will be the same as the Linear Diffusion filter, and Diffusion Equation will be:
$\frac{\partial u}{\partial t}=\frac{\partial^{2}}{\partial x^{2}} u$ (4)
The idea of Perona-Malik is making the diffusivity signal dependent. The value of C must be between 0 and 1. When the process is near significant parts of the data, the value of C converges to 0 in the other parts of the data it converges to 1. The value of C is determined in Eq. (5) by using the magnitude of the first derivative
$C=g\left(\frac{\partial}{\partial x} u\right)^{2}$ (5)
by using Eq. (5) in Eq. (3), anisotropic Perona-Malik Diffusion Equation [35] is obtained in Eq. (6):
$\frac{\partial u}{\partial t}=\frac{\partial}{\partial x}\left(g\left(\frac{\partial}{\partial x} u\right)^{2}\right)$ (6)
The result is obtained in Eq. (7):
$g\left(\frac{\partial}{\partial x} u\right)=\frac{1}{\left(1+\left(\frac{\left(\frac{\partial}{\partial x} u\right)^{2}}{\lambda^{2}}\right)\right)}$ (7)
Lambda (λ) term in Perona-Malik equation can be thought as a contrast parameter separating regions of forward diffusion from regions of backward diffusion.
3.4 Niblack segmentation
The FV pictures have some contrast and light scattering problem. That’s why multi-thresholding methods is needed. Niblack’s Segmentation Algorithm [36] is one of the locally adaptive thresholding methods. In this algorithm, a kind of multi-thresholding segmentation method is used and threshold calculates at each pixel and this depends on the local variance. This method calculates the local average and local standard deviation by using Eq. (8).
$\mathrm{T}(\mathrm{i}, \mathrm{j})=\mathrm{m}(\mathrm{i}, \mathrm{j})+k \cdot \sigma(\mathrm{i}, \mathrm{j})$ (8)
In the Eq. (8), m(i,j) is the average value of the number of pixels, σ(i,j) is the standard deviation in a fixed size (i,j) window and k is a constant value which will be chosen by the user. The size of the window should be chosen as small as possible to preserve the details in the picture. At the same time it has to be chosen big enough to suppress the noise.
In the present study, we concentrate on two basic problems which are Image Enhancement by using Perona-Malik Diffusion and Definition of a New Feature. A finger vein identification system is proposed in Figure 3 which consisting of the captured image database, preprocessing step to get rid of the noise, segmentation, post processing step, feature extraction and classification.
Figure 3. Flowchart of FV identification algorithm
Homomorphic Filter and Perona Malik, which is a nonlinear anisotropic diffusion, are used to remove the noise and get rid of the light scattering problem on the image. Niblack Segmentation is implemented to separate venous area from the tissue. Morphological operations are used for post-processing to enhance the image. Skeletonization is used to acquire the skeleton of the venous area. Some features such as Centroids, Entropy and Standard Deviation are extracted from the image to be able to use in classification step. In addition, the success rate has been improved by defining new features which are Horizontal Total Proportion (HTP) and Vertical Total Proportion (VTP). Horizontal and Vertical Total Proportion (HVTP) features will be detailed in “Definition of New Feature Step”. K Nearest Neighbors (KNN) Classification is used for identifying the images on the database.
Extracted images along the flow diagram obtained using a sample FV image and finally the extracted version of the FV network are shown in Figure 4. Occurrence of the light scattering is explained by visualization in Figure 5 [8]. Preprocessing result, after applying Homomorphic Filter and Perona-Malik respectively to the input image, are shown in Figure 6.
Figure 4. Flowchart result of FV identification algorithm. (a) Original FV, (b) Preprocessing result (after applying homomorphic and Perona-Malik respectively), (c) Niblack segmentation result, (d) Result of morphological process
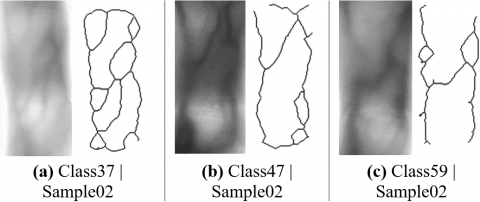
The vein images extracted from each sample image of different classes are shown in Figure 7.
Light scattering phenomenon:
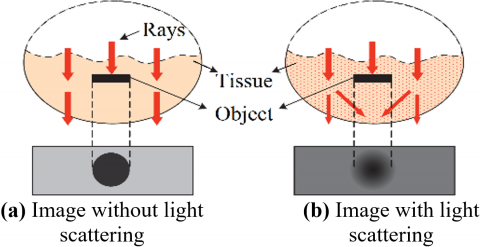
Light scattering is one of the most important elements affecting image quality poorly. FV images are obtained using NIR wavelength rays. According to researches, NIR rays can pass through human skin and absorbed by hemoglobin in the vessel. The reflection of the NIR rays is less in the tissue where the veins are dense and therefore the regions where the veins are dense appear dark. This can be visualized using NIR sensitive CCD camera. When biological tissues are considered as an inhomogeneous optical medium, multiple light scattering occurs in the image that penetrate this environment. Therefore, the quality of the finger vein images is poor as the effects of scattering greatly distort the contrast between the venous and non-venous areas [8, 9]. The formation of light scatter is shown in Figure 5.
In this study, to get rid of the light scattering from the image, Homomorphic Filter and Perona Malik, which is an anisotropic diffusion, are used. Thus, the effects of light scattering in the image have been reduced and the venous areas have been made more prominent. The result obtained after applying Homomorphic Filter and Perona-Malik to the input image is shown in Figure 6.
Definition of new features:
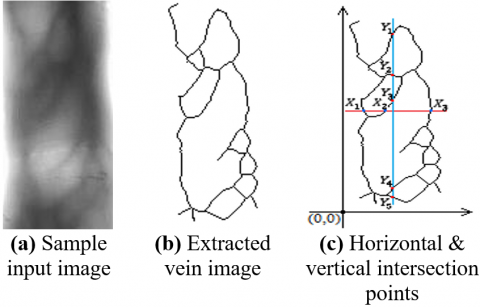
In this study, two new features extracted from the segmented FV images have been proposed in order to improve identification and classification performance in addition to the commonly used features in image processing. These properties are based on the proportional information of the FVs that cut the coordinates determined on the horizontal and vertical axis. In this way, the proportion of distance between the veins are the way to be used to differentiate the individuals.
The new features proposed in this study are subtracted from the skeletonized FV image obtained after applying the post processing steps in the Flowchart shown in Figure 3. The center of gravity of our extracted FV image was found as (Ax, Ay). The horizontal and vertical lines assumed to pass through this point are created. The coordinates of the FV points intersecting these lines are determined as in Figure 8.c. According to Figure 8.c, FV networks intersect at the 3 points shown as X1, X2 and X3 in the horizontal plane. The biggest subscript number shows the number of intersection (# of INTs) in the horizontal plane. The representation of the point X1 in the coordinate plane is (X1, Ay), the representation of the point X2 in the coordinate plane is (X2, Ay), and the representation of the point X3 in the coordinate plane is (X3, Ay).
Figure 5. The formation of light scattering, which causes distortion in the contrast of the vein image. Note: Image Adapted from [8]
Figure 6. Scattering removing experiment. (a) Original FV; (b) Light scattering removing result (after applying homomorphic and Perona-Malik respectively)
Figure 7. A sample from each of the 3 different classes and extracted vein images
Table 1. HTP and VTP values in different classes
|
|
Class37 | Sample02 |
Class47 | Sample02 |
Class59 | Sample02 |
|||
|
Sample # |
HTP |
VTP |
HTP |
VTP |
HTP |
VTP |
|
1 |
1.1739132 |
1.8016323 |
0.9787234 |
0.8658537 |
1.5932203 |
1.0361446 |
|
2 |
1.1739132 |
1.8377752 |
1.0212766 |
0.8711656 |
1.6206897 |
1.0299401 |
|
3 |
1.1489364 |
1.8377752 |
1.0434783 |
0.8658537 |
1.6206897 |
1.0361446 |
|
4 |
1.1489364 |
1.8656284 |
1.0212766 |
0.8780488 |
1.7271364 |
1.0361446 |
|
5 |
1.1471121 |
1.8126752 |
1.0434783 |
0.8834356 |
1.5593220 |
1.0361446 |
|
6 |
1.0869570 |
1.7750943 |
0.9787234 |
0.8711656 |
1.5932203 |
1.0361446 |
|
7 |
1.0833332 |
1.8656284 |
1.0000000 |
0.8834356 |
1.5593220 |
1.0361446 |
|
8 |
1.1739132 |
1.8150947 |
1.0212766 |
0.8834356 |
1.6868091 |
1.0361446 |
|
9 |
1.2173911 |
1.8421724 |
1.0000000 |
0.8834356 |
1.6881356 |
1.0240964 |
|
10 |
1.2000000 |
1.8016323 |
0.9787234 |
0.8711656 |
1.5254237 |
1.0240964 |
|
11 |
1.1304353 |
1.8421724 |
0.9583333 |
1.5602696 |
1.6215918 |
1.0361446 |
|
12 |
1.2173911 |
1.8510091 |
0.9583333 |
0.8711656 |
1.6868091 |
1.0361446 |
|
13 |
1.1063836 |
1.8469663 |
0.9583333 |
0.8711656 |
1.5593220 |
1.0361446 |
|
14 |
1.1111111 |
1.8510091 |
0.9583333 |
1.5883436 |
1.5932203 |
1.0361446 |
|
15 |
1.0869570 |
1.8377752 |
0.9787234 |
0.8711656 |
1.6206897 |
1.0299401 |
|
Mean |
1.1471121 |
1.8322691 |
0.9932680 |
0.9679400 |
1.6170402 |
1.033711 |
|
Standart deviation |
0.0458062 |
0.0257132 |
0.0307220 |
0.2463210 |
0.0579793 |
0.004460 |
HTP value was obtained by putting these coordinate points in Eq. (9).
$H T P=\left(\frac{X_{1}}{X_{2}}+\frac{X_{2}}{X_{3}}+\ldots\right) *(\# \text { of } I N T s$ (9)
Figure 8. HVTP features definition
Assuming on Figure 8.c, our VTP value is obtained using the points Y1,Y2,Y3,Y4,Y5 where the vertical line passes through the center of gravity shown as (Ax, Ay), intersects the vein. The representation of the point represented by Y1 in the coordinate plane is (Ax,Y1) the representation of the point represented by Y2 in the coordinate plane is (Ax,Y2) and go on. According to these coordinates using the Eq. (10) VTP value is obtained.
$V T P=\left(\frac{Y_{1}}{Y_{2}}+\frac{Y_{2}}{Y_{3}}+\ldots\right) *(\# \text { of } I N T s$ (10)
Table 1 shows the HTP and VTP values obtained from randomly selected sample images of different classes.
Mean and Standard Deviation values of each column are calculated and written on the bottom two rows of Table 1. It is shown according to these values that inner class values are close to each other and outer class values are far from each other.
The finger vein database consists of 15 index finger images of 64 persons. This database consists of 960 images in total. FV images were obtained via NIR sensitive CCD camera using NIR light source at 760 nm wavelength [28]. In this section, two different experimental studies have been carried out using spatial domain and frequency domain features. The k-fold cross validation technique was used for training and testing of the database. The considered k values for the cross validation are k=3 and 5.
5.1 Experiment 1
Using the Flowchart shown in Figure 3, feature vector was created by obtaining the center of gravity (x, y coordinates), Entropy, Standard Deviation, HTP and VTP features by 1x6 dimension for each FV image in the database. Depending on the quality and quantity of some metrics, the performance of different classifiers will change [37]. Complex Tree, Ensemble, SVM and KNN were used as classifiers in this study. For Complex Tree, 100 is defined as Maximum number of splits and Gini’s Diversity Index is used as Split criterion. In the Ensemble classifier, AdaBoost, Subspace, RUSBoost and Bag were used as methods, and the highest success was achieved with Bagged Trees. 1-to-1 multiclass classifier method was preferred and Linear Kernel Function was used for SVM. Different k values were tried for KNN and the best result was obtained for k=1. The performance of different distance metrics (Euclidean Distance, Mahalanobis Distance and City Block Distance) for KNN were examined and the highest classification accuracy was obtained by using City Block Distance. The k-fold cross validation technique was used for training and testing (k=3 and k=5). The results obtained are shown in Table 2.
In this study, in order to see the effects of the proposed HTP and VTP features on the classification performance, the HTP and VTP features were subtracted from the feature vector and the classification process was performed again. Classification accuracy for 5-fold cross validation is superior to 3-fold cross validation.
As shown in Table 2, in this experimental study, the classification performance of all classifiers increased when HTP and VTP were used. Thus, it can be said that the proposed HVTP features cause an increase in performance in all classifiers we use in the study.
5.2 Experiment 2
After the preprocessing step in the flowchart shown in Figure 3, 1x52 dimension feature vector was extracted for each image using Generic Fourier Descriptor [38] and Classification of FV images was performed using these features. The same classifiers and k-fold cross validation technique (k = 3 and k=5) used in Experimental 1 were used for classification. The best result for the SVM classifier was obtained using the Linear Kernel Function. The results obtained are presented in Table 2.
Table 2. Comparison of classification performance for different features and classifiers
|
Spatial domain |
Frequency domain |
|||||||||||||
|
Spatial domain features |
Spatial domain features + HVTP |
Fourier descriptors |
Fourier descriptors + HVTP |
|||||||||||
|
3-fold cross validation results |
3-fold cross validation results |
3-fold cross validation results |
3-fold cross validation results |
|||||||||||
|
Classifier |
Success |
Classifier |
|
Success |
Classifier |
|
Success |
Classifier |
|
Success |
||||
|
Complex Tree |
89.00% |
Complex Tree |
89.80% |
Complex Tree |
62.90% |
Complex Tree |
|
76.00% |
||||||
|
Ensemble |
84.20% |
Ensemble |
88.40% |
Ensemble |
62.30% |
Ensemble |
|
73.10% |
||||||
|
SVM |
93.20% |
SVM |
94.10% |
SVM |
97.60% |
SVM |
|
97.80% |
||||||
|
KNN |
|
95.80% |
KNN |
|
96.90% |
KNN |
|
98.75% |
KNN |
|
99.10% |
|||
|
5-fold cross validation results |
5-fold cross validation results |
5-fold cross validation results |
5-fold cross validation results |
|||||||||||
|
Classifier |
|
Success |
Classifier |
|
Success |
Classifier |
|
Success |
Classifier |
|
Success |
|||
|
Complex Tree |
90.80% |
Complex Tree |
91.90% |
Complex Tree |
59.80% |
Complex Tree |
|
73.60% |
||||||
|
Ensemble |
84.80% |
Ensemble |
88.10% |
Ensemble |
60.00% |
Ensemble |
|
71.60% |
||||||
|
SVM |
94.00% |
SVM |
94.80% |
SVM |
98.00% |
SVM |
|
98.20% |
||||||
|
KNN |
|
97.00% |
|
KNN |
97.40% |
|
KNN |
|
99.10% |
|
KNN |
|
99.20% |
|
Table 3. Comparison of training time and prediction speed for classifiers
|
|
|
Spatial domain |
|
Frequency domain |
||||||||||||
|
|
|
Spatial domain features |
|
Spatial domain features + HVTP |
|
Fourier descriptors |
|
Fourier descriptors + HVTP |
||||||||
|
|
|
3-fold cross validation results |
3-fold cross validation results |
3-fold cross validation results |
3-fold cross validation results |
|||||||||||
|
Classifier |
Training time (sec) |
Prediction speed (obs/sec) |
Training time (sec) |
Prediction speed (obs/sec) |
Training time (sec) |
|
Prediction speed (obs/sec) |
Training time (sec) |
|
Prediction speed (obs/sec) |
||||||
|
Complex Tree |
0.5195 |
82000 |
|
0.5339 |
|
77000 |
|
1.9408 |
|
42000 |
|
2.1223 |
|
41000 |
||
|
Ensemble |
|
2.9690 |
6300 |
|
3.0212 |
|
6200 |
|
5.0137 |
|
5500 |
|
5.1479 |
|
5100 |
|
|
SVM |
|
100.29 |
150 |
|
102.46 |
|
150 |
|
104.04 |
|
130 |
|
105.57 |
|
130 |
|
|
KNN |
|
0.3992 |
|
68000 |
|
0.4055 |
|
63000 |
|
0.5073 |
|
29000 |
|
0.5108 |
|
27000 |
|
|
5-fold cross validation results |
5-fold cross validation results |
5-fold cross validation results |
5-fold cross validation results |
||||||||||||
|
Classifier |
Training time (sec) |
|
Prediction speed (obs/sec) |
Training time (sec) |
Prediction speed (obs/sec) |
Training time (sec) |
|
Prediction speed (obs/sec) |
Training time (sec) |
|
Prediction speed (obs/sec) |
|||||
|
Complex Tree |
0.7192 |
50000 |
|
0.7406 |
|
48000 |
|
2.8542 |
|
26000 |
|
3.1584 |
|
25000 |
||
|
Ensemble |
|
4.3940 |
4400 |
|
4.6903 |
|
4200 |
|
8.0154 |
|
3700 |
|
8.1408 |
|
3600 |
|
|
SVM |
|
149.90 |
97 |
|
153.85 |
|
95 |
|
158.25 |
|
85 |
|
158.57 |
|
85 |
|
|
KNN |
|
0.4680 |
|
41000 |
|
0.4852 |
|
37000 |
|
0.5718 |
|
20000 |
|
0.5824 |
|
19000 |
Table 4. Results of the studies in the literature and the result of the proposed method
|
Study |
Method |
Features |
Database |
Classifier |
Success rate |
|
Ma and Zhang [22] |
The region of interest and oriented elements |
Texture characteristics |
167 class X 5 samples, |
Feature matching by correlation coefficient |
Success rate is 98.3% |
|
JosephP, Ezhilmaran [23] |
Fuzzy image retrieval |
Affine invariant features |
105 class X 6 samples |
ASIFT feature matching |
EER= 0.33% |
|
Guan et al. [26] |
Wavelet transform, PCA |
Wavelet moments |
292 class X 7 samples, Total= 2044 images. Samples normalized to 80x160 pixel |
K-NN |
Success rate is 94.35% |
|
Wang et al. [27] |
Oriented filtering, niblack segmentation |
Relative distance and angles, wavelet moments fused with PCA |
300 class X 5 samples. Total= 1500 images. Sizes of samples are 320x240 pixel |
LDA and fuzzy M.S. for matching & identification |
FAR= 0.7% , |
|
Yang and Li [28] |
Steerable filtering |
Energy features extracted by steerable filter |
100 class X 10 samples (right forefinger). Total= 1000 images. Sizes of samples are 70x170 pixel |
K-NN |
Success rate is 98.7% |
|
Wu and Ye [39] |
Neural network and radon transform |
Radon transform |
25 class X 20 samples (index&middle-finger). Total= 500 images. Samples are 130x130 cropped from 640x480 |
RBF, PNN |
Success rate by classify RBF = 98,3%, PNN = 99.2% |
|
Zou et al. [40] |
Template matching |
Templates quality factor (TQF) |
35 class X 10 samples, normalized to 45x121 pixel |
MHD |
Success rate is 97.14 % |
|
Xie and Kumar [41] |
Deep learning, light convolutional neural network (LCNN) |
LCNN with triplet similarity loss, supervised discrete hashing (SDH) with LCNN |
105 different subject, index&middle finger
|
CNN |
Triplet loss based LCNN and SDH: EER= 0.0977 |
|
Our study |
Perona-Malik filtering, niblack segmentation |
Fourier descriptor and HVTP |
64 class X 15 samples. Total=960 images. Sizes of samples are 170x80 pixel |
KNN |
Success rate KNN = 99,2% |
In this study, in order to see the effects of the proposed HTP and VTP features on the classification performance, the classification process was re-performed by using HTP and VTP features together with the Generic Fourier Descriptors. As shown in Table 2, in this experimental study, the classification performance of all classifiers increased when HTP and VTP were used. For SVM and KNN classifiers, the success achieved by 5-fold cross validation is superior to 3-fold cross validation, but not by Complex Tree and Ensemble classifiers. The highest classification performance was obtained by using the KNN classifier. According to the results in Table 2, for both k values in k-fold cross validation technique, it was observed that HVTP features significantly increased the classification performance of Complex Tree and Ensemble classifiers.
Considering all experimental studies, the highest classification performance was obtained by the KNN classifier when Generic Fourier Descriptor and HVTP features were used together.
Comparison of training time and prediction speed for classifiers is shown in Table 3. Since the number of features has increased when HVTP attributes are added, the increase in training time and the decrease in prediction speed is quite normal. The decrease in prediction speed is due to the increase in test time, which increases in parallel with the increase in training time. Considering the increase in the success rate, it is seen that the increase in time is acceptable level as shown in Table 3. Among the classifiers used in this study, the KNN classifier gave the best results in terms of both time advantage and success rate.
Different datasets generally have been used in the studies in the literature. In these studies, features, classifiers, the number of samples and the number of classes are vary. Table 4 gives information about the studies performed in the literature and shows the results obtained [26-28, 39-41]. At the same time, the results obtained in our study were compared with the studies in the literature. The proposed method was found to produce acceptable results.
Biometric recognition systems based on FV images have been widely used in recent years. FV images are obtained using near infrared sensitive CCD cameras. But the captured finger-vein images are usually poor in quality. In this study, a preprocessing method based on Perona-Malik Anisotropic Diffusion Filter and Homomorphic Filter was proposed to improve the image quality of FV images. In addition, two new features called HTP and VTP were obtained to improve the classification performance of FV images. Experimental results demonstrated that the proposed new features and method was highly improving finger-vein classification accuracy.
[1] Fang, Y.X., Wu, Q.X., Kang, W.X. (2018). A novel finger vein verification system based on two-stream convolutional network learning. Neurocomputing, 290: 100-107. http://dx.doi.org/10.1016/j.neucom.2018.02.042
[2] Jain, A.K., Nandakumar, K., Ross, A. (2016). 50 years of biometric research: Accomplishments, challenges, and opportunities. Pattern Recognition Letters, 79: 80-105. http://dx.doi.org/10.1016/j.patrec.2015.12.013
[3] von Graevenitz, G.A. (2007). Biometric authentication in relation to payment systems and ATMs. Datenschutz und Datensicherheit-DuD, 31(9): 681-683. http://dx.doi.org/10.1007/s11623-007-0223-9
[4] Yang, J.F., Wei, J.Z., Shi, Y.H. (2019). Accurate ROI localization and hierarchical hyper-sphere model for finger-vein recognition. Neurocomputing, 328: 171-181. http://dx.doi.org/10.1016/j.neucom.2018.02.098
[5] Watanabe, M. (2008). Palm Vein Authentication (N. K. Ratha, V. Govindaraju Eds.). Springer London, London, 75-88. http://dx.doi.org/10.1007/978-1-84628-921-7_5
[6] Luo, H., Yu, F.X., Pan, J.S., Chu, S.C., Tsai, P.W. (2010). A survey of vein recognition techniques. Information Technology Journal, 9(6): 1142-1149. http://dx.doi.org/10.3923/itj.2010.1142.1149
[7] Kumar, A., Zhou, Y. (2012). Human identification using finger images. IEEE Trans Image Process, 21(4): 2228-2244. http://dx.doi.org/10.1109/TIP.2011.2171697
[8] Yang, J., Zhang, B., Shi, Y. (2012). Scattering removal for finger-vein image restoration. Sensors (Basel), 12(3): 3627-3640. http://dx.doi.org/10.3390/s120303627
[9] You, W.H., Zhou, W.K., Huang, J., Yang, F., Liu, Y.Q., Chen, Z.Y. (2019). A bilayer image restoration for finger vein recognition. Neurocomputing, 348: 54-65. http://dx.doi.org/10.1016/j.neucom.2018.06.085
[10] Wen, X.B., Zhao, J.W., Liang, X.Z. (2008). Image Enhancement of Finger-vein Patterns Based on Wavelet Denoising and Histogram Template Equalization. Journal of Jilin University Science Edition, 46(2): 291-292.
[11] Fu, B., Cui, J., Xiong, X. (2010). A novel adaptive vein image contrast enhancement method based on fuzzy and Retinex theory. Paper presented at the 2010 IEEE International Conference on Information and Automation, Harbin, China, pp. 2447-2450. http://dx.doi.org/10.1109/ICINFA.2010.5512278
[12] Pi, W., Shin, J., Park, D. (2010). An effective quality improvement approach for low quality finger vein image. Paper presented at the 2010 International Conference on Electronics and Information Engineering, V1-424-V421-427. http://dx.doi.org/10.1109/ICEIE.2010.5559667
[13] Gao, X.Y., Ma, J.S., Wu, J.J. (2010). The research of finger-vein image enhancement algorithm. Optical Instruments, 32: 29-32.
[14] Oh, J., Hwang, H. (2010). Feature enhancement of medical images using morphology-based homomorphic filter and differential evolution algorithm. International Journal of Control, Automation and Systems, 8(4): 857-861. http://dx.doi.org/10.1007/s12555-010-0418-y
[15] Lee, E.C., Jung, H., Kim, D. (2011). New Finger Biometric Method Using Near Infrared Imaging. Sensors, 11(3): 2319. http://dx.doi.org/10.3390/s110302319
[16] Rosdi, B.A., Shing, C.W., Suandi, S.A. (2011). Finger vein recognition using local line binary pattern. Sensors, 11(12): 11357. http://dx.doi.org/10.3390/s111211357
[17] Yang, J., Shi, Y. (2013). Finger-vein network enhancement and segmentation. Pattern Analysis and Applications, 17(4): 783-797. http://dx.doi.org/10.1007/s10044-013-0325-y
[18] Shin, K., Park, Y., Nguyen, D., Park, K. (2014). Finger-vein image enhancement using a fuzzy-based fusion method with Gabor and Retinex filtering. Sensors, 14(2): 3095. http://dx.doi.org/10.3390/s140203095
[19] Yang, J., Yang, J. (2009). Multi-Channel Gabor Filter Design for Finger-Vein Image Enhancement. Paper presented at the 2009 Fifth International Conference on Image and Graphics, Xi'an, Shanxi, China, pp. 87-91. http://dx.doi.org/10.1109/ICIG.2009.170
[20] Yang, J., Yang, J., Shi, Y. (2009). Combination of Gabor wavelets and circular Gabor filter for finger-vein extraction. Emerging Intelligent Computing Technology and Applications, 5754: 346-354. http://dx.doi.org/10.1007/978-3-642-04070-2_39
[21] Yang, J., Yan, M. (2010, 24-28 Oct. 2010). An improved method for finger-vein image enhancement. Paper presented at the IEEE 10th International Conference on Signal Processing Proceedings, Beijing, China, pp. 1706-1709. http://dx.doi.org/10.1109/ICOSP.2010.5656832
[22] Ma, H., Zhang, S.Y. (2019). Contactless finger-vein verification based on oriented elements feature. Infrared Physics & Technology, 97: 149-155. https://doi.org/10.1016/j.infrared.2018.12.021
[23] JosephP, R.B., Ezhilmaran, D. (2018). A smart computing algorithm for finger vein matching with affine invariant features using fuzzy image retrieval. Procedia Computer Science, 125: 172-178. https://doi.org/10.1016/j.procs.2017.12.024
[24] Yang, J., Shi, Y., Jia, G. (2017). Finger-vein image matching based on adaptive curve transformation. Pattern Recognition, 66: 34-43. http://dx.doi.org/10.1016/j.patcog.2017.01.008
[25] Matsuda, Y., Miura, N., Nagasaka, A., Kiyomizu, H., Miyatake, T. (2016). Finger-vein authentication based on deformation-tolerant feature-point matching. Machine Vision and Applications, 27(2): 237-250. http://dx.doi.org/10.1007/s00138-015-0745-3
[26] Guan, F., Wang, K., Mo, H., Ma, H., Liu, J. (2009, 17-19 Oct. 2009). Research of Finger Vein Recognition Based on Fusion of Wavelet Moment and Horizontal and Vertical 2DPCA. Paper presented at the 2009 2nd International Congress on Image and Signal Processing, Tianjin, China, pp. 1-5. http://dx.doi.org/10.1109/CISP.2009.5304241
[27] Wang, K., Ma, H., Popoola, O. P., Liu, J. (2011). Finger vein recognition (J. Yang Ed.). InTech, 29-53. http://dx.doi.org/10.5772/18025
[28] Yang, J., Li, X. (2010). Efficient Finger Vein Localization and Recognition. Paper presented at the 2010 20th International Conference on Pattern Recognition, pp. 1148-1151. http://dx.doi.org/10.1109/ICPR.2010.287
[29] Song, W., Kim, T., Kim, H.C., Choi, J.H., Kong, H.J., Lee, S.R. (2011). A finger-vein verification system using mean curvature. Pattern Recognition Letters, 32(11): 1541-1547. http://dx.doi.org/10.1016/j.patrec.2011.04.021
[30] Yang, J.F., Zhang, X. (2012). Feature-level fusion of fingerprint and finger-vein for personal identification. Pattern Recognition Letters, 33(5): 623-628. http://dx.doi.org/10.1016/j.patrec.2011.11.002
[31] Al-amri, S.S., Kalyankar, N., Khamitkar, S. (2010). Linear and non-linear contrast enhancement image. International Journal of Computer Science and Network Security, 10(2): 139-143.
[32] Flynn, G.L., Yalkowsky, S.H., Roseman, T.J. (1974). Mass transport phenomena and models: theoretical concepts. Journal of Pharmaceutical Sciences, 63(4): 479-510. http://dx.doi.org/10.1002/jps.2600630403
[33] Weickert, J. (1998). Anisotropic diffusion in image processing. Teubner, Stuttgart, 1: 15-20.
[34] Perona, P., Malik, J. (1990). Scale-space and edge detection using anisotropic diffusion. IEEE Transactions on Pattern Analysis and Machine Intelligence, 12(7): 629-639. http://dx.doi.org/10.1109/34.56205
[35] You, Y.L., Xu, W., Tannenbaum, A., Kaveh, M. (1996). Behavioral analysis of anisotropic diffusion in image processing. IEEE Trans Image Process, 5(11): 1539-1553. http://dx.doi.org/10.1109/83.541424
[36] Niblack, W. (1986). An Introduction to Digital Image Processing. Prentice Hall.
[37] Seliya, N., Khoshgoftaar, T.M., Hulse, J.V. (2009). A Study on the Relationships of Classifier Performance Metrics. Paper presented at the 2009 21st IEEE International Conference on Tools with Artificial Intelligence, pp. 59-66. http://dx.doi.org/10.1109/ICTAI.2009.25
[38] Zhang, D.S., Lu, G.J. (2002). Shape-based image retrieval using generic Fourier descriptor. Signal Processing-Image Communication, 17(10): 825-848. http://dx.doi.org/10.1016/S0923-5965(02)00084-X
[39] Wu, J.D., Ye, S.H. (2009). Driver identification using finger-vein patterns with Radon transform and neural network. Expert Systems with Applications, 36(3): 5793-5799. http://dx.doi.org/10.1016/j.eswa.2008.07.042
[40] Zou, H., Zhang, B., Tao, Z.G., Wang, X.P. (2016). A Finger Vein Identification Method Based on Template Matching. Journal of Physics: Conference Series, 680(1): 012001. http://dx.doi.org/10.1088/1742-6596/680/1/012001
[41] Xie, C.H., Kumar, A. (2019). Finger vein identification using Convolutional Neural Network and supervised discrete hashing. Pattern Recognition Letters, 119: 148-156. http://dx.doi.org/10.1016/j.patrec.2017.12.001