Yunbo Li
© 2020 IIETA. This article is published by IIETA and is licensed under the CC BY 4.0 license (http://creativecommons.org/licenses/by/4.0/).
OPEN ACCESS
The concealed water bodies are potential sources of disasters in underground coalmines. However, it is difficult to detect these water bodies in an accurate manner. To overcome the difficulty, this paper designs a high-power imaging system for transient electromagnetic method (TEM) in coalmines. Specifically, the shutdown period of emission current was reduced to 12µs with high-current reverse clamp inductance technology; the secondary field signals were collected and the background noise was reduced to 1µV through equivalent sampling, segmented amplification, and superimposed denoising; the least squares imaging and attitude angle was fused for the first time to realize the rapid imaging of the disaster-causing concealed water bodies in front of the heading face in underground coalmines. The proposed system was applied to detect and continuously track the water-rich worked-out sections on the same layer and on the roof, as well as the water in collapse columns in the excavation direction and in the heading face. The results show that our system can accurately detect 74.1% of disaster-causing concealed water bodies. This research provides new insights into the prevention and control of water disasters in underground coalmines.
underground coal mine, high power, transient electromagnetic method (TEM), dynamic imaging
Coal is one of the basic energy sources of China, taking up over 60% of China’s energy structure. In coalmines, water disasters are the second leading cause of major accidents. These disasters are mainly induced by water sources like the water in fault-fracture zones, the water in collapse columns, the water in worked-out sections, Ordovician limestone water, karst water, separation water of roof and floor, and surface water. Statistics show that most water disasters occur during roadway construction. In most cases, the mine fails to fully recognize the hidden aquifer behind the heading face.
Transient electromagnetic method (TEM) provides an effective tool to detect water disasters. This method has been widely studied and practiced at home and abroad, yielding fruitful results. The former Soviet Union was the first to apply the TEM to solve geological problems [1]. Based on the theory of A.N. Tikhonov in the 1940s, the far-field sounding method has been adopted to investigate the geological problems of oil and gas fields. In the 1950s, V.A. Sidorov, V.V. Tikshaev et al. proposed the near-field sounding method.
Meanwhile, the near-field sounding method was also developed and tested by American and European scholars. Since the 1970s, the US and western Europe began to explore extensively into near-field sounding. For example, A.A. Kaufmann, J.R. Wait, G.V. Keller et al. probed deep into the 1D forward inversion of near-field sounding [2-5]. The Frequency and Transient Soundings, authored by A.A. Kaufman et al. has become a classic in the field of electromagnetic soundings.
Since the 1980s, both computer technology and information technology have developed rapidly. Many scholars, namely, San Filippo, P. Weidelt, A.P. Raiche, J.H. Knight, B.R. Spies, W. Hohmann, and T.J. Lee, have achieved lots of results in the forward and backward inversions and time-depth conversion of the TEM [6-11].
China is a late starter in the TEM research. At the end of the 1990s, Yu Jingcun introduced the TEM to the survey of underground coalmines in China, laying the basis for the selection of methods and devices as well as the data processing and interpretation. Moreover, Yue Jianhua, Xue Guoqiang, Wang Huajun, Yan Shu, Liu Zhixin, Guo Liquan, Li Wenyao, Xu Hongmiao et al. achieved important results in theoretical simulation, data processing and imaging of the TEM [12-19].
The traditional TEM, focusing on the inside of the heading face and the floor, is a static, half-space detection approach based on the pre-mining natural state of the heading face. With the mining of the heading face, the nearby geo-stress field will exit the equilibrium state. The redistribution of the geo-stress field will cause the roof, floor, and surrounding rock to break and deform.
Despite its extensive application in the detection of water disasters in coalmines, the TEM for coalmines still faces three major defects: the emission current is weak and free to attenuate, resulting in weak secondary field signals; the long shutdown period leads to a large blind area; the combination of underground detection and ground imaging is inefficient and inaccurate, failing to realize rapid imaging underground. This calls for a TEM strategy that supports dynamic directional detection and imaging.
Through the above analysis, this paper designs a high-power imaging system for the TEM in coalmines. The system was developed based on techniques like reverse clamp inductance, equivalent sampling, least squares imaging, to name but a few, and verified through experiments on eight coalmines in China. The research results provide a good reference for the prevention and control of water disasters in underground coalmines.
The TEM for coalmines differs from the ground TEM, which is based on the half-space theory, in terms of detection environment, detection devices, line layout, data processing, and data interpretation.
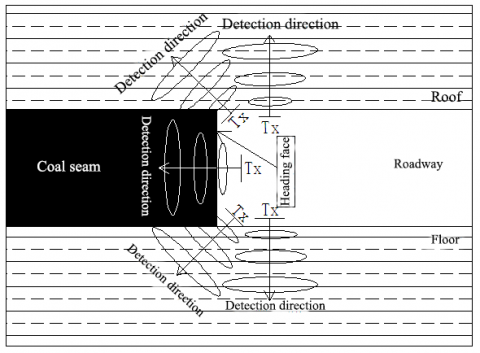
Figure 1. The TEM for coalmines
In coalmines, the TEM’s loops or antennas are usually arranged in an overlapped or staggered manner. Considering this arrangement feature, the detection process of the TEM underground is illustrated in Figure 1. In advanced detection, the normal direction of the plane of transmitting coil and receiving coil is arranged at a certain angle (e.g. 90°) relative to the heading face. In roof or floor detection, the direction of the center normal of the wire frame is arranged at a certain angle (≤90°) relative to the roof or floor of the roadway.
The detection process of TEM in coalmines can be divided into three stages: transmitting electromagnetic pulse (current), inducting electromagnetic field signals, and receiving secondary field signals.
During the detection, the transmitter emits a bipolar pulse current (excitation source). Once the emission current drops from high level to zero, i.e. the falling or rising edge of the emission pulse current arrives, a primary magnetic field will be generated in the air or surrounding rock near the transmitting coil. The primary magnetic field will propagate to the stratum in front. During the propagation, an induced current (eddy current) will emerge inside any good conductor, under the effect of the induced magnetic field. With the elapse of time, the eddy current will gradually attenuate. The attenuation will excite a secondary magnetic field, whose signals will propagate to the receiving antenna. The signals of the secondary magnetic field will be collected by the data acquisition system, and inversed to obtain the information (e.g. apparent resistivity and shape distribution) of the coal rock layer.
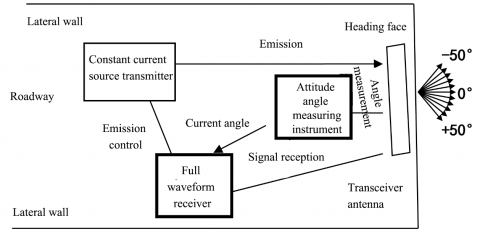
Figure 2. Our high-power imaging system for TEM in coalmines
As shown in Figure 2, our high-power imaging system for TEM in coalmines consists of a constant current source transmitter, an attitude angle measuring instrument, a full waveform receiver, and a transceiver antenna.
The constant current source transmitter is a high-power explosion-proof transmitter, capable of transmitting a constant 50A current and achieving fast shutdown. The attitude angle measuring instrument measures the angle of the transceiver antenna in real time, and transmits it wirelessly to the full-waveform receiver. The full waveform receiver sends transmit control commands to the constant current source transmitter, collects the real-time data from the transceiver antenna, and quickly images the collected data plus the antenna data.
3.1 High-current rapid shutdown
Under the inductive effect, the transmitting coil will emit current continuously until the energy stored in the equivalent inductance is depleted. The hysteresis effect of the equivalent inductance will seriously affect the secondary field. As a result, the secondary field signals received by the transceiver in the early phase are, in essence, the interferences from the superimposed current from the primary field. The interferences often have a large amplitude, creating a blind area in the received signals. The shutdown period of the transmitting coil must be shortened to reduce the blind area.
Figure 3. Inductance-based reverse shutdown
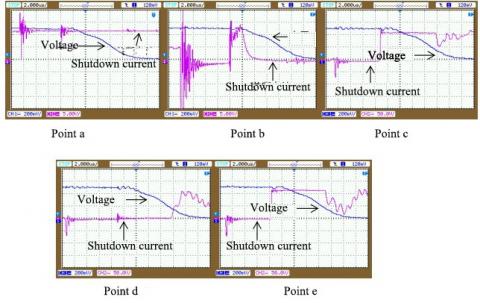
As shown in Figure 3, Q5, D6, and L2 were introduced to reduce the shutdown period. During the shutdown, the curves measured at test points a, b, c, d, and e are presented in Figure 4, where channel 1 shows the voltage waveform at each point, and channel 2 the shutdown waveform of emission current.
During current emission, Q5, Q4, and Q2 are turned on, and the antenna emits the current in the following loop: Battery-Q5-Q4-Antenna-Q2-Battery. When the bridge current is shutdown, reverse voltages V1 and V2 are generated across the inductance L1 of the transmitting antenna and the reverse clamp inductance L2, respectively.
Since L2 > L1, the reverse voltages V2> V1. L1 cannot form a loop through the fly-wheel diode (FWD) to charge the power supply, nor can L2 forward charge L1. Then, D4 is broken down, the voltage at point c is clamped to the drain-source breakdown voltage; D2 is broken down, and the voltage at point e is clamped to the drain-source breakdown voltage.
The fly-wheel loop of the circuit is as follows: antenna-D2-D6-L2-D4-antenna. The voltage across the antenna is clamped to the drain-source breakdown voltage, which is much higher than the power supply voltage. Therefore, the current is quickly shutdown to zero. The shutdown period was measured as 12μs, the same as that of PROTEM, the world’s most advanced transient electromagnetic detector.
Figure 4. The curves measured at different points
3.2 Equivalent sampling low-noise reception
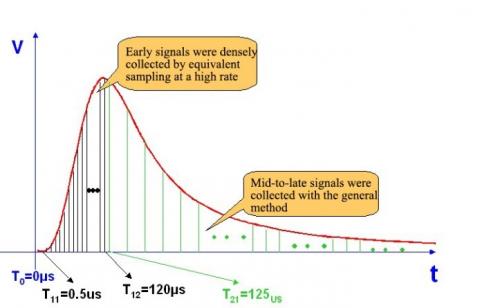
The transient signals of the secondary field attenuate fast and deeply in the early phase. In this phase, the signals attenuate from 10 volts to millivolt or even microvolt level in only tens to hundreds of microseconds. From the middle to late phase, the signals attenuate slowly and insignificantly. During this period, the signals attenuate from millivolt or microvolt level to microvolt or nanovolt level in hundreds of microseconds, several milliseconds, or even a few seconds.
Considering the features of the transient signals, the early signals were collected through ultra-high-speed dense sampling based on equivalent sampling technology. In other words, multiple (256) cycles were designed with an interval of 0.5μs. One point was sampled in each cycle. The ultra-high-speed sampling was realized through the sequential control of equivalent sampling, using an ordinary low-speed analog-to-digital (AD) converter. In this way, the early signals that attenuate rapidly were obtained.
To increase their signal-to-noise ratio (SNR), mid-to-late signals were collected with an ordinary slow-speed AD converter at the rate of 5μs, following the principle of multiple hardware superposition. The sampling strategy of different signals is explained in Figure 5 below.
Figure 5. The equivalent sampling strategy
To ensure detection sensitivity and reduce noises, the following technical measures were adopted to realize the low-noise design of our TEM receiving instrument:
(1) Reasonable design of low-noise preamplifier;
(2) SNR improvement through signal accumulation (n times of accumulation leads to n times of improvement of the SNR);
(3) Bipolar signal sampling and software processing (to eliminate the slowly-changing noises outside the instrument, reduce the impact of the DC offset of the amplifier loop on the measurement, and improve the SNR of the system);
(4) SNR improvement through front-end anti-saturation and segmented amplification;
(5) Shielding and grounding;
(6) Separation of digital ground and analog ground.
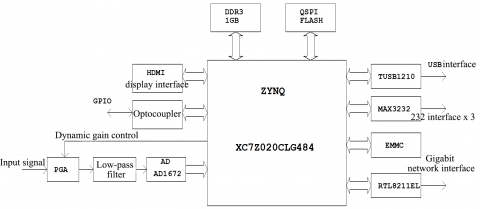
As shown in Figure 6, the TEM signals are first matched by the impedance matching circuit. Then, the noises are suppressed, and the useful signals are amplified by the low-noise preamplifier. The low-pass filter determines the passband of the TEM instrument by changing the external resistance. On the AD front end, a low-noise amplifier, whose gain can be controlled in real time, is designed based on the resistance and reactance of coils. Meanwhile, small signals are amplified effectively by the low-pass filter with a shutdown frequency of 20kHz. During the sampling, the field-programmable gate array (FPGA) obtains the real-time variation in signal level, and switches the gain of the amplifier. In addition, the collected data are divided in real-time to achieve dynamic acquisition and processing in a wide range.
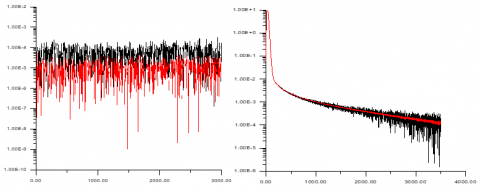
To prevent excessively large early amplitude, the transient signals acquired from the receiving coil were attenuated, then amplified after a period, and finally processed to achieve the anti-saturation function. This segmented amplification technology can reduce the noise level to 1μV (Figure 7).
Figure 6. The block diagram of the TEM receiving instrument
Figure 7. The curve and noise level of the collected signals
3.3 Antenna attitude measurement with three-axis electronic compass
In underground coalmines, the TEM mainly covers up and down scanning, and horizontal scanning. Therefore, a three-axis electronic compass was adopted to measure the pitch angle and azimuth of the antenna in real time.
Let pitch angle θ1 be the angle between the horizontal direction and the antenna normal, the azimuth θ2 be the angle between the gravity direction and the antenna normal, and the horizontal angle be 0°.
In local areas underground, the gravity vector remains unchanged. Hence, θ2 could be derived from the projection size of the acceleration of gravity on the X-Y-Z coordinate system of the accelerometer. Here, θ2 is measured directly by the three-axis electronic compass. Then, θ1 could be calculated based on θ2:
θ1=θ2-90° (1)
In the same period, the geomagnetic field in local areas remains unchanged. Hence, θ2 could be derived from the projection size of the acceleration of gravity on the X-Y-Z coordinate system of the accelerometer. Assuming that θ3 remain unchanged during detection, both θ3 and θ2 are measured directly by the three-axis electronic compass. Then, θ1 could be calculated by:Let θ1 be the horizontal angle between the initial direction and the direction of the transceiver antenna, θ2 be the horizontal angle between the initial direction and the magnetic north, and θ3 be the horizontal angle between the antenna detection direction and the magnetic north. In actual detection, the angle between the initial direction and the left wall is usually negative, and that between the initial direction and the right wall is usually positive.
θ1=θ3-θ2 (2)
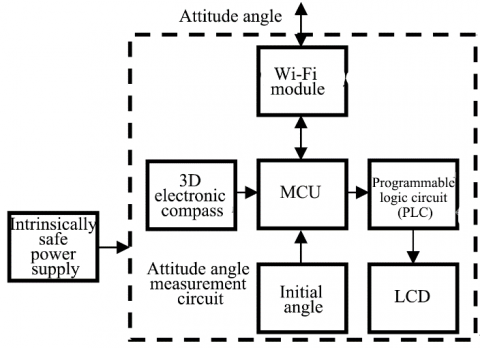
The three-axis electronic compass (including a three-axis gravity accelerometer and a and geomagnetic sensor) was adopted for real-time measurement of the three components of the gravity acceleration of the earth and the geomagnetic field on the antenna coordinate system. As shown in Figure 8, the attitude angle of the antenna was solved by the microcontroller unit (MCU), and sent to the liquid crystal display (LCD) of the instrument for display. By observing the attitude angle, the operator can correct the antenna attitude easily, making data collection accurate and efficient. The attitude angle was also transmitted to the host via Wi-Fi in real time. Based on the current attitude angle, the host computes the apparent resistivity of the current measurement direction in real time.
To verify its detection effects, our high-power rapid imaging system for TEM in coalmines were applied to detect water-rich worked-out sections, the water in collapse columns, and goaf water, with the aid of geological data of coalmines. The detected results were compared with the mining and drilling results.
The experiments were conducted in eight coalmines of Xishan Coal Electricity Group Co., Ltd. The forecast distance of a single detection is ≥100m. A total of 185 forecasts were completed, leading to a cumulative forecast distance of 21,260m. The specific forecast of each coalmine is shown in Table 1.
The detected results of the eight coalmines and the abnormalities found in verification were summed up in Table 2. The 185 detections forecasted a total distance of 21,260m. There were 76 abnormal forecasts, including 48 overestimations, 137 accurate forecasts, and 0 omission. The overall accuracy was 74.1%. The detections have created a total economic value of RMB 150 million yuan.
Figure 8. The measurement of antenna attitude angle
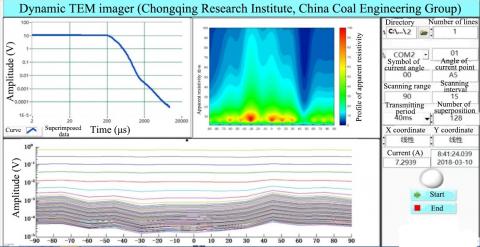
Figure 9. The interface of our system
Table 1. The detected results of each coalmine
|
No. |
Name of coalmine |
Number of forecasts |
Forecasted length/m |
Verified length/m |
Number of verified forecasts |
Number of unverified forecasts |
|
1 |
Guandi |
17 |
1,740 |
1,740 |
17 |
0 |
|
2 |
Ximing |
17 |
1,930 |
1,930 |
17 |
0 |
|
3 |
Duerping |
21 |
2,240 |
2,240 |
21 |
0 |
|
4 |
Malan |
29 |
3,330 |
3,330 |
29 |
0 |
|
5 |
Tunlan |
28 |
2,950 |
2,950 |
28 |
0 |
|
6 |
Zhenchengdi |
33 |
3,380 |
3,380 |
33 |
0 |
|
7 |
Xiqu |
19 |
3,510 |
3,510 |
19 |
0 |
|
8 |
Dongqu |
21 |
2,180 |
2,180 |
21 |
0 |
|
Total |
185 |
21,260 |
21,260 |
185 |
0 |
|
Table 2. The TEM accuracy of our system in target coalmines
|
Total number of forecasts |
Number of abnormal forecasts |
Number of normal forecasts |
Number of accurate forecasts |
Number of overestimations |
Number of omissions |
Accuracy/% |
|
185 |
76 |
109 |
137 |
48 |
0 |
74.1 |
This paper develops the first TEM system that supports dynamic directional detection and imaging in underground coalmines. The reverse clamp inductance was used to control the shutdown period of emission current to 12µs.
The authors also proposed dual-channel acquisition technology of weak electromagnetic signals, and presented the bipolar superposition technology for peak signal detection, thereby collecting secondary field signals and reducing the background noise to 1µV.
The least squares imaging and attitude angle was fused for the first time to realize the rapid imaging of the disaster-causing concealed water bodies in front of the heading face in underground coalmines.
The proposed system was applied to detect and continuously track the water-rich worked-out sections on the same layer and on the roof, as well as the water in collapse columns in the excavation direction and in the heading face. The results show that our system can accurately detect 74.1% of disaster-causing concealed water bodies.
This paper was supported by “Thirteenth Five-Year Plan” the Key National R & D Program (On-line Dynamic Detection Technology and Equipment of Radio Wave Perspective in Mining Face 2018YFC0807805).
[1] Niu, Z.L. (1992). Principle of Time Domain Electromagnetic Method. Changsha: Central South University of Technology Press, 5-30.
[2] Kaufman, A.A., Kelland, G.V. (1987). Electromagnetic Sounding of Frequency Domain and Time Domain. Geology Press, Beijing, 216-222.
[3] Pu, H.R. (1990). Principle of Electromagnetic Sounding. Beijing: Geological Publishing House, 3-32.
[4] Yan, S., Shi, X.X., Chen, M.S. (2009). The probing depth of transient electromagnetic field method. Chinese Journal of Geophysics, 52(6): 1583-1591. https://doi.org/10.3969/j.issn.0001-5733.2009.06.020
[5] Chen, M.S., Tian, X.B. (1999). Study on the transient electromagnetic (TEM) sounding with electric dipole. IV. Apparent resistivity in TEM sounding. Coal Geology & Exploration, 27(4): 52-54. https://doi.org/10.3969/j.issn.1001-1986.1999.04.016
[6] Roy, A., Apparao, A. (1971). Depth of investigation in direct current methods. Geophysics, 36(5): 943-959. https://doi.org/10.1190/1.1440226
[7] Bhattacharya, B.B., Sen, M.K. (1981). Depth of investigation of collinear electrode arrays over homogeneous anisotropic half-space in direct current methods. Geophysics, 46(5): 768-780. https://doi.org/10.1190/1.1441214
[8] Barker, R.D. (1989). Depth of investigation of collinear symmetrical four-electrode arrays. Geophysics, 54(8): 1031-1037.
[9] Oldenburg, D.W., Li, Y. (1999). Estimating depth of investigation in dc resistivity and IP surveys. Geophysics, 64(2): 403-416. https://doi.org/10.1190/1.1444545
[10] Stoll, J.B., Bahr, K. (2000). Optimization of signal-to-noise ratio in dc soundings. Geophysics, 65(5): 1495-1500. https://doi.org/10.1190/1.1444838
[11] Spies, B.R. (1989). Depth of investigation in electromagnetic sounding methods. Geophysics, 54(7): 872-888. https://doi.org/10.1190/1.1442716
[12] Li, W.Y., Yan, C.W., Zou, Z.W., Wang, R.H. (2012). Research process for transient electromagnetic apparatus. Journal of Yunnan University, 34(S2): 233-241.
[13] Xue, G.Q., Yu, J.C. (2017). New development of TEM research and application in coal mine exploration. Progress in Geophysics, 32(1): 319-326. https://doi.org/10.6038/pg20170145
[14] Xu, H.M., Hu, J.J., Peng, Q.Y., Zhu, Z.X., Duan, C.L., Wang, P. (2017). The application of TEM method to foundation investigation in karst region. Chinese Journal of Engineering Geophysics, 14(2): 206-210. https://doi.org/10.3969/j.issn.1672-7940.2017.02.014
[15] Wang, H.J., Luo, Y.Z. (2003). Algorithm of a 2.5 dimensional finite element method for transient electromagnetic with a central loop. Chinese Journal of Geophysics, 46(6): 855-862. https://doi.org/10.3321/j.issn:0001-5733.2003.06.020
[16] Yue, J.H., Yang, H.Y., Deng, J.Z. (2012). Whole-space effect on underground transient electromagnetic field in layered media. Progress in Geophysics, 27(4): 1385-1392. https://doi.org/10.6038/j.issn.1004-2903.2012.04.012
[17] Liu, Z.X., Yue, J.H., Liu, Y.G. (2007). Application of sector detection technology in advanced detection. Journal of China University of Mining & Technology, 36(6): 822-825, 868. https://doi.org/10.3321/j.issn:1000-1964.2007.06.021
[18] Yan, S. (2004). Simulation of thin layer and thin wire in FDTD calculation of underground full space transient electromagnetic method. China Geological Society. Current Situation of Coal Resources, Progress of Exploration, Development and Utilization Technology and Environmental Protection in China. Chinese Geological Society.
[19] Guo, L.Q., Liu, S.D. (2008). Realization of kriging algorithm and applied analysis to spatial interpolation of geophyrsics data. Coal Technology, 27(5): 5-7.