Sahrul Saehana*![]() | Darsikin Siswomiharjo
| Darsikin Siswomiharjo![]() | Annisa Aprilia
| Annisa Aprilia![]()
© 2025 The authors. This article is published by IIETA and is licensed under the CC BY 4.0 license (http://creativecommons.org/licenses/by/4.0/).
OPEN ACCESS
This study aims to determine experimental parameters in the manufacture of FTO by the spray pyrolysis method. A solution containing Tin (II) Chloride and Ammonium Fluoride with 96% alcohol solvent was sprayed using the Omron NE-C28 Nebulizer for 20 minutes on a glass substrate on a hotplate at a temperature of 450℃ then transparent conductive SnO2:F particles have been formed. It was found that concentration, distance between nozzle and collector, heating temperature, and deposition time have a significant effect. The greater concentration, the greater ratio of Sn and F content; and optimum value was obtained at a concentration of 0.7 M. The ideal nozzle-collector distance was obtained at a distance of 11.0 cm because the particles were denser and fewer cavities were formed so that layer resistance was small. Heating at 450℃ produced the smallest crystallite size (700 nm) and resistance (40 W/cm2). The length of deposition time also affected the resistance and transmittance of layer. The ideal deposition time was 40 minutes to produce a resistance of 15 W/cm2 and a transmittance of 80%. The application of resulting FTO as an electrode on DSSC also showed a photovoltaic effect and was able to produce a maximum efficiency of 2.01%.
FTO, spray pyrolysis, concentration, temperature, nozzle-collector, deposition time, SnO2:F, solar cells
Conductive transparent glass has unique characteristics because it is translucent and has one side that can conduct electricity (conductive) [1]. The existence of this uniqueness makes an enormous need for this type of glass, both research and industry and therefore research on the development of this thin layer needs to be carried out. Transparent Conducting Oxide (TCO) commonly used is Indium-doped Tin Oxide (ITO) [2], Antimony-doped Tin Oxide (ATO) [3], and Fluorine-doped Tin Oxide (FTO) [4]. The process of making TCO in the form of ITO requires expensive costs because the metal elements are scarce so it is difficult to obtain [5]. Another chemical element whose availability is abundant in nature is Fluorine (F), the manufacturing process requires a relatively cheaper cost [6, 7]. Fluorine is a prime candidate that has great potential to replace indium in TCO production. Currently one of the materials that dominate the TCO market is Fluorine-doped Tin Oxide (FTO).
FTO has several advantages: it is more chemically resistant, cheap, and easily available. In addition, FTO is also able to glue to glass more strongly, as well as has higher optical transparency, and shows electrically conductive properties that are relatively more resistant to heating treatment compared to ITO. FTO is cheaper because it uses materials whose raw materials are easier to obtain. Considering the same quality when compared to other TCOs, this is what makes FTO more widely used as an electrode in Dye-Sensitized Solar Cell applications [7].
FTO is one type of TCO glass that has prospects for development because it can be made with simple equipment and can produce low resistance. F-doped SnO2 can be produced by sol–gel [8-11], chemical vapor deposition [12], and spray pyrolysis methods [13]. Spray pyrolysis is one method to produce FTO glass by spraying within a certain period [14]. In previous studies, we have successfully designed a reactor and produced FTO using the spray pyrolysis method and conducted initial investigations on several experimental parameters such as solution molarity, nozzle-collector distance, heating temperature and deposition time [13, 15, 16]. The novelty in this research is the investigation of a number of parameters in more detail based on a number of relevant characterization results. In addition, this article also reports the relationship between several parameters based on calculations and measurements. This article also reports the application of the resulting FTO layer as an electrode in DSSCs and the effect of morphology on device performance.
The purpose of this study is to conduct a deeper investigation on a number of parameters in the FTO fabrication experiment using the spray pyrolysis method, namely concentration, nozzle distance to the collector, deposition time and heating temperature. To obtain the most optimum FTO performance, the best parameters of each parameter are used. Furthermore, the resulting FTO is applied as an electrode on the DSSC and IV characteristics are measured.
2.1 TCOs
TCOs are fascinating materials that combine optical transparency with electrical conductivity. These properties make them essential in various applications, such as touchscreens, solar cells, flat-panel displays, and smart windows [13, 15, 16]. TCOs are typically composed of doped metal oxides, with common examples including Indium Tin Oxide (ITO), Zinc Oxide (ZnO), and Tin Oxide (SnO2). Each material has unique properties tailored to specific uses. For instance, ITO is widely used for its excellent conductivity and transparency, while ZnO and SnO2 are cost-effective alternatives.
These materials are crucial for devices requiring visibility and electrical functionality, and their development continues to evolve with advancements in technology. Transparent Conducting Oxides (TCOs) are typically produced using advanced thin-film deposition techniques. Here are some common methods [17]:
- Sputtering: This process is done by bombarding the target material with high-energy particles, causing atoms to be released and deposited as a thin layer on the substrate. This process is widely used to create uniform layers.
- Chemical Vapor Deposition (CVD): In this process, a gas precursor reacts chemically on the surface of a substrate and then forms a thin layer. This process is ideal for large-scale production because it can control the properties of the layer.
- Pulsed Laser Deposition (PLD): A high-energy laser is used to vaporize the target material which is then deposited onto a substrate. This method is quite accurate but is less commonly used in industrial applications.
- Sol-Gel Process: A chemical solution in the form of a sol is placed on a substrate and then heated to form a thin layer in solid form. This method is quite cost-effective but in terms of quality it is not as good as the results of other techniques.
- Spray Pyrolysis is a technique for making nanometer-sized thin films through atomization of precursor solutions by spraying onto high-temperature substrates. This approach is relatively more cost-effective when compared to other deposition methods.
2.2 FTO
FTO is one type of TCO that is widely used in optoelectronic applications due to its excellent electrical conductivity and optical transparency. FTO is ideal for devices such as solar cells, touch screens, and smart windows [18]. FTO can be produced by spray pyrolysis, sputtering, or chemical vapor deposition methods. This is because these techniques allow precise control over the film thickness and properties. FTO is often chosen as a cost-effective alternative to Indium Tin Oxide (ITO), especially in applications where high thermal stability is required [19].
2.3 Spray pyrolysis
Spray pyrolysis is a simple and cost-effective technique for producing TCOs such as FTO and ITO [15, 16]. In the FTO production process, the precursor solution with the desired material is changed into a fine droplet form and then sprayed onto a heated substrate. The heat causes the droplets to undergo pyrolysis to form a thin layer [20]. The advantages: Simple setup and operation, suitable for large-scale production; Allows easy doping by adding elements to the spray solution; Operates in ambient air, eliminating the need for vacuum conditions [21, 22]. Spray pyrolysis is widely used to produce optoelectronic devices utilized in solar cell devices, photodetectors, and displays because it has the ability to produce films with transparent properties and high conductivity values [23-27].
SnCl2.2H2O, NH4F, and 96% Ethanol (Merck, Germany) are the materials used for the manufacture of FTO glass. SnCl2 and NH4F, each about 1 gram, were added into 96% ethanol solvent and stirred until homogeneous [4]. The OMRON NE-C28 nebulizer was used to break the liquid drug into small droplets that could be inhaled on a glass substrate with a scale of about 1 cm×1 cm wide and 2 mm thick. This spray pyrolysis method was used to precipitate the solution on the glass [13, 15, 16].
The influence of experimental parameters, namely concentration, nozzle distance to collector, heating temperature and deposition time were investigated by repeating the experiment several times [26, 27]. The variation of solution concentration used was 0.3 M; 0.5 and 0.7 M so that the effect of concentration could be known. Likewise, the nozzle and collector distances of 11 cm, 16 cm and 26 cm were set in this study. The sample heating temperature was also carried out in three conditions, namely 450℃; 475℃ and 500℃ respectively. Deposition for 20 minutes, 30 minutes and 40 minutes was also carried out to obtain information on the effect of time in this study.
The resistance of the FTO layer was measured by the four-point probe method using a digital multitester (PROHEX). Furthermore, the transmittance of the sheet was determined by measuring the UV-Visible spectrophotometer 8452 (Agilent). The surface morphology and compound content were revealed through observation with SEM and EDS (FEI Inspect-S50). The diffraction peaks of the formed material were investigated by XRD equipment (PANalytical X'Pert PRO).
4.1 Solution concentration
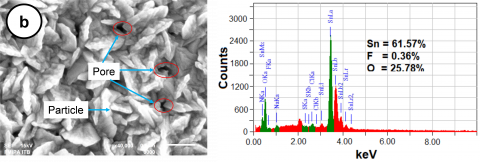
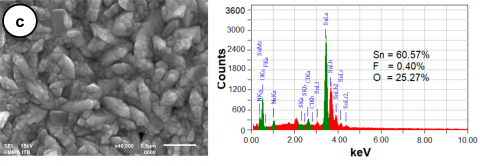
The concentration of the solution that determines the composition of the constituent atoms is very important in obtaining the best FTO performance [18]. To determine the effect of this parameter on FTO morphology, various concentrations were investigated and then characterized by SEM and EDX. Figure 1 shows a comparison of FTO at three different concentrations. Figure 1(a) shows that at a concentration of 0.3 M, there are quite a lot of pores in the film formed then the composition of Sn is 63.12%; F by 0.27% and 25.85%, respectively. The ratio of [F]/[Sn] is 0.003 and the measured layer resistance with a four-point probe is 631 W/cm2, as shown in Table 1. At a concentration of 0.5 M, as shown in Figure 1(b), the particles are flattened with sufficient particle density. This is in line with the [F]/[Sn] ratio of 0.006 and the measured decrease in layer resistance with a four-point probe of 181 W/cm2. Furthermore, an increase in concentration by 0.7 M, oval-shaped particles and a ratio of [F]/[Sn] by 0.007, and a decrease in layer resistance measured by four-point probes of 56 W/cm2. The results obtained in this study are still below the performance of commercial FTO with a [F]/[Sn] ratio of 0.05 and a layer resistance of 10 W/cm2 [14].
Table 1 shows a comparison of the ratio between FTO made with varying concentrations and commercial FTO. It appears that the ratio between [F]/[Sn] needs to be increased for layer resistance to be close to optimal.
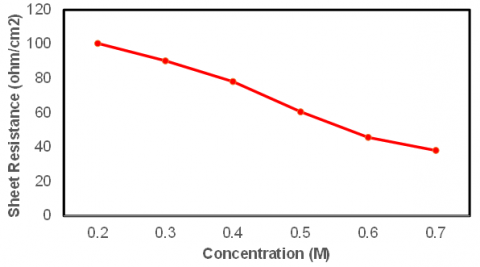
Furthermore, FTO resistance is measured for some concentration of the solution used in the fabrication process. Figure 2 shows the relationship between solution concentration and layer resistance. The magnitude of the resistance of the layer decreases as the concentration of the solution increases. The lowest resistance is obtained at a concentration of 0.7 M as shown in Figure 2.
(a) 0.3 M [13]
(b) 0.5 M [15]
(c) 0.7 M [26]
Figure 1. SEM and EDS results for FTO produced by spray methods in varying concentrations
Table 1. Comparison between the composition of FTO films synthesized through concentration variations with commercial products
|
Sample |
Element Composition of FTO (%) |
[F]/[Sn] |
Resistance (W/cm2) |
||
|
Sn |
O |
F |
|||
|
FTO (0.3 M) |
63.12 |
25.85 |
0.27 |
0.003 |
631.00 |
|
FTO (0.5 M) |
61.57 |
25.78 |
0.36 |
0.006 |
181.00 |
|
FTO (0.7 M) |
60.57 |
25.27 |
0.40 |
0.007 |
56.00 |
|
Commercial FTO |
78.63 |
17.26 |
4.10 |
0.050 |
10.00 |
Figure 2. The relationship between concentration and resistance
4.2 Nozzle-collector distance
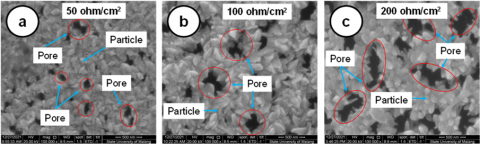
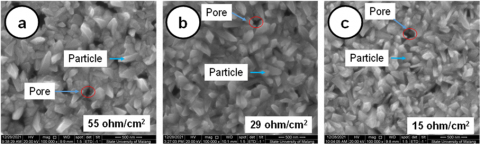
Morphological characterization has been carried out on several experimental parameters namely nozzle-collector distance, heating temperature, and deposition time. Overall surface morphology of the FTO layer shows good results with a homogeneous layer (evenly distributed along the substrate). On the other hand, characterization with EDS is carried out by varying the molarity of the solution.
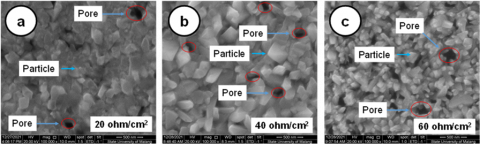
From Figure 3, it is known that distance affects the morphology of the resulting film. The greater the distance, the larger the space between particles (pores) of this film. The presence of a large (dominant) particle space causes the resistance of a large and inhomogeneous film.
Figure 3. SEM FTO results produced by spray method with distance variations: (a) 11 cm; (b) 16 cm; (c) 26 cm [26]
In Figure 3(a) with a distance of 11 cm, it can be seen that the constituent particles are denser, which means that more solution is depositioned, and the grain or cavity boundary looks smaller and denser. This affects the resistance result of 50 W/cm2 and is relatively smaller when compared to the results of deposition with a wider distance. Furthermore, at a distance of 16 cm (Figure 3(b)), there are fewer grain borders. In Figure 3(c), which is a distance of 26 cm, there are more grain or cavity boundaries. The distance between the nozzle and collector when deposition affects the size of the space between the particles formed. The larger the space between particles causes the FTO resistance to be greater because the contact between particles does not work properly [28].
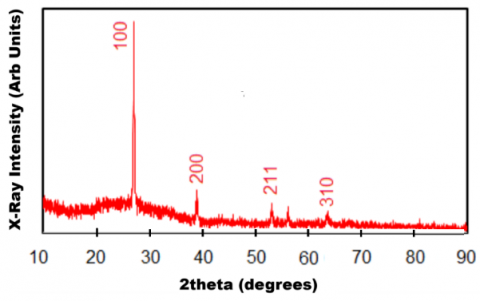
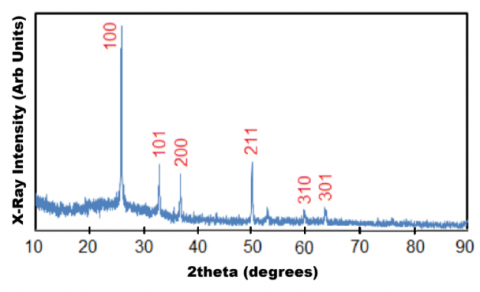
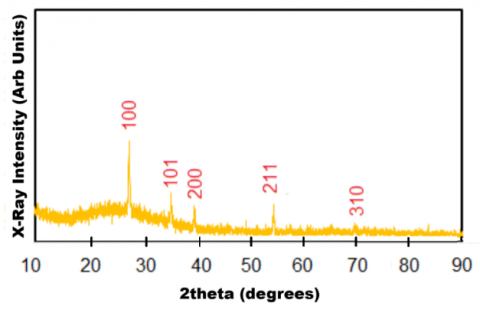
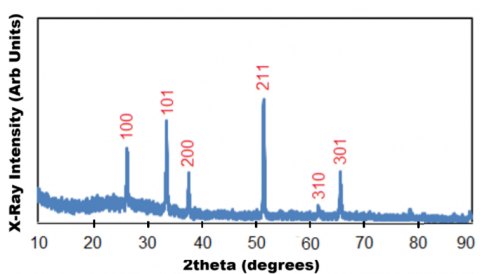
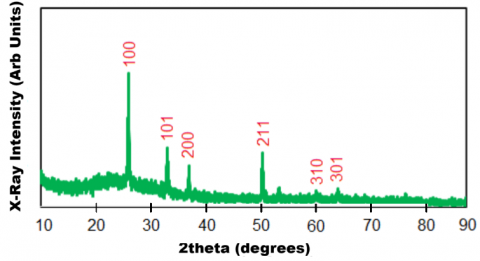
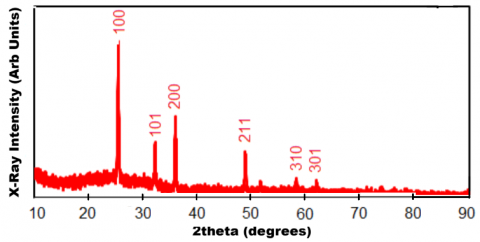
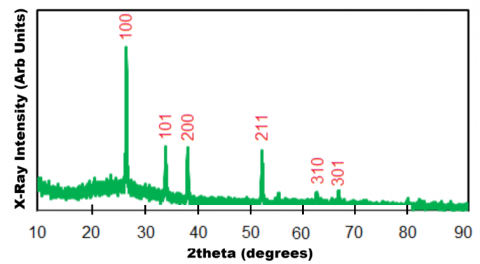
To determine the crystals formed through the spray pyrolysis process, an investigation was carried out using XRD as shown in Figure 4. The diffraction peaks of fluorine doped tin oxide (SnO2:F) can be identified through JPCDS data located at 26.51°; 33.81°; 38.09°; 51.67°; 55°; 61.73° and 65.81°. Thus, through this experiment, it was discovered that SnO2:F crystals had been produced. Figure 4(a) shows that SnO2:F crystals were identified at deposition within 11 cm through diffraction peaks at 26.51° (100); 38.09° (200); 51.67° (211); and 61.73° (310). In deposition at a distance of 16 cm, Figure 4(b), it is known that SnO2: F crystals were identified through peaks 26.51° (100); 33.81° (101); 38.09° (200); 51.67° (211); 61.73° (310); and 65.81° (301). At a distance of 26 cm, Figure 4(c) there is a reduction in intensity from the peak of 26.51° when compared to the previous two distances. SnO2:F crystals were identified through peaks 26.51 (100); 33.81 (101); 38.09 (200); 51.67 (211); and 61.73 (310). Testing with XRD shows the formation of FTO structure according to Eq. (1) [19].
SnCl2.2H2O + NH4F → SnO2:F (1)
SnO2:F particles were identified based on the peaks formed in the XRD characterization. Furthermore, the crystallite size (D) formed was estimated using the Debye Scherrer equation according to the main peaks of the diffractogram pattern. The crystal form factor (K) of 0.9 and the X-ray wavelength (l) of 1.54056 Å were used. The FWHM (b) and diffraction angle (θ) were also taken into account in using this equation [20]:
$\mathrm{D}=\mathrm{K} \lambda /(\beta \cos \theta)$ (2)
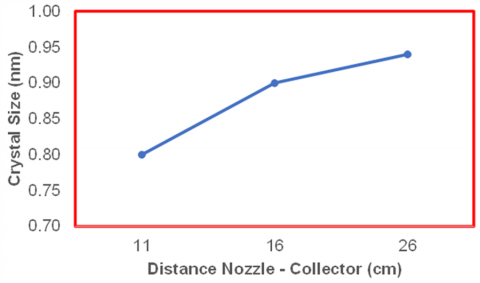
The crystallite size of SnO2:F in the order of nanometers (about 0.8 to 0.9 nm) as shown in Figure 5 was estimated using Eq. (2). It is known that the crystallite size changes according to the nozzle-collector distance. The larger the distance, the larger the particle size.
(a) 11 CM
(b) 16 cm
(c) 26 cm
Figure 4. XRD FTO results produced by spray method with distance variations
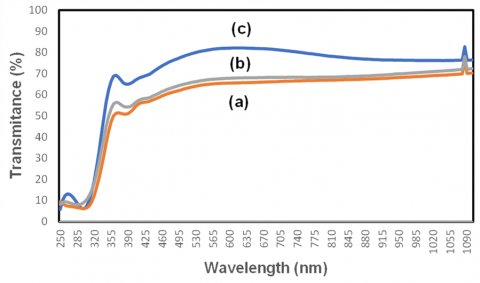
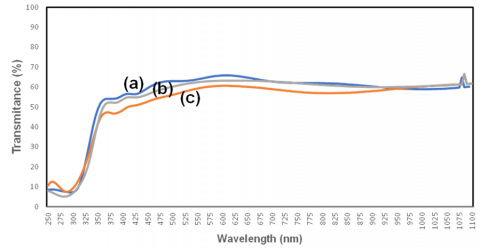
Measurement with UV-Vis spectroscopy on FTO glass aims to determine how much transmittance value it has and its wavelength (λ). This is done by firing ultraviolet (UV) light on a glass substrate. Figure 6 shows the results of transmittance measurements of samples made with variations in the distance of the nozzle to the collector. Light with a wavelength of 400 to 1.000 nm can be transmitted in a percentage above 50%. The further the distance of the nozzle to the collector, the greater the transmittance value [21].
Figure 5. The relationship between nozzle-collector distance and the formed crystal size
Figure 6. Results of Uv-Vis FTO produced by spray method with a variation of collector nozzle distance: (a) 11 cm; (b) 16 cm; and (c) 26 cm
4.3 Heating temperature
The formation of FTO film crystals is determined by the heating temperature because temperature plays a role in increasing crystallinity, controlling grain size, and affecting the optical and electrical properties of the film [16]. When heated, the atoms in the FTO film gain enough energy to form a more regular crystal structure, reduce crystal defects, and improve electrical conductivity and optical transparency. Higher temperatures usually produce larger crystal grains, which can increase the path of electron movement and decrease resistivity [22].
However, Figure 7 shows that the higher the heating temperature over 450℃, the more pores are formed. This relates to the process of evaporation on the existing substrate. Heating to 475℃ produces a pyramid-shaped SnO2:F crystal geometry and is different from previously reported geometries of bars and spheres [23].
Figure 7. SEM FTO results produced by spray method with heating time: (a) Heating temperature 450℃; (b) Temperature 475℃; and (c) Temperature 500℃
(a) Heating temperature of 450℃
(b) Heating temperature of 475℃
(c) Heating temperature of 500℃
Figure 8. XRD FTO film results produced by spray method with heating temperature
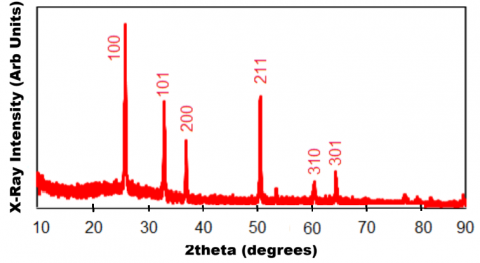
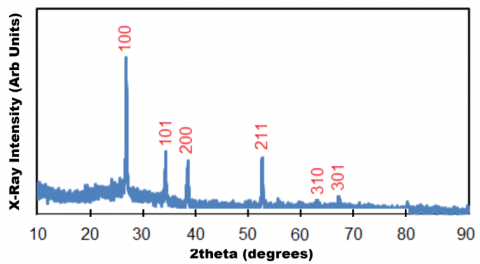
Figure 8(a) shows that SnO2:F crystals were identified at deposition at 450℃ through peaks at diffraction angles of 26.51° (100); 33.81° (101); 38.09° (200); 51.67° (211); 61.73° (310); and 65.81° (301). In heating temperatures of 475℃, Figure 8(b), it is known that crystals of SnO2:F were identified through peaks of 26.51° (100); 33.81° (101); 38.09° (200); 51.67° (211); 61.73° (310); and 65.81° (301). At 500℃ heating, Figure 8(c) reduces the intensity of the peak at a diffraction angle of 26.51° when compared to 450℃. SnO2:F crystals were identified through the same peak with a lower heating temperature.
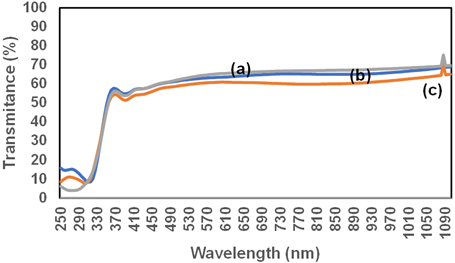
Figure 9 shows that the higher the temperature deposition time of the layer, the lower the transmittance. This is due to higher deposition temperatures can lead to changes in crystallinity, density, and roughness, which often result in lower transmittance due to increased light scattering or absorption [29].
Figure 9. Uv-Vis results on FTO produced by spray method with deposition temperature variation: (a) Heating temperature 450℃; (b) Temperature 475℃; and (c) Temperature 500℃
4.4 Deposition time
The timing of spraying the solution on the substrate was investigated at three different time variations. Figure 10 shows SEM results from three FTO films with different densities and pore counts.
Figure 10 shows that the longer the deposition time, the more particles are deposited and the fewer the number of pores. According to the XRD results in Figure 11, it is known that the length of deposition time does not significantly affect the particle size.
Figure 10. Surface morphology of FTO produced with deposition times of 20 minutes (a); 30 minutes (b) and 40 minutes (c) [13]
(a) 20 minutes
(b) 30 minutes
(c) 40 minutes
Figure 11. XRD results of FTO films produced by the spray method within 20-40 minutes
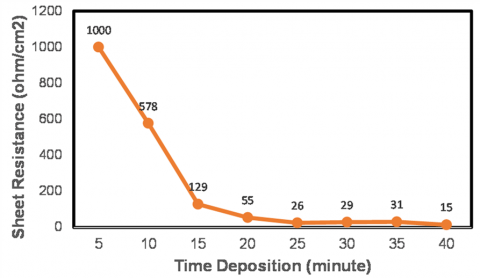
The length of deposition time decreases the resistivity value as shown by Figure 12 but decreases the particle transmittance as shown by Figure 13.
Figure 12. Relationship between deposition time and FTO Resistance
Figure 13. Results of Uv-Vis FTO measurements with deposition times of 20 minutes (a); 30 minutes (b); and 40 minutes (c)
Figure 13 shows that the longer the deposition time of the layer, the lower the transmittance [24]. This is due to the addition of fluorine (F) concentration in the SnO2 crystal structure through the substitution process. The amount of light in the FTO glass decreases due to the increase in the number of free electrons and the concentration of charge carriers [15]. The ideal conditions for an FTO are low resistance and high transmittance. Thus, a deposition time of around 20 minutes is close to the ideal conditions.
4.5 FTO applications with optimum performance on DSSC
The report through this study showed that the FTO with the best performance was obtained for FTO deposition with 0.7 M molarity, collector nozzle distance of 11 cm, heating temperature of 450℃, and deposition within 20 minutes. Resistance of 55.5 W and transmittance above 80.77% is the FTO with the best performance obtained in this study.
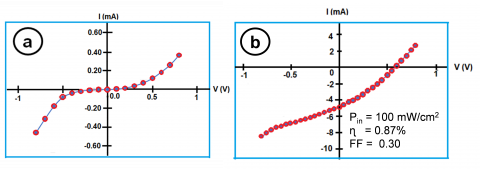
The DSSC in this study was fabricated using the produced FTO (resistance 55.5 W/cm2 and transparency more than 80%). The main electrode was produced by depositing TiO2 on the FTO using a spray method and then immersed in a dye solution. The electrolyte was inserted into the sandwich-structured DSSC with a platinum-coated counter electrode. To determine the photovoltaic characteristics, measurements were carried out in dark and bright conditions. In dark conditions, the IV characteristics of the DSSC were produced in accordance with the characteristics of the diode as shown in Figure 14(a). An efficiency of 0.87% was obtained from the measurement results using a Keithley IV meter according to Figure 14(b).
Figure 14. DSSC characterization using FTO produced: (a) dark; and (b) bright conditions [27]
Figure 14(a) shows that DSSC exhibits characteristics resembling an ideal diode. However, the large internal resistance causes the efficiency to be below 1.0% as shown in Figure 14(b). This is inseparable from several factors including electrode resistance, active layer and electrolyte [19].
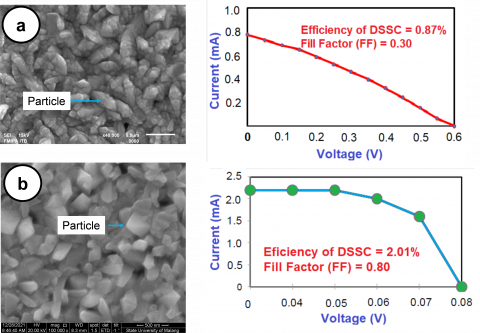
In this study, we used two types of FTO, sheet resistance both 50.5 W/cm2, for DSSC solar cells. The efficiency obtained for the two solar cells is different. DSSC solar cells with cone-shaped FTO morphology have better efficiency (2.01%) and fill factor (0.80) when compared to solar cells using FTO that have rod-shaped morphology.
Morphology of SnO2:F was also related to electrical conductivity of the film [20]. This is due to the presence of a very large electric field at the end of the SnO2:F particle, Figure 15(b), so the flow of electrons is better when compared to the DSSC solar cell in Figure 15(a) [21].
Figure 15 shows that SnO2:F particles can be oval and pyramidal as in Figure 15(a) and Figure 15(b), respectively. For pyramidal particles, we suspect that the sharp tip shape can produce a very high electric field so that this affects the efficiency of the solar cell in Figure 15(b) (2.01%) which is greater than Figure 15(a) (0.87%). The magnitude of the electric field (E) in the cone-shaped particles, according to Figure 15(b), can be known through Eq. (3) [21].
$E=\frac{\sigma}{\varepsilon_0} \ln \frac{r}{R}\left(1-\frac{H}{\sqrt{R^2+H^2}}\right)$ (3)
According to Eq. (3), a cone with height H and peak radius r and base radius R has a charge density s and an electric permittivity e0. Thus, at the tip of the cone (assuming the value of r is close to 0) the magnitude of the electric field (E) becomes infinite.
Figure 15. (a) DSSC solar cells with fibrous-shaped FTO morphology; and (b) DSSC Solar Cells with pyramid-shaped FTO particle morphology [29]
FTO has been successfully produced using the spray pyrolysis method in this study. SnO2:F particles were successfully formed according to identification by SEM, EDS and XRD. The results of surface morphology characterization with SEM showed differences in FTO morphology for variations in concentration parameters, nozzle distance to collector, heating time, and temperature. The formation of the FTO layer was also confirmed through the identification of diffraction peaks at 26.5°; 38.0°; 52.0°; 55.0°; 62.0° and 66.0° according to the XRD results. The conductive and transparent properties of the formed layer were known through examination using the four-point probe method and UV-Vis Spectroscopy. FTO with a resistance of 55.5 W/cm2 and a transmittance above 80% was successfully used in DSSC. The difference in the morphological shape of SnO2:F particles affects the performance of DSSC. Thus, the results of this study provide a major contribution to the development of FTO in supporting a number of ideal performance applications such as electrodes in DSSC.
We would like to express our deepest gratitude to Kementerian Pendidikan, Kebudayaan, Riset, dan Teknologi Republik Indonesia for providing the PDUPT Grant with contract number 302/E4.1/AK.04/PT/202.
|
DSSC |
dye sensitized solar cells |
|
FTO |
fluorine doped tin oxide |
|
ITO |
indium tin oxide |
|
SEM |
scanning electron microscopy |
|
EDS |
electron dispersion spectroscopy |
|
XRD |
X-ray diffraction |
|
Uv-Vis |
ultra violet visible spectroscopy |
|
$\eta$ |
efficiency |
|
FF |
fill factor |
|
r |
cone radius at a specific position |
|
R |
radius of the cone base |
|
H |
cone height |
|
e |
electrical permittivity |
|
E |
electric field |
[1] Shah, S.S., Aziz, M.A., Al-Betar, A.R., Mahfoz, W. (2022). Electrodeposition of polyaniline on high electroactive indium tin oxide nanoparticles-modified fluorine doped tin oxide electrode for fabrication of high-performance hybrid supercapacitor. Arabian Journal Chemistry, 15(9): 104058. https://doi.org/10.1016/j.arabjc.2022.104058
[2] Ramanauskas, R., Iljinas, A., Marcinauskas, L, Milieška, M., Kavaliauskas, Ž, Gecevičius, G., Čapas, V. (2022). Deposition and application of indium-tin-oxide films for defrosting windscreens. Coatings, 12(5): 670. https://doi.org/10.3390/coatings12050670
[3] Naya, S., Shite, Y., Tada, H. (2020). Photothermal effect of antimony-doped tin oxide nanocrystals on the photocatalysis. Catalysis Communication, 142: 106044. https://doi.org/10.1016/j.catcom.2020.106044
[4] Bandara, T.M.W.J., Aththanayake, A.A.A.P., Kumara, G.R.A., Samarasekara, DeSilva, P.L.A., Tennakone, K. (2021). Transparent and conductive F-doped SnO2 nanostructured thin films by sequential nebulizer spray pyrolysis. MRS Advance, 6(16): 417-421. https://doi.org/10.1557/s43580-021-00017-0
[5] Boileau, A., Hurand, S., Baudouin, F., Lüders, U., Dallocchio, M., Bérini, B., Cheikh, A., David, A., Paumier, F., Girardeau, T., Marie, P., Labbé, C., Cardin, J., Aureau, D., Frégnaux, M., Guilloux-Viry, M., Prellier, W., Dumont, Y., Demange, V., Fouchet, A. (2022). Highly transparent and conductive indium-free Vanadates crystallized at reduced temperature on glass using a 2D transparent nanosheet seed layer. Advance Functional Materials, 32(5): 2108047. https://doi.org/10.1002/adfm.202108047
[6] Wang, J., Dong, F., Wang, Z., Yang, F., Du, M., Fu, K., Wang, Z. (2020). A novel method for purification of phosphogypsum. Physicochemical Problems of Mineral Processing, 56(5): 975-983. https://doi.org/10.37190/PPMP/127854
[7] Bhand, S., Jha, P.K., Ballav, N. (2022). Unusual enhancement in efficiency of DSSCs upon modifying photoanodes with reduced graphene oxide. Royal Society Chemistry Advances, 12(46): 30041-30044. https://doi.org/10.1039/d2ra05375f
[8] Tuyen, L.T.C., Jian, S.R., Tien, N.T., Le, P.H. (2019). Nanomechanical and material properties of fluorine-doped tin oxide thin films prepared by ultrasonic spray pyrolysis: Effects of F-doping. Materials, 12(10): 1665. https://doi.org/10.3390/ma12101665
[9] Gamard, A., Jousseaume, B., Toupance, T., Campet, G. (2019). New fluorinated stannic compounds as precursors of F-doped SnO2 materials prepared by the sol-gel route. Inorganic Chemistry, 38: 4671-4679. https://doi.org/10.1021/ic990163s
[10] Gamard, A., Babot, O., Jousseaume, B., Rascle, M.C., Toupance, T., Campet, G. (2000). Conductive F-doped tin dioxide sol−gel materials from fluorinated β-diketonate tin(IV) complexes. Characterization and thermolytic behavior. Chemistry of Materials, 12(11): 3419-3426. https://doi.org/10.1021/cm 001073k
[11] Wu, S., Yuan, S., Shi, L., Zhao, Y., Fang, J. (2010). Preparation, characterization and electrical properties of fluorine-doped tin dioxide nanocrystals. Journal of Colloid and Interface Science, 346(1): 12-16. https://doi.org/10.1016/j.jcis.2010.02.031
[12] Suffner, J., Agoston, P., Kling, J., Hahn, H. (2010). Chemical vapor synthesis of fluorine-doped SnO2 (FTO) nanoparticles. Journal of Nanoparticle Research, 12: 2579-2588. https://doi.org/10.1007/s11051-009-9827-3
[13] Saehana, S., Darsikin, Arifin, Z., Nasar. (2019). Developed spray pyrolysis reactor for fabricating fluorine-doped tin oxide (FTO). Journal of Physics: Conference Series, 1242: 012022. https://doi.org/10.1088/1742-6596/1242/1/012022
[14] Tuyen, L.T.C., Jian S.R., Tien, N.T, Le, P.H. (2019). Nanomechanical and material properties of fluorine-doped tin oxide thin films prepared by ultrasonic spray pyrolysis: Effects of F-doping. Materials, 12(10): 1665. https://doi.org/10.3390/ma12101665
[15] Saehana, S., Darsikin, Arifin, Z., Nasar. (2019). Optimization of fabricating fluorine-doped tin oxide by using spray pyrolysis methods. IOP Conference Series: Materials Science and Engineering, 622: 012032. https://doi.org/10.1088/1757-899X/622/1/012032
[16] Darsikin, Arifin, Z., Nasar, Saehana, S. (2018). Preliminary study in fabricating fluorine-doped tin oxide by using spray pyrolysis methods. IOP Conference Series: Materials Science and Engineering, 395: 012015. https://doi.org/10.1088/1757-899X/395/1/012015
[17] Adjimi, A., Zeggar, M.L., Attaf, N., Aida, M.S. (2018). Fluorine-doped tin oxide thin films deposition by sol-gel technique. Journal of Crystallization Process and Technology, 8(4): 89-106. https://doi.org/10.4236/jcpt.2018.84006
[18] Hussein, N., Khadum, M.M. (2021). Evaluation of the biosynthesized silver nanoparticles: Effects on biofilm formation. Journal of Applied Sciences and Nanotechnology, 1(1): 23-31. https://doi.org/10.53293/jasn.2021.11019
[19] Liu, R., Ren, A.P., Yang, Z., Tian, S., Tong, Y.Q., Xia, C.H., Wang, F. (2020). Growth and properties of fluorine-doped tin oxide films deposited by ultrasonic spray pyrolysis. Journal of Plastic Film and Sheeting, 36(1): 76-93. https://doi.org/10.1177/8756087919846204
[20] Joseph, D.P., Radha, R., Fernandes, J.M., Muniramaiah, R., Purushothamreddy, N., Kovendhan, M. (2022). Investigation of the transparent conducting properties of spray-pyrolyzed Li and F co-doped SnO2 thin film electrodes. Journal of Material Science: Material Electronics, 33(11): 8435-8445. https://doi.org/10.1007/s10854-021-06330-6
[21] Saehana, S., Darsikin., Yuliza, E., Arifin, P., Khairurrijal., Abdullah, M. (2014). A new approach for fabricating low cost DSSC by using carbon-ink from inkjet printer and its improvement efficiency by depositing metal bridge between titanium dioxide particles. Journal of Solar Energy Engineering, 136(4): 044504. https://doi.org/10.1115/1.4027695
[22] Fikri, D., Yuwono, A.H., Sofyan, N., Arini, T., Lalasari, L.H. (2017). The effect of substrate heating temperature upon spray pyrolysis process on the morphological and functional properties of fluorine tin oxide conducting glass. AIP Conference Proceedings, 1826(1): 020003. https://doi.org/10.1063/1.4979219
[23] Zima, T., Uvarov, N. (2023). Crystal growth of fluorine-doped tin oxide structures with extraordinary morphology by the hydrothermal method and their electrical conductivity. Journal of Crystal Growth, 616: 127254. https://doi.org/10.1016/j.jcrysgro.2023.127254
[24] Kutlu, N. (2020). Investigation of electrical values of low-efficiency dye-sensitized solar cells (DSSCs). Energy, 199: 117222. https://doi.org/10.1016/j.energy.2020.117222
[25] Yuwono, A.H., Arini, T., Lalasari, L.H., Sofyan, N., Ramahdita, G., Nararya, A. (2017). Preparation of nanostructured fluorine doped tin oxide (FTO) by hydrothermal method. International Journal of Technology, 8(7): 1336-1344. https://doi.org/10.4028/www.scientific.net/AMM.773-774.632
[26] Saehana, S., Darsikin, Sulfana, N., Yunanli, Arifin, Z. (2024). Characterization of fabricating fluorine-doped tin oxide using spray methods. AIP Conference Proceedings, 2799: 020146. https://doi.org/10.1063/5.0182096
[27] Saehana, S., Darsikin, Sulfana, N., Izza, A. Arifin, Z. (2024). Fabrication of fluorine-doped tin oxide fabricated by spray methods. AIP Conference Proceedings, 2799: 020144. https://doi.org/10.1063/5.0182098
[28] Zheng, Q.J., Yang, R.Y., Zeng, Q.H., Zhu, H.P., Dong, K.J., Yu, A.B. (2024). Interparticle forces and their effects in particulate systems. Powder Technology, 436(1): 119445. https://doi.org/10.1016/j.powtec.2024.119445
[29] Saehana, S., Darsikin, Muslimin, Nasar. (2018). Small scale DSSC panels design and its performance. Journal of Physics: Conference Series, 1093(1): 012034. https://doi.org/10.1088/1742-6596/1093/1/012034