Eihab A. Raouf![]()
© 2026 The author. This article is published by IIETA and is licensed under the CC BY 4.0 license (http://creativecommons.org/licenses/by/4.0/).
OPEN ACCESS
In this study, the influence of engine speed on the thermal and exergetic performance of a hydrogen-diesel dual-fuel engine was examined using one-dimensional Diesel-RK simulations. Generally, the simulation matrix included multiple speeds, loads, and hydrogen energy shares, while representative full-load cases were analyzed in detail. Thermal performance was evaluated in terms of brake power (BP), brake thermal efficiency (BTE), and brake-specific fuel consumption (BSFC), while exergy efficiency and exergy destruction were used to assess exergetic behavior. Brake power increased with engine speed in all cases, whereas BTE decreased at higher speeds due to intensified friction and heat-transfer losses. BSFC generally increased with engine speed, while hydrogen substitution tended to reduce BSFC under the analyzed full-load conditions, with more pronounced effects at higher engine speeds. At the highest speed, raising the hydrogen share to 25% reduced BSFC by up to 23% under specific full-load, high-speed conditions. From an exergetic perspective, exergy efficiency decreased with engine speed for all cases, dropping from about 25.5% at 1000 rpm to 12.4% at 4000 rpm for the diesel baseline. Exergy destruction increased significantly with engine speed, confirming that it was the primary driver of thermodynamic irreversibilities. At high speeds, hydrogen enrichment reduced exergy destruction by up to about 3% and slightly increased exergy efficiency.
diesel engine, exergy analysis, exergy destruction, exergy efficiency, hydrogen energy substitution, hydrogen–diesel dual-fuel, Ricardo E6
Due to the rising price of oil and its limited resources, engine manufacturers are using alternative energy sources instead of oil fuels. Alternative fuels hold significant importance due to their extraction from renewable resources and their lower emissions compared to traditional fossil fuels. These fuels have the advantage of emitting fewer air pollutants compared to diesel fuel, and most are also more economical and renewable than oil [1]. Most alternative gaseous fuels have relatively high auto-ignition temperatures, it cannot be directly employed in compression-ignition (CI) engines without an external means of combustion initiation, as the temperature reached at the end of the compression stroke is insufficient to trigger self-ignition. Consequently, dual-fuel operation is required, in which the gaseous fuel is ignited by a small pilot injection of diesel fuel. Dual-fuel diesel engines have been widely adopted in automotive applications because of their high thermal efficiency. Recent years have seen significant numerical and experimental research dedicated to understanding the combustion characteristics and pollutant formation mechanisms of hydrogen-fueled engines [2].
In a fast-paced, competitive world, the improvement of these engines’ performance has become an important issue for automotive manufacturers. To improve engine performance, the combustion process is studied more comprehensively nowadays using the simultaneous application of the first and second laws of thermodynamics. Exergy is the key concept in the second law analysis; it is a special case of the more fundamental concept, the available energy, which has been introduced [3].
Many researchers have used hydrogen as a fuel in spark ignition (SI) engines. A significant reduction in power output was observed while using hydrogen in SI engines; in addition, pre-ignition, backfire, and knocking problems were observed at high load. These problems have resulted in using hydrogen in SI engines within a limited operating range. However, hydrogen cannot be used as a sole fuel in a CI engine, since the compression temperature is not enough to initiate combustion due to its higher self-ignition temperature [4]. The hydrogen-operated dual-fuel engine has the property to operate with lean mixtures at part load and no load, which results in NOx reduction, with an increase in thermal efficiency, thereby reducing fuel consumption. It was also observed that hydrogen could be substituted for diesel up to 38% on a volume basis without loss in thermal efficiency; however, there was a nominal power loss [5].
Most previous research on hydrogen–diesel dual-fuel engines has concentrated on first-law performance indicators such as brake thermal efficiency (BTE) and emissions, with relatively fewer investigations incorporating second-law analysis to reveal underlying irreversible processes [6]. A three-dimensional energy and exergy analysis of a hydrogen/diesel dual-fuel engine demonstrated that an increased hydrogen fuel-air ratio led to diminished exergetic efficiency and a decrease in the irreversibility fractions of the fuel chemical exergy, underscoring the sensitivity of exergy parameters to fuel composition [7]. Several studies have discussed the influence of hydrogen energy share on the energy and exergy behavior of dual-fuel engines through parametric variations aimed at identifying favorable combustion conditions [8]. Many studies provide useful trends; they generally report aggregate exergy indicators without resolving how individual loss mechanisms evolve under practical engine operating conditions. Therefore, the existing literature fails to sufficiently clarify the relative contributions of different sources of exergy destruction [9].
Experimental studies on a four-stroke turbocharged engine using hydrogen addition levels of 2.5%, 5%, and 7.5% reported an increase in BTE of up to 13% at higher hydrogen shares, accompanied by reductions in CO and HC emissions of approximately 12% and 18%, respectively. These findings are consistent with the results of the present study, in which the B20–hydrogen blend demonstrated favorable sustainability performance, yielding a brake-specific fuel consumption (BSFC) reduction in the range of 12–18% and an improvement in BTE of about 15% [10].
Moreover, while exergy analysis offers more information about the true thermodynamic loss mechanisms beyond conventional efficiency measures, its application in research-grade CI engines remains limited, especially under hydrogen–diesel dual-fuel operation [11]. Experimental studies on energy and exergy fractions in dual-fuel engines, albeit with other low-reactivity fuels such as CNG, suggest that adjustments to combustion chemistry influence both first- and second-law efficiencies [12]. However, these experimental results do not isolate the effects of hydrogen addition nor quantify the irreversibility contributions of different processes (such as mixing, combustion, and heat transfer), leaving a notable gap in knowledge regarding the basic thermodynamic behavior of hydrogen–diesel dual-fuel systems [13].
Knowing how to analyze hydrogen–diesel dual-fuel combustion, therefore, requires more than reporting overall efficiency trends. While several studies have shown that exergy destruction in internal combustion engines varies with operating conditions, fuel characteristics, and combustion mode, these influences are often treated in a generalized manner [14]. The implications for hydrogen-assisted diesel combustion remain insufficiently explored. Focusing on the distribution and origin of irreversible losses, rather than on aggregated efficiency metrics alone, allows a more physically grounded interpretation of engine inefficiencies and provides clearer guidance for meaningful performance improvement [15].
The maximum available work and irreversibility (mixing, combustion, unburned, and friction) of a dual-fuel diesel engine (H₂-diesel) were analyzed using exergy analysis. The results showed that the maximum available work of the diesel engine at rated load increased from 29% with conventional base mode (without H₂) to 31.7% with dual-fuel mode (18% H₂ energy share), whereas the total irreversibility of the engine decreased drastically from 41.2% to 39.3%. The energy efficiency of the engine with H₂ increased by about 10% with a 36% reduction in CO₂ emission [16].
A numerical study investigated the effects of injection timing with different equivalence ratios on energy and exergy terms in a direct-injection SI hydrogen-fueled engine. The results indicated that combustion irreversibilities and exhaust gas availability are more affected by varying the equivalence ratio, and the amount of fuel availability that transfers to the environment with exhaust gases increased with increasing equivalence ratio. Changing the equivalence ratio has a different impact on the cumulative work availability and reduces fuel availability in late and early injection strategies. In addition, entropy generation was reduced by retarding the hydrogen injection timing and decreasing the equivalence ratio [17].
While first-law-based indicators describe the overall energy balance, exergy analysis offers explanations for the irreversibilities generated during combustion, heat transfer under finite temperature differences, flow friction, and mixing [18]. Previous work has reported a strong dependence of exergy destruction on operating conditions such as engine load, rotational speed, and fuel injection characteristics, which reinforces the value of second-law considerations in engine optimization. Despite these findings, most published studies remain centered on conventional diesel and spark-ignition engines, and only a limited number have addressed hydrogen-assisted combustion concepts [19].
Some researchers have also analyzed the effect of the combination of hydrogen with different fuels in various engine configurations using the second law of thermodynamics, also called exergy analysis. The effect of hydrogen addition in natural and landfilled gases was analyzed based on second-law analysis and demonstrated the fundamental changes in terms of irreversibility generation during combustion. Based on a zero-dimensional model for the closed part of the engine cycle operation, the addition of hydrogen showed a dramatic improvement in the performance. This phenomenon was explained as in the case of combustion of hydrocarbon fuels, large organic compounds are broken into smaller light molecules, which chemically lead to a high rate of entropy generation. Contrarily, light hydrogen molecules reduce this entropy generation and thus deliver better performance or availability [20].
Furthermore, most available exergy studies on hydrogen-fueled engines focus on isolated operating points or narrow speed ranges, which restricts their applicability to practical engine operation [21]. Comprehensive analyses covering wide engine speed ranges under steady-state conditions are still scarce, particularly for research engines operating in hydrogen–diesel dual-fuel mode. This limitation hinders the development of generalized insights into how operating speed influences exergy efficiency and irreversibility patterns in hydrogen-assisted diesel combustion [22]. Recent studies published in the International Journal of Heat and Technology have also investigated heat transfer and thermodynamic performance in internal combustion engines [23, 24].
To clarify these unresolved issues, this study investigates thermodynamic irreversibilities and exergetic efficiency in a Ricardo E6 research engine operating under hydrogen–diesel dual-fuel conditions using a numerical approach. A one-dimensional combustion model is combined with first- and second-law analyses to examine how partial substitution of diesel with hydrogen influences the distribution of irreversible losses throughout the engine cycle and how these changes are reflected in overall exergetic performance. In addition to the quantitative results, the adopted framework offers a practical and reproducible basis for analyzing dual-fuel combustion systems, which may assist future efforts aimed at improving efficiency through more informed combustion control. While these studies provide valuable performance trends, they do not explain the thermodynamic mechanisms responsible for such trends, nor do they clarify how hydrogen influences overall thermodynamic performance and exergy destruction under the adopted modeling assumptions.
The objectives of this research are as follows:
1. To analyze the thermodynamic irreversibilities of a hydrogen–diesel dual-fuel engine at different speeds and loads, focusing on the distribution of exergy destruction.
2. To investigate how hydrogen addition impacts the exergetic efficiency of a Ricardo E6 research engine operating in a hydrogen-diesel dual-fuel setup, with a particular focus on overall exergy destruction.
3. To identify the dominant energy and exergy loss mechanisms associated with combustion, heat transfer, and exhaust processes during dual-fuel operation, and to examine how their relative contributions vary with hydrogen addition.
This study develops a one-dimensional numerical exergy-based approach to analyze hydrogen energy substitution effects.
The numerical analysis was performed on a Ricardo E6 single-cylinder research engine representative of hydrogen–diesel dual-fuel operation. In this configuration, diesel fuel was retained to ensure stable ignition, while hydrogen was introduced to partially replace the diesel energy input. The method described here represents a practical hydrogen-assisted CI operation while reducing the risks associated with fully premixed combustion.
Rather than varying multiple operating parameters simultaneously, engine load was controlled through adjustments in the injected fuel quantity, while engine speed was kept constant for each case. This decision was taken to isolate the thermodynamic influence of hydrogen replacement and to provide a clearer interpretation of changes in energy conversion behavior under comparable operating conditions.
A one-dimensional Diesel-RK model was built for the Ricardo E6 engine using its geometry and operating settings. It was then used to predict the in-cylinder pressure trace, heat-release history, and heat-transfer losses under steady-state conditions. Before starting the primary analysis, the simulation behavior was checked to confirm that the predicted pressure traces and combustion phasing followed physically consistent trends that fall within established ranges reported in the literature over the investigated operating range.
The analysis was carried out in two stages. Baseline thermal behavior was first evaluated using a first-law energy balance. An exergy analysis was then conducted to locate the main sources of irreversibility over the engine cycle. Diesel and hydrogen exergy inputs were treated separately to track the effect of fuel substitution on exergy efficiency and total exergy destruction. The methodology combined Diesel-RK simulations with post-processed exergy calculations to track how hydrogen substitution shifted the main loss pathways, rather than relying on overall efficiency trends alone. As a result, all speed–load points were compared on the same basis using a transparent, repeatable workflow.
3.1 Engine configuration and operating conditions
The numerical investigation was performed on a Ricardo E6 single-cylinder research engine operating in CI mode. The engine was configured for hydrogen–diesel dual-fuel operation, where diesel fuel served as the pilot to ensure stable ignition, while hydrogen partially replaced the diesel energy input.
3.1.1 Engine specifications
Table 1 summarizes the main specifications of the Ricardo E6 research engine considered in this study. The Ricardo E6 engine is equipped with a variable compression ratio (VCR) mechanism; therefore, the compression ratio was fixed at 17.5:1 in the present investigation to ensure stable pilot ignition and to avoid abnormal combustion behavior that may arise with hydrogen addition.
Table 1. Specifications of the Ricardo E6 research engine
|
Parameter |
Specification |
|
Engine type |
Ricardo E6 research engine |
|
Engine configuration |
Single-cylinder, four-stroke |
|
Aspiration |
Naturally aspirated |
|
Combustion mode |
Compression-ignition (CI) |
|
Cooling system |
Water-cooled |
|
Valvetrain |
4-valve engine |
|
Bore × Stroke (mm) |
76.2 × 110 |
|
Displacement volume (L) |
0.507 |
|
Variable compression ratio (VCR) |
Yes (VCR-capable) |
|
Compression ratio |
17.5:1 |
|
Max Output and Max Torque |
Not applicable due to VCR configuration (numerically determined) |
|
Rated speed (rpm) |
1000–4000 (operating range) |
|
Fuel injection system |
Direct injection |
|
Hydrogen supply method |
Port fuel injection / Intake manifold |
|
Baseline fuel |
Diesel |
|
Secondary fuel |
Hydrogen |
|
Operating mode |
Hydrogen–diesel dual-fuel |
|
Simulation approach |
(Diesel-RK) |
Diesel injection timing and valve timing were fixed at the default Diesel-RK settings for all cases. They were not adjusted, since the analysis targeted the effect of hydrogen energy substitution on second-law performance rather than combustion phasing or gas-exchange optimization. The reference ambient conditions were set to $\mathrm{T}_0$ = 313 K and $\mathrm{p}_0$ = 1 bar. Since the Ricardo E6 is a VCR research engine with no fixed rated torque or power, the full-load reference at each engine speed was established numerically by increasing the injected diesel fuel quantity until the maximum brake torque point was reached at the selected compression ratio.
3.1.2 Engine operating conditions and load definition
The operating matrix was formulated to assess the coupled influence of engine speed and load under different hydrogen energy shares. The simulations were performed at 1000, 2000, 3000, and 4000 rpm, and at load levels of 25%, 50%, 75%, and 100%. At each speed–load point, the hydrogen energy share was set to 0%, 10%, 20%, and 25%.
Engine load was defined as a percentage of the full-load brake torque at each speed. Part-load points (25%, 50%, and 75%) were generated by decreasing the injected diesel mass per cycle until the simulated brake torque reached the required percentage of the full-load torque at the same engine speed. Throughout the analysis, engine speed was kept constant for each operating case to ensure consistent comparisons of energy and exergy indicators. All simulated points were treated as steady-state operating conditions. In total, the simulation campaign comprised 80 operating cases as shown in Appendix A, providing a structured dataset for evaluating speed–load coupled irreversibility trends under controlled hydrogen substitution.
3.1.3 Properties of diesel fuel and hydrogen
The main thermophysical and chemical properties of diesel fuel and hydrogen used in this study are summarized in Table 2.
Table 2. Properties of diesel fuel and hydrogen
|
Property |
Diesel |
Hydrogen |
|
Chemical formula |
C₁₂–C₂₀ (approx.) |
H₂ |
|
Physical state |
Liquid |
Gas |
|
Lower heating value (MJ/kg) |
42.5 |
120 |
|
Stoichiometric air–fuel ratio |
14.5 |
34.3 |
|
Auto-ignition temperature (K) |
530 |
858 |
|
Flame speed (m/s) |
Low |
High |
|
Carbon content |
High |
Zero |
|
Chemical exergy factor (ф) |
1.06 |
1.00 |
These properties were employed to compute the energy and exergy contributions of each fuel. Combustion kinetics and detailed reaction mechanisms were not explicitly modeled in the present framework. For each engine speed, the baseline injected diesel fuel quantity was first determined to achieve the target load levels, and these diesel-only values were subsequently used as reference conditions for defining hydrogen substitution cases at equivalent loads.
3.2 Dual-fuel strategy and numerical model
The hydrogen–diesel dual-fuel strategy employed in this study uses diesel fuel as a pilot to initiate combustion, while hydrogen is introduced as a supplementary fuel to partially replace the diesel energy input. Hydrogen substitution was defined on an energy basis. For each operating case, the diesel fuel quantity was adjusted in proportion to the prescribed hydrogen energy share while maintaining a consistent definition of engine load.
A one-dimensional modeling approach was adopted to capture the key thermodynamic behavior of hydrogen-assisted dual-fuel operation with modest computational effort, enabling simulations over a wide operating matrix. Before running the full set of cases, the simulated in-cylinder pressure traces and heat-release profiles were checked to ensure physically consistent trends across the investigated range.
3.2.1 Diesel-RK model setup and extracted outputs
The Diesel-RK model was built using the Ricardo E6 geometry and the operating matrix defined in Section 3.1. For each case, the required outputs were taken directly from the simulation, including brake power, brake torque, exhaust temperature, intake air mass flow rate, total fuel flow rate, heat-transfer losses, and mechanical loss. The extracted data were then processed in an Excel sheet, where the same thermodynamic and exergy equations were applied to the full operating matrix.
3.3 Model validation and consistency assessment
The simulation outputs were evaluated against reported ranges for similar CI engines to verify their reliability. The predicted peak cylinder pressure, BTE, and brake-specific fuel consumption were within the ranges reported in previous experimental and numerical studies of hydrogen–diesel dual-fuel engines. In particular, the BTE obtained in this study (about 13–27%) falls within the values reported under comparable conditions [25, 26]. The predicted trends of BSFC and exhaust temperature with increasing engine speed were also consistent with established engine behavior.
The results remained consistent across the full operating matrix. The variation of the main thermodynamic and exergy indicators with engine speed and hydrogen energy share followed physically plausible trends without irregular deviations, indicating stable model performance. The exergy balance was also evaluated for all cases. The residual remained within a narrow tolerance, indicating internal consistency.
3.4 Thermodynamic and exergy formulation
The thermodynamic performance of the engine was evaluated using a combined first-law (energy) and second-law (exergy) framework to assess both the quantity and quality of energy conversion. The energy analysis established the overall balance by relating the fuel chemical energy input to the brake power output and major loss pathways, including exhaust and heat-transfer losses, from which conventional indicators such as BTE were obtained.
An exergy analysis was then carried out to evaluate the useful work potential of the supplied fuel and to pinpoint the main sources of irreversibility controlling engine performance. Under dual-fuel operating conditions, the total chemical exergy rate of the supplied fuel was evaluated as the combined contribution of diesel and hydrogen fuels [27]. The general expression for the fuel exergy rate is given in Eq. (1) [28].
$\dot{\mathrm{E}} \mathrm{x}_{\mathrm{fuel}}=\sum \dot{\mathrm{m}}_{\mathrm{fuel}} \cdot \phi_{\mathrm{fuel}} \cdot L H V_{\mathrm{fuel}}$ (1)
For hydrogen–diesel dual-fuel operation, Eq. (1) was extended as shown in Eq. (2) [28].
$\dot{\mathrm{E}} x_{\mathrm{fuel}}=\dot{\mathrm{m}}_{\mathrm{d}} \cdot \phi_{\mathrm{d}} \cdot \mathrm{LHV}_{\mathrm{d}}+\dot{\mathrm{m}}_{\mathrm{H}_2} \cdot \phi_{\mathrm{H}_2} \cdot \mathrm{LHV}_{\mathrm{H}_2}$ (2)
where, the total fuel mass flow rate is given by Eq. (3) [28].
$\dot{\mathrm{m}}_{\text {fuel }}=\dot{\mathrm{m}}_{\mathrm{d}}+\dot{\mathrm{m}}_{\mathrm{H}_2}$ (3)
Here, $\dot{\mathrm{m}}_{\mathrm{d}}$ and $\dot{\mathrm{m}}_{\mathrm{H}_2}$ are the mass flow rates of diesel and hydrogen, respectively, LHV denotes the lower heating value of each fuel; $\phi_{\mathrm{d}}$ and $\phi_{\mathrm{H}_2}$ are the chemical exergy factors of diesel and hydrogen. Literature values of the chemical exergy factors were adopted, with $\phi_{\mathrm{d}}=1.06$ for diesel fuel and $\phi_{\mathrm{H}_2}=$ 1.00 for hydrogen. The exhaust gas mass flow rate is given by Eq. (4) [28].
$\dot{\mathrm{m}}_{\mathrm{exh}}=\dot{\mathrm{m}}_{\mathrm{air}}+\dot{\mathrm{m}}_{\mathrm{fuel}}$ (4)
The total fuel energy rate was calculated using Eq. (5) [29].
$\dot{Q}_{\text {fuel }}=\frac{\dot{m}_d L H V_d+\dot{m}_{H_2} L H V_{H_2}}{1000}$ (5)
BTE is defined in Eq. (6) [30].
$\eta_{\text {th }}=\frac{\mathrm{BP}}{\dot{\mathrm{Q}}_{\text {fuel }}} \times 100 \%$ (6)
In internal combustion engines, the exergy associated with useful work is numerically equal to the brake power, hence: $\dot{\mathrm{E}} \mathrm{x}_{\text {work }}=\mathrm{BP}$. Accordingly, the exergy efficiency is expressed in Eq. (7) [31].
$\eta_{\mathrm{ex}}=\frac{\dot{\mathrm{E}} \mathrm{x}_{\mathrm{work}}}{\dot{\mathrm{E}} \mathrm{x}_{\mathrm{finel}}} \times 100 \%$ (7)
The physical exergy of the exhaust gases was evaluated from the temperature difference between the exhaust and the reference environment, with the pressure term neglected, as given in Eq. (8) [29].
$\dot{\mathrm{E}} \mathrm{x}_{\mathrm{exh}}=\frac{\dot{\mathrm{m}}_{\mathrm{exh}} \mathrm{cp}_{\mathrm{exh}}\left[\left(\mathrm{T}_{\mathrm{exh}}-\mathrm{T}_0\right)-\mathrm{T}_0 \ln \left(\frac{\mathrm{~T}_{\mathrm{exh}}}{\mathrm{T}_0}\right)\right]}{1000}$ (8)
where, $c p_{e x h}$ is the exhaust-gas specific heat capacity, assumed constant at $1.1 \mathrm{~kJ} / \mathrm{kg} . \mathrm{K}$ for consistency across the operating matrix. $\mathrm{T}_{\mathrm{exh}}$ is the exhaust gas temperature (K), and $\mathrm{T}_0$ is the reference ambient temperature (K). The exergy associated with heat losses was calculated as expressed in Eq. (9) [29].
$\dot{\mathrm{E}} \mathrm{x}_{\text {heat }}=\sum \dot{\mathrm{Q}}_{\mathrm{i}}\left(1-\frac{\mathrm{T}_0}{\mathrm{~T}_{\mathrm{i}}}\right)$ (9)
Mechanical losses were treated as destroyed exergy, which was calculated using Eq. (10) [29]:
$\dot{E} \mathrm{x}_{\text {mech }}=$ Mechanical loss (10)
Finally, the exergy destruction was evaluated from the overall exergy balance is defined in Eq. (11) [29].
$\begin{gathered}\dot{E} x_{\text {dest }}=\dot{E} x_{\text {fuel }}-\left(\dot{E} x_{\text {work }}+\dot{E} x_{\text {heat,loss }}+\dot{E} x_{\text {exh }}\right. \\ \left.+\dot{E} x_{\text {mech,loss }}\right)\end{gathered}$ (11)
The overall exergy balance residual was evaluated for all operating cases and was found to remain within a small numerical tolerance across the complete dataset, confirming the internal consistency and reliability of the post-processing calculations.
All extracted and post-processed data were carefully rechecked for consistency across the entire operating matrix. Any minor deviations from local trends were verified against the original Diesel-RK outputs to ensure that they reflect actual model predictions rather than transcription or processing errors.
3.5 Post-processing hydrogen modeling approach
This post-processing approach does not aim to replicate detailed combustion chemistry; rather, it isolates thermodynamic trends under controlled energy input conditions. Owing to the absence of an explicit hydrogen combustion model within the employed Diesel-RK version, in-cylinder thermodynamic states and engine performance parameters were first obtained assuming conventional diesel-only combustion. Hydrogen participation was subsequently introduced during post-processing using an equivalent energy-substitution approach while maintaining a consistent total fuel energy input definition. Hydrogen energy share was defined as given in Eq. (12) [22, 32].
$\mathrm{x}_{\mathrm{H}_2}=\frac{\dot{\mathrm{E}}_{\mathrm{H}_2}}{\dot{\mathrm{E}}_d+\dot{\mathrm{E}}_{\mathrm{H}_2}}$ (12)
The adjusted diesel mass flow rate was calculated as expressed in Eq. (13) [22, 32].
$\dot{\mathrm{m}}_{\mathrm{d}_{\text {new }}}=\left(1-\mathrm{x}_{\mathrm{H}_2}\right) \dot{\mathrm{m}}_{\mathrm{d}_{\text {base }}}$ (13)
Hydrogen mass flow rate is calculated using Eq. (14) [22, 32].
$\dot{\mathrm{m}}_{\mathrm{H}_2}=\frac{\mathrm{x}_{\mathrm{H}_2} \times \dot{\mathrm{m}}_{\mathrm{d}_{\text {base }}} \times \mathrm{LHV}_{\mathrm{d}}}{\mathrm{LHV}_{\mathrm{H}_2}}$ (14)
Hydrogen energy shares were limited to 10–25% to represent moderate substitution levels and to avoid extreme premixed behavior. The numerically calibrated full-load reference data used for load normalization are summarized in Table 3. It should be noted that the adopted post-processing approach does not resolve detailed hydrogen combustion chemistry or reaction kinetics. Therefore, the present analysis is limited to thermodynamic and exergy-based interpretations and does not aim to describe combustion reactivity or flame propagation characteristics.
3.6 Reproducibility of the numerical framework
All simulations were performed under identical model settings, and no case-dependent tuning was introduced. A predefined matrix covering engine speed, load level, hydrogen energy share, and compression ratio was applied uniformly across the complete dataset. Full-load reference points were determined at the numerically calibrated maximum-torque condition for each speed, while part-load conditions were obtained by scaling the injected diesel fuel quantity as summarized in Table 3.
Table 3. Load definition and corresponding fuel injection quantities at various engine speeds
|
Engine Speed (rpm) |
Load (%) |
Max Torque (N‧m) |
Fuel Consumption (g/cycle) |
|
1000 |
25 |
|
0.01383 |
|
|
50 |
|
0.02765 |
|
|
75 |
|
0.04148 |
|
|
100 |
52.11 |
0.05530 |
|
2000 |
25 |
|
0.01623 |
|
|
50 |
|
0.03245 |
|
|
75 |
|
0.04868 |
|
|
100 |
60.86 |
0.06490 |
|
3000 |
25 |
|
0.01880 |
|
|
50 |
|
0.03760 |
|
|
75 |
|
0.05640 |
|
|
100 |
59.32 |
0.07520 |
|
4000 |
25 |
|
0.02302 |
|
|
50 |
|
0.04605 |
|
|
75 |
|
0.06908 |
|
|
100 |
51.3 |
0.09210 |
Because the Diesel-RK version used does not include an explicit hydrogen combustion model, hydrogen–diesel dual-fuel conditions were implemented through the post-processing energy-substitution approach at constant total fuel energy definition. The required diesel and hydrogen quantities were computed using $\mathrm{LHV}_{\mathrm{d}}$ = 42.5 MJ/kg and $\mathrm{LHV}_{\mathrm{H}_2}$ = 120 MJ/kg. The resulting redistribution of fuel quantities for hydrogen energy shares of 10–25% is summarized in Appendix A (Table A1).
Thermodynamic outputs were extracted from Diesel-RK (Appendix A, Table A2) and processed in an Excel-based framework where the exergy formulations described in Section 3.3 were applied. The final exergy indicators are reported in Appendix A (Table A3). This workflow ensures that the reported trends reflect systematic changes in operating conditions and fuel substitution rather than numerical artifacts, and it can be readily reproduced using Diesel-RK or adapted to similar compression-ignition engines operating under hydrogen–diesel dual-fuel conditions.
This section presents and discusses the numerical findings describing the influence of engine speed on the thermal and exergetic performance of the Ricardo E6 engine under steady-state full-load conditions. The simulations were conducted over an engine speed range of 1000–4000 rpm. The reported thermal indicators included brake power, BTE, and BSFC. The exergy-based indicators included exergy efficiency and exergy destruction. Supporting operating parameters such as fuel consumption per cycle, excess-air ratio (λ), and exhaust gas temperature were reported for completeness in Appendix A (Table A2).
This section presents representative results at full-load conditions to highlight the dominant thermodynamic trends associated with engine speed and hydrogen energy substitution. Full-load operation was selected as a reference condition, as it represents the most demanding regime in which thermodynamic irreversibilities are most pronounced.
The complete dataset covering all investigated speeds, loads, and hydrogen energy shares is provided in Appendix A. The trends observed under full-load conditions were consistent with those obtained across part-load operation and are therefore considered representative of the overall system behavior.
The simulations were performed over an engine speed range of 1000–4000 rpm with hydrogen energy shares of 0%, 10%, and 25%. The thermal indicators included brake power, BTE, BSFC, and fuel consumption per cycle, while the exergy-based indicators included exergy efficiency and exergy destruction.
4.1 Thermal performance
4.1.1 Brake power and fuel consumption under hydrogen–diesel dual-fuel operation at full load
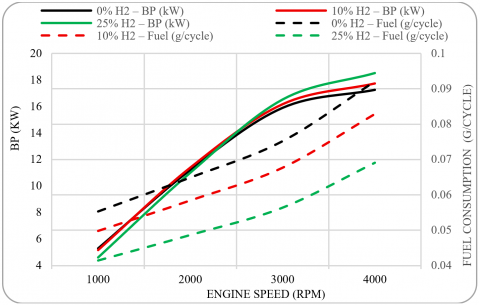
Figure 1 shows the variation of brake power and fuel consumption per cycle with engine speed at full-load operation for hydrogen energy shares of 0%, 10%, and 25%. Brake power increased steadily with engine speed for all fuel cases, indicating a higher overall rate of energy conversion at elevated speeds. Under baseline diesel operation (0% H₂), brake power rose from 5.31 kW at 1000 rpm to 17.26 kW at 4000 rpm. Under hydrogen-enriched operation, brake power also increased with speed, reaching 17.73 kW at 4000 rpm for 10% H₂ and 18.53 kW at 4000 rpm for 25% H₂.
Figure 1. Brake power and fuel consumption vs. engine speed at full load
Fuel consumption per cycle increased with engine speed in all cases, since higher speeds required more fuel to sustain full-load operation and to overcome greater mechanical and heat-transfer losses. Under baseline diesel operation (0% H₂), fuel consumption increased from approximately 0.055 g/cycle at 1000 rpm to about 0.092 g/cycle at 4000 rpm. With hydrogen enrichment, diesel consumption per cycle was consistently lower at the same operating points due to partial energy substitution.
This trend indicated that hydrogen substitution became more beneficial at high engine speeds, where the energy substitution contributed to maintaining brake output while reducing diesel consumption. Brake power increased with speed for all cases, while hydrogen enrichment reduced diesel consumption and slightly supported brake output at the highest speeds.
4.1.2 Brake thermal efficiency and brake specific fuel consumption under hydrogen–diesel dual-fuel operation at full load
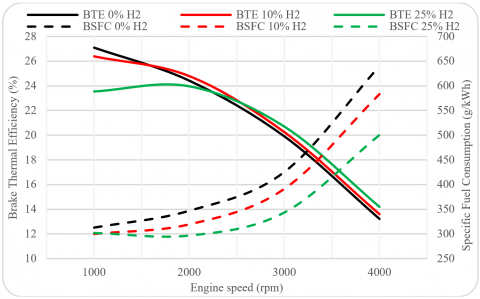
Figure 2 illustrates the variation of BTE and BSFC with engine speed at full load for hydrogen energy shares of 0%, 10%, and 25%. For all cases, BTE decreased continuously as speed increased, meaning a smaller share of the fuel energy contributed to brake work at elevated speeds. Under baseline diesel operation, BTE declined from 27.0% at 1000 rpm to 13.5% at 4000 rpm. Similarly, BTE decreased from 26.5% to 13.8% at 10% H₂ and from 23.5% to 14.2% at 25% H₂ over the same speed range. Differences among fuel cases were more apparent at low-to-medium speeds (1000–2000 rpm) and became less pronounced as speed approached 4000 rpm.
Figure 2. Brake thermal efficiency and brake-specific fuel consumption vs. engine speed at full load
In contrast, BSFC increased with engine speed for all fuel cases. Under baseline diesel operation, BSFC rose from about 320 g/kWh at 1000 rpm to nearly 650 g/kWh at 4000 rpm, indicating that higher speeds required a greater fuel input per unit brake work. Hydrogen enrichment generally reduced BSFC under full-load conditions, with the reduction becoming more noticeable at higher engine speeds. At 10% H₂, BSFC increased from about 300 g/kWh to about 580 g/kWh, while at 25% H₂ it increased from approximately 290 g/kWh to around 500 g/kWh between 1000 and 4000 rpm. At the highest engine speed, BSFC decreased by approximately 23% when the hydrogen energy share increased from 0% to 25%.
4.2 Exergetic performance of the hydrogen–diesel dual-fuel engine
This subsection evaluated the quality of energy conversion using exergy efficiency and exergy destruction under full-load conditions and examined how these indicators varied with engine speed and hydrogen energy share.
4.2.1 Exergy efficiency under hydrogen–diesel dual-fuel operation at full load
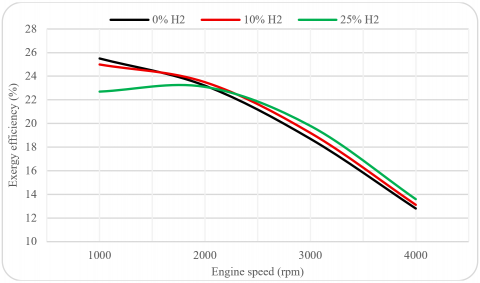
Figure 3 shows the effect of engine speed on exergy efficiency at full load for hydrogen energy shares of 0%, 10%, and 25%. Exergy efficiency declined as engine speed increased for all investigated cases, confirming that the quality of energy conversion deteriorated at high speeds. For the baseline diesel case (0% H₂), exergy efficiency decreased from about 25.5% at 1000 rpm to 22.9% at 2000 rpm, then to 18.7% at 3000 rpm, and finally to 12.4% at 4000 rpm.
Figure 3. Exergy efficiency vs. engine speed at full load for different hydrogen shares
Under hydrogen enrichment, a comparable trend was observed. At 10% H₂, exergy efficiency decreased from 25.0% at 1000 rpm to 12.9% at 4000 rpm. At 25% H₂, exergy efficiency was lower at 1000 rpm (about 22.5%), increased slightly to 22.8% at 2000 rpm, and then decreased to 19.8% at 3000 rpm and 13.6% at 4000 rpm. At high speeds (3000–4000 rpm), hydrogen-enriched operation provided marginally higher exergy efficiency than conventional diesel operation. For example, at 4000 rpm, increasing the hydrogen share from 0% to 25% raised exergy efficiency from about 12.4% to about 13.6%, corresponding to an improvement of roughly 10% relative to the baseline case.
4.2.2 Exergy destruction under hydrogen–diesel dual-fuel operation at full load
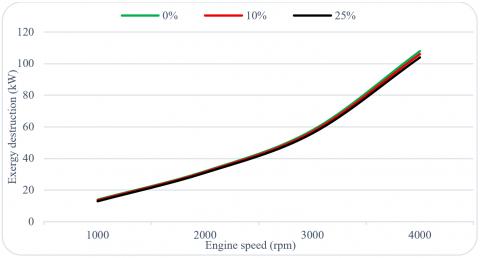
Figure 4 shows how exergy destruction varied with engine speed at full load for hydrogen shares of 0%, 10%, and 25%. Exergy destruction increased sharply with engine speed in all cases, reflecting stronger irreversibilities at higher rotational speeds. At 1000 rpm, exergy destruction was 12.63 kW for the diesel baseline (0% H₂) and rose slightly to 12.74 kW and 13.52 kW at 10% and 25% H₂, respectively. The small spread among the three cases at this speed indicated that hydrogen addition had only a minor effect on overall irreversibility under low-speed full-load operation.
Figure 4. Exergy destruction vs. engine speed at full load for different hydrogen shares
As speed increased to 2000 rpm, exergy destruction rose sharply for all cases, reaching 30.85 kW for 0% H₂, with similar values for 10% and 25% H₂. At 3000 rpm, exergy destruction reached 57.68 kW under diesel operation, then dropped slightly to 56.91 kW at 10% H₂ and 55.78 kW at 25% H₂, corresponding to an overall reduction of about 3.3% compared with the diesel baseline. At 4000 rpm, exergy destruction increased to 105.43 kW for the diesel case and decreased to 104.11 kW and 102.07 kW at 10% and 25% H₂, respectively, representing a maximum reduction of about 3.2%. Overall, engine speed remained the main driver of irreversibility growth at full load, while hydrogen enrichment provided a modest mitigation at high speeds by lowering exergy destruction without changing its rising trend.
4.3 Supporting operating parameters
The variations in thermal and exergetic performance with engine speed were further interpreted by examining supporting operating parameters, particularly the air–fuel ratio (λ) and exhaust gas temperature. As engine speed increased under full-load conditions, changes in λ reflected the increased fuel demand and altered mixing characteristics, which influenced the overall energy conversion process. Simultaneously, the rise in exhaust gas temperature at higher speeds indicated an increase in in-cylinder temperatures and enhanced heat transfer to the exhaust flow. These trends contributed to higher exhaust-related energy and exergy losses, reinforcing the observed decline in both BTE and exergy efficiency with increasing engine speed. Moreover, the interaction between λ variation and exhaust gas temperature helped explain the growth of irreversibilities and exergy destruction at elevated engine speeds. Overall, the behavior of these supporting parameters was consistent with the thermal and exergetic trends discussed earlier and provided additional insight into the mechanisms governing efficiency degradation at high engine speeds.
4.4 Overall performance trends
Increasing engine speed resulted in higher brake power but lower thermal and exergetic efficiencies, mainly due to intensified mechanical losses and growing thermodynamic irreversibilities. The simultaneous decline in BTE and exergy efficiency, together with the rise in exergy destruction, indicated that performance degradation at high engine speeds was governed by irreversible energy degradation mechanisms. Hydrogen enrichment showed beneficial effects on thermal performance under full-load conditions, particularly at higher engine speeds, while the extent of improvement varied across the operating matrix.
This study examined how engine speed influences the thermal and exergetic performance of a hydrogen–diesel dual-fuel engine under steady-state, full-load operation. Increasing engine speed resulted in higher brake power but reduced BTE due to increased mechanical losses, shorter effective combustion duration, and enhanced heat-transfer losses. Brake specific fuel consumption rose with engine speed; however, hydrogen enrichment improved thermal performance by enhancing fuel utilization and reducing fuel consumption and BSFC, particularly at high engine speeds. From an exergetic standpoint, exergy efficiency decreased with increasing engine speed for all fuel cases as internal irreversibilities became more significant. At the same time, exergy destruction rose progressively with engine speed, driven by intensified frictional effects, increased heat transfer, and higher exhaust-related losses, which collectively degraded the quality of energy conversion. Despite this trend, hydrogen enrichment reduced exergy destruction and produced slight improvements in exergy efficiency at high engine speeds, demonstrating its ability to reduce exergy destruction under the investigated thermodynamic conditions. Taken together, the thermal and exergetic results showed that engine speed was the primary factor driving performance deterioration, while hydrogen enrichment served as a mitigating measure rather than a fundamental alteration of engine thermodynamic behavior. The observed improvements in fuel consumption, BSFC, and exergy performance were primarily associated with full-load conditions, particularly at higher engine speeds, while the extent of these effects varied across the operating matrix, as indicated by the part-load results presented in Appendix A. The conclusions drawn from full-load conditions were consistent with the trends observed across the broader operating matrix, as documented in Appendix A.
The author acknowledges the Deanship of Scientific Research at Qassim University for supporting this research. The author also expresses his sincere appreciation to Professor Andrey Kuleshov (Moscow State Technical University) for granting access to the Diesel-RK software.
|
BP |
Brake power, kW |
|
BTE |
Brake thermal efficiency, % |
|
BSFC |
Brake specific fuel consumption, g. kWh−1 |
|
$\dot{E}_{\text {fuel}}$ |
Fuel energy rate, kW |
| $\dot{E} \mathrm{x}_{\text {dest}}$ | Exergy destruction rate, kW |
|
$\dot{E} \mathrm{x}_{\mathrm{exh}}$ |
Exhaust exergy rate, kW |
|
$\mathrm{Ex}_{\mathrm{fuel}}$ |
Fuel chemical exergy rate, kW |
|
$\dot{E} \mathrm{x}_{\text {heat}}$ |
Exergy rate associated with heat losses, kW |
|
LHV |
Lower heating value, MJ.kg−1 |
|
$\dot{\mathrm{m}}_{\text {air }}$ |
Air mass flow rate, kg·s−1 |
|
$\dot{\mathrm{m}}_{\mathrm{d}}$ |
Diesel mass flow rate, kg·s−1 |
|
$\dot{\mathrm{m}}_{\mathrm{exh}}$ |
Exhaust mass flow rate, kg·s−1 |
|
$\dot{\mathrm{m}}_{\mathrm{f}}$ |
Total fuel mass flow rate, kg·s−1 |
|
$\dot{\mathrm{m}}_{\mathrm{H} 2}$ |
Hydrogen mass flow rate, kg·s−1 |
|
N |
Engine speed, rpm |
|
p |
Pressure, kPa |
|
T |
Temperature, K |
|
T0 |
Reference (dead-state) temperature, K |
|
Greek symbols |
|
|
$\eta_{\mathrm{ex}}$ |
Exergy efficiency (%) |
|
$\lambda$ |
Excess-air ratio (–) |
|
$\phi$ |
Chemical exergy factor (–) |
|
Subscripts |
|
|
0 |
reference (dead state) |
|
d |
diesel |
|
dest |
destruction |
|
exh |
exhaust |
|
f |
fuel |
|
H2 |
hydrogen |
|
heat |
heat loss |
Table A1. Diesel and hydrogen fuel consumption at different engine speeds and load levels
|
Speed (rpm) |
Load (%) |
Diesel_Base (g/cycle) |
Diesel_New at xH2=10% |
H2 at xH2=10% |
Diesel_New at xH2=15% |
H2 at xH2=15% |
Diesel_New at xH2=20% |
H2 at xH2=20% |
Diesel_New at xH2=25% |
H2 at xH2=25% |
|
1000 |
25 |
0.01383 |
0.01244 |
0.000490 |
0.01175 |
0.000734 |
0.01106 |
0.000979 |
0.01037 |
0.001224 |
|
1000 |
50 |
0.02765 |
0.02489 |
0.000979 |
0.02350 |
0.001469 |
0.02212 |
0.001959 |
0.02074 |
0.002448 |
|
1000 |
75 |
0.04148 |
0.03733 |
0.001469 |
0.03525 |
0.002203 |
0.03318 |
0.002938 |
0.03111 |
0.003672 |
|
1000 |
100 |
0.05530 |
0.04977 |
0.001959 |
0.04701 |
0.002938 |
0.04424 |
0.003917 |
0.04148 |
0.004896 |
|
2000 |
25 |
0.01623 |
0.01460 |
0.000575 |
0.01379 |
0.000862 |
0.01298 |
0.001149 |
0.01217 |
0.001437 |
|
2000 |
50 |
0.03245 |
0.02921 |
0.001149 |
0.02758 |
0.001724 |
0.02596 |
0.002298 |
0.02434 |
0.002873 |
|
2000 |
75 |
0.04868 |
0.04381 |
0.001724 |
0.04138 |
0.002586 |
0.03894 |
0.003447 |
0.03651 |
0.004310 |
|
2000 |
100 |
0.06490 |
0.05841 |
0.002298 |
0.05517 |
0.003447 |
0.05192 |
0.004596 |
0.04868 |
0.005747 |
|
3000 |
25 |
0.01880 |
0.01692 |
0.000665 |
0.01598 |
0.000998 |
0.01504 |
0.001331 |
0.01410 |
0.001663 |
|
3000 |
50 |
0.03760 |
0.03384 |
0.001331 |
0.03196 |
0.001996 |
0.03008 |
0.002663 |
0.02820 |
0.003326 |
|
3000 |
75 |
0.05640 |
0.05076 |
0.001996 |
0.04794 |
0.002993 |
0.04512 |
0.003994 |
0.04230 |
0.004992 |
|
3000 |
100 |
0.07520 |
0.06768 |
0.002663 |
0.06392 |
0.003994 |
0.06016 |
0.005325 |
0.05640 |
0.006656 |
|
4000 |
25 |
0.02302 |
0.02072 |
0.000816 |
0.01957 |
0.001224 |
0.01842 |
0.001632 |
0.01726 |
0.002040 |
|
4000 |
50 |
0.04605 |
0.04144 |
0.001632 |
0.03914 |
0.002448 |
0.03684 |
0.003263 |
0.03454 |
0.004079 |
|
4000 |
75 |
0.06908 |
0.06217 |
0.002448 |
0.05872 |
0.003672 |
0.05526 |
0.004895 |
0.05181 |
0.006119 |
|
4000 |
100 |
0.09210 |
0.08289 |
0.003263 |
0.07829 |
0.004895 |
0.07368 |
0.006526 |
0.06908 |
0.008158 |
Table A2. Summary of operating cases and corresponding engine performance and thermal parameters
|
Case ID |
Brake Power kW |
Fuel Mass Flow kg/s |
BSFC g/kWh |
Air Mass Flow kg/s |
Exhaust T) K ( |
Exhaust p) bar ( |
Heat Coolant kW |
Mechanical Loss kW |
Coolant T) K ( |
Oil T (K ( |
Wall T) K ( |
|
1000_25%L_0H |
1.23 |
0.000115 |
337.3 |
0.00646 |
450.7 |
1.04 |
1.34 |
0.51 |
371.22 |
393 |
422.2 |
|
1000_25%L_10%H |
1.03 |
0.000108 |
374.8 |
0.00646 |
439.6 |
1.04 |
1.20 |
0.50 |
370.91 |
393 |
419.6 |
|
1000_25%L_15%H |
0.94 |
0.000104 |
399.2 |
0.00647 |
433.8 |
1.04 |
1.13 |
0.50 |
370.44 |
393 |
418.4 |
|
1000_25%L_20%H |
0.85 |
0.000100 |
426.1 |
0.00647 |
429.6 |
1.04 |
1.06 |
0.50 |
370.25 |
393 |
417.0 |
|
1000_25%L_25%H |
0.74 |
0.000097 |
469.7 |
0.00647 |
422.7 |
1.04 |
0.99 |
0.49 |
369.89 |
393 |
415.8 |
|
1000_50%L_0H |
3.11 |
0.000230 |
266.8 |
0.00646 |
573.8 |
1.04 |
2.59 |
0.56 |
376.53 |
393 |
442.6 |
|
1000_50%L_10%H |
2.74 |
0.000216 |
283.0 |
0.00646 |
545.0 |
1.04 |
2.40 |
0.56 |
375.97 |
393 |
440.1 |
|
1000_50%L_15%H |
2.55 |
0.000208 |
293.7 |
0.00645 |
532.1 |
1.04 |
2.29 |
0.55 |
375.5 |
393 |
438.5 |
|
1000_50%L_20%H |
2.37 |
0.000201 |
305.4 |
0.00646 |
519.9 |
1.04 |
2.16 |
0.55 |
375.09 |
393 |
436.5 |
|
1000_50%L_25%H |
2.17 |
0.000193 |
320.6 |
0.00645 |
507.7 |
1.04 |
2.05 |
0.54 |
374.5 |
393 |
434.7 |
|
1000_75%L_0H |
4.61 |
0.000346 |
269.9 |
0.00648 |
722.0 |
1.04 |
3.55 |
0.60 |
379.83 |
393 |
455.2 |
|
1000_75%L_10%H |
4.23 |
0.000323 |
275.4 |
0.00647 |
670.9 |
1.04 |
3.33 |
0.59 |
378.87 |
393 |
453.0 |
|
1000_75%L_15%H |
4.00 |
0.000312 |
280.6 |
0.00647 |
649.5 |
1.04 |
3.18 |
0.59 |
378.35 |
393 |
451.1 |
|
1000_75%L_20%H |
3.78 |
0.000301 |
287.0 |
0.00646 |
627.2 |
1.04 |
3.03 |
0.58 |
377.99 |
393 |
449.1 |
|
1000_75%L_25%H |
3.52 |
0.000290 |
296.0 |
0.00646 |
604.8 |
1.04 |
2.89 |
0.58 |
377.61 |
393 |
447.4 |
|
1000_100%L_0H |
5.31 |
0.000461 |
312.7 |
0.00646 |
808.0 |
1.04 |
3.98 |
0.61 |
380.15 |
393 |
460.0 |
|
1000_100%L_10%H |
5.17 |
0.000431 |
300.3 |
0.00646 |
790.1 |
1.04 |
3.94 |
0.61 |
380.87 |
393 |
459.9 |
|
1000_100%L_15%H |
5.01 |
0.000416 |
298.9 |
0.00647 |
772.0 |
1.04 |
3.83 |
0.61 |
380.54 |
393 |
458.5 |
|
1000_100%L_20%H |
4.83 |
0.000401 |
299.0 |
0.00647 |
748.8 |
1.04 |
3.71 |
0.60 |
379.71 |
393 |
457.3 |
|
1000_100%L_25%H |
4.61 |
0.000386 |
301.8 |
0.00647 |
722.0 |
1.04 |
3.55 |
0.60 |
379.79 |
393 |
455.2 |
|
2000_25%L_0H |
3.46 |
0.000271 |
281.6 |
0.01315 |
507.3 |
1.04 |
2.09 |
1.44 |
375.19 |
393 |
434.0 |
|
2000_25%L_10%H |
2.94 |
0.000253 |
310.0 |
0.01316 |
490.5 |
1.04 |
1.87 |
1.43 |
374.02 |
393 |
430.7 |
|
2000_25%L_15%H |
2.68 |
0.000244 |
328.3 |
0.01316 |
482.2 |
1.04 |
1.77 |
1.42 |
373.57 |
393 |
429.1 |
|
2000_25%L_20%H |
2.42 |
0.000235 |
350.9 |
0.01316 |
474.8 |
1.04 |
1.67 |
1.41 |
372.99 |
393 |
427.5 |
|
2000_25%L_25%H |
2.14 |
0.000227 |
380.8 |
0.01316 |
466.2 |
1.04 |
1.57 |
1.40 |
372.62 |
393 |
425.9 |
|
2000_50%L_0H |
8.19 |
0.000541 |
237.8 |
0.01312 |
687.0 |
1.04 |
4.02 |
1.57 |
380.75 |
393 |
461.2 |
|
2000_50%L_10%H |
7.38 |
0.000506 |
246.8 |
0.01313 |
646.3 |
1.04 |
3.70 |
1.55 |
379.96 |
393 |
457.5 |
|
2000_50%L_15%H |
6.93 |
0.000488 |
253.7 |
0.01313 |
627.6 |
1.04 |
3.52 |
1.54 |
379.46 |
393 |
455.3 |
|
2000_50%L_20%H |
6.47 |
0.000471 |
262.3 |
0.01314 |
609.6 |
1.04 |
3.33 |
1.53 |
378.98 |
393 |
452.6 |
|
2000_50%L_25%H |
5.98 |
0.000454 |
272.8 |
0.01314 |
592.2 |
1.04 |
3.14 |
1.52 |
378.36 |
393 |
449.9 |
|
2000_75%L_0H |
11.01 |
0.000811 |
265.2 |
0.01304 |
871.1 |
1.04 |
5.44 |
1.64 |
384.3 |
393 |
477.3 |
|
2000_75%L_10%H |
10.48 |
0.000759 |
260.8 |
0.01306 |
830.3 |
1.04 |
5.13 |
1.62 |
383.52 |
393 |
474.0 |
|
2000_75%L_15%H |
10.05 |
0.000733 |
262.4 |
0.01307 |
799.1 |
1.04 |
4.90 |
1.61 |
382.98 |
393 |
471.3 |
|
2000_75%L_20%H |
9.63 |
0.000706 |
264.0 |
0.01308 |
765.9 |
1.04 |
4.69 |
1.60 |
382.45 |
393 |
469.2 |
|
2000_75%L_25%H |
9.13 |
0.000680 |
268.3 |
0.0131 |
735.2 |
1.04 |
4.44 |
1.59 |
381.8 |
393 |
466.3 |
|
2000_100%L_0H |
11.23 |
0.001082 |
346.8 |
0.01305 |
900.4 |
1.04 |
5.52 |
1.64 |
384.43 |
393 |
476.8 |
|
2000_100%L_10%H |
11.39 |
0.001012 |
319.7 |
0.01304 |
900.4 |
1.04 |
5.63 |
1.64 |
384.52 |
393 |
479.0 |
|
2000_100%L_15%H |
11.41 |
0.000977 |
308.2 |
0.01303 |
901.2 |
1.04 |
5.66 |
1.65 |
384.25 |
393 |
479.9 |
|
2000_100%L_20%H |
11.28 |
0.000942 |
300.6 |
0.01304 |
891.4 |
1.04 |
5.59 |
1.64 |
384.56 |
393 |
478.9 |
|
2000_100%L_25%H |
11.01 |
0.000907 |
296.6 |
0.01304 |
871.5 |
1.04 |
5.44 |
1.64 |
384.24 |
393 |
477.3 |
|
3000_25%L_0H |
5.87 |
0.000470 |
288.2 |
0.01967 |
563.8 |
1.04 |
3.11 |
2.81 |
378.52 |
393 |
449.0 |
|
3000_25%L_10%H |
4.95 |
0.000440 |
319.8 |
0.01967 |
543.1 |
1.04 |
2.81 |
2.78 |
377.4 |
393 |
444.8 |
|
3000_25%L_15%H |
4.47 |
0.000424 |
341.6 |
0.01967 |
532.9 |
1.04 |
2.66 |
2.77 |
376.91 |
393 |
442.6 |
|
3000_25%L_20%H |
4.01 |
0.000409 |
367.7 |
0.01966 |
522.8 |
1.04 |
2.52 |
2.75 |
376.42 |
393 |
440.5 |
|
3000_25%L_25%H |
3.51 |
0.000394 |
404.0 |
0.01965 |
512.2 |
1.04 |
2.37 |
2.74 |
375.94 |
393 |
438.4 |
|
3000_50%L_0H |
13.49 |
0.000940 |
250.9 |
0.01969 |
800.0 |
1.04 |
5.65 |
2.99 |
384.66 |
393 |
479.0 |
|
3000_50%L_10%H |
12.31 |
0.000879 |
257.2 |
0.0197 |
748.4 |
1.04 |
5.19 |
2.96 |
383.52 |
393 |
474.4 |
|
3000_50%L_15%H |
16.52 |
0.000380 |
447.7 |
0.01964 |
502.4 |
1.04 |
2.23 |
2.72 |
375 |
393 |
436.5 |
|
3000_50%L_20%H |
10.90 |
0.000819 |
270.3 |
0.01971 |
700.5 |
1.04 |
4.69 |
2.93 |
382.43 |
393 |
468.7 |
|
3000_50%L_25%H |
10.15 |
0.000788 |
279.5 |
0.01971 |
677.1 |
1.04 |
4.44 |
2.91 |
381.92 |
393 |
465.7 |
|
3000_75%L_0H |
16.53 |
0.001410 |
307.1 |
0.01963 |
950.6 |
1.04 |
7.05 |
3.07 |
387.37 |
393 |
493.2 |
|
3000_75%L_10%H |
16.17 |
0.001319 |
293.7 |
0.01964 |
936.8 |
1.04 |
6.89 |
3.06 |
387.66 |
393 |
491.5 |
|
3000_75%L_15%H |
15.76 |
0.001273 |
290.9 |
0.01965 |
916.3 |
1.04 |
6.69 |
3.05 |
386.9 |
393 |
489.5 |
|
3000_75%L_20%H |
15.32 |
0.001228 |
288.6 |
0.01966 |
891.7 |
1.04 |
6.48 |
3.04 |
386.39 |
393 |
487.4 |
|
3000_75%L_25%H |
14.72 |
0.001182 |
289.1 |
0.01967 |
867.9 |
1.04 |
6.22 |
3.02 |
385.81 |
393 |
484.6 |
|
3000_100%L_0H |
15.91 |
0.001880 |
425.5 |
0.01966 |
944.3 |
1.04 |
6.76 |
3.05 |
386.66 |
393 |
487.7 |
|
3000_100%L_10%H |
16.17 |
0.001759 |
391.5 |
0.01964 |
946.7 |
1.04 |
6.88 |
3.06 |
386.91 |
393 |
489.9 |
|
3000_100%L_15%H |
16.28 |
0.001698 |
375.5 |
0.01964 |
948.1 |
1.04 |
6.93 |
3.06 |
387.02 |
393 |
490.8 |
|
3000_100%L_20%H |
16.38 |
0.001637 |
359.8 |
0.01963 |
949.4 |
1.04 |
6.99 |
3.06 |
387.17 |
393 |
491.9 |
|
3000_100%L_25%H |
16.53 |
0.001576 |
343.3 |
0.01963 |
950.4 |
1.04 |
7.05 |
3.07 |
387.35 |
393 |
493.2 |
|
4000_25%L_0H |
9.22 |
0.000767 |
299.7 |
0.02428 |
671.9 |
1.04 |
4.62 |
4.54 |
382.27 |
393 |
467.6 |
|
4000_25%L_10%H |
7.85 |
0.000718 |
329.1 |
0.02419 |
641.9 |
1.04 |
4.26 |
4.51 |
381.38 |
393 |
463.5 |
|
4000_25%L_15%H |
7.13 |
0.000693 |
349.8 |
0.02416 |
625.8 |
1.04 |
4.07 |
4.49 |
380.93 |
393 |
461.4 |
|
4000_25%L_20%H |
6.41 |
0.000668 |
375.6 |
0.02411 |
611.2 |
1.04 |
3.87 |
4.47 |
380.42 |
393 |
458.9 |
|
4000_25%L_25%H |
5.63 |
0.000643 |
411.4 |
0.02408 |
596.9 |
1.04 |
3.67 |
4.45 |
379.88 |
393 |
456.3 |
|
4000_50%L_0H |
18.29 |
0.001535 |
302.1 |
0.02457 |
972.7 |
1.04 |
7.81 |
4.76 |
389.54 |
393 |
499.0 |
|
4000_50%L_10%H |
17.27 |
0.001436 |
299.2 |
0.02456 |
929.8 |
1.04 |
7.37 |
4.74 |
388.11 |
393 |
495.2 |
|
4000_50%L_15%H |
16.62 |
0.001386 |
300.4 |
0.02455 |
909.9 |
1.04 |
7.14 |
4.72 |
387.57 |
393 |
492.9 |
|
4000_50%L_20%H |
15.85 |
0.001337 |
303.7 |
0.02454 |
873.5 |
1.04 |
6.80 |
4.70 |
386.92 |
393 |
489.8 |
|
4000_50%L_25%H |
14.95 |
0.001287 |
310.0 |
0.02452 |
838.5 |
1.04 |
6.45 |
4.68 |
386.23 |
393 |
486.5 |
|
4000_75%L_0H |
18.53 |
0.002303 |
447.5 |
0.02458 |
990.6 |
1.04 |
7.87 |
4.76 |
388.82 |
393 |
497.2 |
|
4000_75%L_10%H |
18.74 |
0.002154 |
413.8 |
0.02458 |
994.7 |
1.04 |
7.96 |
4.77 |
389.06 |
393 |
498.8 |
|
4000_75%L_15%H |
18.90 |
0.002080 |
396.2 |
0.02457 |
996.2 |
1.04 |
8.02 |
4.77 |
389.19 |
393 |
499.8 |
|
4000_75%L_20%H |
19.00 |
0.002005 |
379.9 |
0.02457 |
998.0 |
1.04 |
8.07 |
4.78 |
389.32 |
393 |
501.0 |
|
4000_75%L_25%H |
19.16 |
0.001931 |
362.8 |
0.02456 |
999.8 |
1.04 |
8.14 |
4.78 |
389.47 |
393 |
502.1 |
|
4000_100%L_0H |
17.26 |
0.003070 |
640.2 |
0.02461 |
980.7 |
1.04 |
7.52 |
4.72 |
387.27 |
393 |
491.0 |
|
4000_100%L_10%H |
17.73 |
0.002872 |
583.0 |
0.0246 |
985.6 |
1.04 |
7.65 |
4.73 |
387.72 |
393 |
493.2 |
|
4000_100%L_15%H |
18.05 |
0.002773 |
553.0 |
0.02459 |
986.7 |
1.04 |
7.73 |
4.74 |
388.53 |
393 |
494.6 |
|
4000_100%L_20%H |
18.22 |
0.002673 |
528.2 |
0.02459 |
989.3 |
1.04 |
7.79 |
4.75 |
388.66 |
393 |
495.6 |
|
4000_100%L_25%H |
18.53 |
0.002574 |
500.3 |
0.02458 |
990.6 |
1.04 |
7.87 |
4.76 |
388.81 |
393 |
497.2 |
* The case ID (Speed_Load_H₂) is used throughout this study. For example, 3000_100%L_20%H represents an engine speed of 3000 rpm, full-load operation (100% load), and a 20% hydrogen energy share.
* Qwall and Qoil are included in Qcoolant and thus reported as zero.
Table A3. Summary of thermal and exergy performance parameters for the investigated operating cases
|
Case ID |
$\eta_{B P, T h}$ (%) |
$\dot{\mathbf{E}} \mathbf{x}_{\text {fuel}}$ kW |
$\dot{\mathbf{E}} \mathbf{x}_{\text {work}}$ kW |
$\eta_{\mathrm{ex}}$ (%) |
$\dot{\mathbf{E}} \mathbf{x}_{\text {dest }}$ kW |
$\dot{\mathbf{E}} \mathbf{x}_{\mathrm{exh}}$ kW |
$\dot{E} \mathbf{x}_{\text {heat,loss }}$ kW |
$\dot{\mathbf{E}} \mathbf{x}_{\text {mech,loss}}$ kW |
m Diesel kg/s |
m H2 kg/s |
Fuel Energy kW |
Exergy Balance Error kW |
|
1000_25%L_0H |
25.12 |
5.192 |
1.2302 |
23.69 |
3.070 |
0.170 |
0.210 |
0.511 |
1.153E-04 |
0 |
4.898 |
0.00 |
|
1000_25%L_10%H |
21.14 |
5.160 |
1.0349 |
20.06 |
3.287 |
0.146 |
0.187 |
0.504 |
1.037E-04 |
4.082E-06 |
4.896 |
0.00 |
|
1000_25%L_15%H |
19.16 |
5.146 |
0.93815 |
18.23 |
3.398 |
0.135 |
0.175 |
0.500 |
9.792E-05 |
6.123E-06 |
4.896 |
0.00 |
|
1000_25%L_20%H |
17.31 |
5.132 |
0.84757 |
16.52 |
3.497 |
0.126 |
0.163 |
0.497 |
9.217E-05 |
8.164E-06 |
4.897 |
0.00 |
|
1000_25%L_25%H |
15.12 |
5.118 |
0.74058 |
14.47 |
3.618 |
0.113 |
0.153 |
0.493 |
8.642E-05 |
1.020E-05 |
4.897 |
0.00 |
|
1000_50%L_0H |
31.75 |
10.380 |
3.1092 |
29.95 |
5.747 |
0.523 |
0.436 |
0.565 |
2.304E-04 |
0 |
9.793 |
0.00 |
|
1000_50%L_10%H |
28.00 |
10.323 |
2.7422 |
26.56 |
6.194 |
0.429 |
0.401 |
0.557 |
2.074E-04 |
8.161E-06 |
9.794 |
0.00 |
|
1000_50%L_15%H |
26.05 |
10.291 |
2.5508 |
24.79 |
6.418 |
0.388 |
0.381 |
0.553 |
1.958E-04 |
1.224E-05 |
9.792 |
0.00 |
|
1000_50%L_20%H |
24.15 |
10.263 |
2.3654 |
23.05 |
6.639 |
0.352 |
0.358 |
0.548 |
1.843E-04 |
1.632E-05 |
9.793 |
0.00 |
|
1000_50%L_25%H |
22.16 |
10.234 |
2.1701 |
21.20 |
6.869 |
0.317 |
0.336 |
0.543 |
1.728E-04 |
2.040E-05 |
9.794 |
0.00 |
|
1000_75%L_0H |
31.38 |
15.572 |
4.6107 |
29.61 |
8.631 |
1.107 |
0.625 |
0.599 |
3.457E-04 |
0 |
14.691 |
0.00 |
|
1000_75%L_10%H |
28.77 |
15.483 |
4.2262 |
27.30 |
9.196 |
0.891 |
0.578 |
0.592 |
3.111E-04 |
1.224E-05 |
14.690 |
0.00 |
|
1000_75%L_15%H |
27.26 |
15.437 |
4.0042 |
25.94 |
9.491 |
0.806 |
0.549 |
0.587 |
2.938E-04 |
1.836E-05 |
14.688 |
0.00 |
|
1000_75%L_20%H |
25.70 |
15.394 |
3.7752 |
24.52 |
9.797 |
0.719 |
0.521 |
0.582 |
2.765E-04 |
2.448E-05 |
14.689 |
0.00 |
|
1000_75%L_25%H |
23.99 |
15.352 |
3.5249 |
22.96 |
10.120 |
0.636 |
0.495 |
0.577 |
2.593E-04 |
3.061E-05 |
14.691 |
0.00 |
|
1000_100%L_0H |
27.09 |
20.761 |
5.3062 |
25.56 |
12.632 |
1.508 |
0.703 |
0.612 |
4.608E-04 |
0 |
19.585 |
0.00 |
|
1000_100%L_10%H |
26.38 |
20.643 |
5.1674 |
25.03 |
12.743 |
1.420 |
0.702 |
0.611 |
4.148E-04 |
1.632E-05 |
19.585 |
0.00 |
|
1000_100%L_15%H |
25.60 |
20.586 |
5.0135 |
24.35 |
12.949 |
1.336 |
0.679 |
0.608 |
3.918E-04 |
2.448E-05 |
19.587 |
0.00 |
|
1000_100%L_20%H |
24.67 |
20.526 |
4.8311 |
23.54 |
13.209 |
1.230 |
0.651 |
0.604 |
3.687E-04 |
3.264E-05 |
19.585 |
0.00 |
|
1000_100%L_25%H |
23.53 |
20.469 |
4.6094 |
22.52 |
13.524 |
1.112 |
0.624 |
0.599 |
3.457E-04 |
4.080E-05 |
19.587 |
0.00 |
|
2000_25%L_0H |
30.08 |
12.186 |
3.458 |
28.38 |
6.301 |
0.637 |
0.346 |
1.444 |
2.705E-04 |
0 |
11.496 |
0.00 |
|
2000_25%L_10%H |
25.56 |
12.112 |
2.9368 |
24.25 |
6.897 |
0.545 |
0.306 |
1.428 |
2.433E-04 |
9.580E-06 |
11.491 |
0.00 |
|
2000_25%L_15%H |
23.30 |
12.078 |
2.6778 |
22.17 |
7.194 |
0.500 |
0.287 |
1.419 |
2.298E-04 |
1.437E-05 |
11.492 |
0.00 |
|
2000_25%L_20%H |
21.02 |
12.045 |
2.4163 |
20.06 |
7.487 |
0.463 |
0.268 |
1.411 |
2.163E-04 |
1.916E-05 |
11.493 |
0.00 |
|
2000_25%L_25%H |
18.65 |
12.012 |
2.1438 |
17.85 |
7.795 |
0.420 |
0.250 |
1.403 |
2.028E-04 |
2.395E-05 |
11.494 |
0.00 |
|
2000_50%L_0H |
35.62 |
24.365 |
8.187 |
33.60 |
11.972 |
1.923 |
0.715 |
1.567 |
5.408E-04 |
0 |
22.985 |
0.00 |
|
2000_50%L_10%H |
32.10 |
24.230 |
7.3797 |
30.46 |
13.054 |
1.596 |
0.651 |
1.550 |
4.868E-04 |
1.915E-05 |
22.989 |
0.00 |
|
2000_50%L_15%H |
30.15 |
24.156 |
6.9303 |
28.69 |
13.618 |
1.451 |
0.617 |
1.540 |
4.597E-04 |
2.873E-05 |
22.984 |
0.00 |
|
2000_50%L_20%H |
28.13 |
24.089 |
6.4652 |
26.84 |
14.200 |
1.317 |
0.579 |
1.528 |
4.327E-04 |
3.83E-05 |
22.985 |
0.00 |
|
2000_50%L_25%H |
26.04 |
24.022 |
5.9849 |
24.91 |
14.789 |
1.190 |
0.542 |
1.515 |
4.057E-04 |
4.789E-05 |
22.987 |
0.00 |
|
2000_75%L_0H |
31.94 |
36.551 |
11.012 |
30.13 |
19.271 |
3.622 |
1.009 |
1.636 |
8.113E-04 |
0 |
34.482 |
0.00 |
|
2000_75%L_10%H |
30.39 |
36.342 |
10.477 |
28.83 |
20.078 |
3.222 |
0.943 |
1.622 |
7.302E-04 |
2.873E-05 |
34.480 |
0.00 |
|
2000_75%L_15%H |
29.15 |
36.242 |
10.052 |
27.74 |
20.756 |
2.927 |
0.896 |
1.612 |
6.897E-04 |
4.310E-05 |
34.483 |
0.00 |
|
2000_75%L_20%H |
27.94 |
36.134 |
9.6326 |
26.66 |
21.426 |
2.621 |
0.852 |
1.603 |
6.490E-04 |
5.747E-05 |
34.479 |
0.00 |
|
2000_75%L_25%H |
26.48 |
36.033 |
9.1301 |
25.34 |
22.165 |
2.348 |
0.800 |
1.590 |
6.085E-04 |
7.184E-05 |
34.482 |
0.00 |
|
2000_100%L_0H |
24.42 |
48.729 |
11.228 |
23.04 |
30.848 |
3.990 |
1.025 |
1.638 |
1.082E-03 |
0 |
45.971 |
0.00 |
|
2000_100%L_10%H |
24.78 |
48.453 |
11.392 |
23.51 |
30.403 |
3.967 |
1.046 |
1.645 |
9.735E-04 |
3.830E-05 |
45.971 |
0.00 |
|
2000_100%L_15%H |
24.82 |
48.319 |
11.413 |
23.62 |
30.247 |
3.962 |
1.050 |
1.646 |
9.195E-04 |
5.746E-05 |
45.974 |
0.00 |
|
2000_100%L_20%H |
24.54 |
48.177 |
11.279 |
23.41 |
30.358 |
3.858 |
1.040 |
1.643 |
8.653E-04 |
7.662E-05 |
45.971 |
0.00 |
|
2000_100%L_25%H |
23.95 |
48.043 |
11.009 |
22.91 |
30.739 |
3.651 |
1.008 |
1.636 |
8.113E-04 |
9.577E-05 |
45.974 |
0.00 |
|
3000_25%L_0H |
29.39 |
21.174 |
5.8709 |
27.73 |
10.482 |
1.476 |
0.539 |
2.807 |
4.700E-04 |
0 |
19.979 |
0.00 |
|
3000_25%L_10%H |
24.78 |
21.054 |
4.9492 |
23.51 |
11.571 |
1.274 |
0.480 |
2.779 |
4.230E-04 |
1.665E-05 |
18.688 |
0.00 |
|
3000_25%L_15%H |
22.40 |
20.994 |
4.4735 |
21.31 |
12.125 |
1.179 |
0.452 |
2.765 |
3.995E-04 |
2.497E-05 |
18.043 |
0.00 |
|
3000_25%L_20%H |
20.06 |
20.934 |
4.0069 |
19.14 |
12.665 |
1.087 |
0.424 |
2.751 |
3.760E-04 |
3.329E-05 |
17.398 |
0.00 |
|
3000_25%L_25%H |
17.58 |
20.874 |
3.5123 |
16.83 |
13.235 |
0.993 |
0.397 |
2.737 |
3.525E-04 |
4.161E-05 |
16.753 |
0.00 |
|
3000_50%L_0H |
33.76 |
42.347 |
13.488 |
31.85 |
20.429 |
4.386 |
1.053 |
2.991 |
9.400E-04 |
0 |
39.965 |
0.00 |
|
3000_50%L_10%H |
30.80 |
42.107 |
12.305 |
29.22 |
22.204 |
3.680 |
0.955 |
2.964 |
8.460E-04 |
3.329E-05 |
37.384 |
0.00 |
|
3000_50%L_15%H |
15.26 |
20.859 |
3.0548 |
14.64 |
13.803 |
0.909 |
0.369 |
2.722 |
3.300E-04 |
4.994E-05 |
16.153 |
0.00 |
|
3000_50%L_20%H |
27.29 |
41.868 |
10.904 |
26.04 |
24.125 |
3.056 |
0.852 |
2.930 |
7.520E-04 |
6.658E-05 |
34.803 |
0.00 |
|
3000_50%L_25%H |
25.41 |
41.748 |
10.152 |
24.32 |
25.120 |
2.763 |
0.801 |
2.912 |
7.050E-04 |
8.323E-05 |
33.512 |
0.00 |
|
3000_75%L_0H |
27.58 |
63.521 |
16.527 |
26.02 |
35.860 |
6.708 |
1.354 |
3.071 |
1.410E-03 |
0 |
59.959 |
0.00 |
|
3000_75%L_10%H |
26.98 |
63.161 |
16.169 |
25.60 |
36.134 |
6.470 |
1.327 |
3.060 |
1.269E-03 |
4.994E-05 |
56.086 |
0.00 |
|
3000_75%L_15%H |
26.30 |
62.981 |
15.76 |
25.02 |
36.746 |
6.148 |
1.278 |
3.049 |
1.199E-03 |
7.491E-05 |
54.150 |
0.00 |
|
3000_75%L_20%H |
25.56 |
62.801 |
15.319 |
24.39 |
37.448 |
5.767 |
1.230 |
3.037 |
1.128E-03 |
0.0000999 |
52.214 |
0.00 |
|
3000_75%L_25%H |
24.57 |
62.622 |
14.723 |
23.51 |
38.296 |
5.406 |
1.175 |
3.022 |
1.058E-03 |
0.0001248 |
50.278 |
0.00 |
|
3000_100%L_0H |
19.91 |
84.694 |
15.907 |
18.78 |
57.684 |
6.768 |
1.289 |
3.046 |
1.880E-03 |
0 |
79.960 |
0.00 |
|
3000_100%L_10%H |
20.24 |
84.215 |
16.169 |
19.20 |
56.913 |
6.762 |
1.314 |
3.056 |
1.692E-03 |
6.658E-05 |
74.796 |
0.00 |
|
3000_100%L_15%H |
20.37 |
83.975 |
16.276 |
19.38 |
56.549 |
6.765 |
1.325 |
3.060 |
1.598E-03 |
0.0000999 |
72.214 |
0.00 |
|
3000_100%L_20%H |
20.50 |
83.735 |
16.382 |
19.56 |
56.188 |
6.762 |
1.338 |
3.065 |
1.504E-03 |
0.0001331 |
69.632 |
0.00 |
|
3000_100%L_25%H |
20.69 |
83.496 |
16.531 |
19.80 |
55.782 |
6.759 |
1.354 |
3.071 |
1.410E-03 |
0.0001664 |
67.050 |
0.00 |
|
4000_25%L_0H |
28.26 |
34.568 |
9.2161 |
26.66 |
16.672 |
3.301 |
0.837 |
4.542 |
7.673E-04 |
0 |
32.619 |
0.00 |
|
4000_25%L_10%H |
24.08 |
34.376 |
7.8524 |
22.84 |
18.399 |
2.851 |
0.763 |
4.510 |
6.907E-04 |
2.718E-05 |
30.515 |
0.00 |
|
4000_25%L_15%H |
21.87 |
34.279 |
7.1321 |
20.81 |
19.306 |
2.622 |
0.725 |
4.494 |
6.523E-04 |
4.076E-05 |
29.463 |
0.00 |
|
4000_25%L_20%H |
19.64 |
34.183 |
6.4052 |
18.74 |
20.201 |
2.418 |
0.685 |
4.474 |
6.140E-04 |
5.435E-05 |
28.412 |
0.00 |
|
4000_25%L_25%H |
17.27 |
34.072 |
5.6292 |
16.52 |
21.117 |
2.226 |
0.645 |
4.454 |
5.753E-04 |
6.794E-05 |
27.345 |
0.00 |
|
4000_50%L_0H |
28.04 |
69.152 |
18.292 |
26.45 |
35.810 |
8.753 |
1.535 |
4.762 |
1.535E-03 |
0 |
65.268 |
0.00 |
|
4000_50%L_10%H |
26.48 |
68.753 |
17.272 |
25.12 |
37.425 |
7.892 |
1.427 |
4.737 |
1.381E-03 |
5.436E-05 |
61.045 |
0.00 |
|
4000_50%L_15%H |
25.47 |
68.561 |
16.615 |
24.23 |
38.351 |
7.500 |
1.374 |
4.720 |
1.305E-03 |
8.155E-05 |
58.941 |
0.00 |
|
4000_50%L_20%H |
24.29 |
68.369 |
15.847 |
23.18 |
39.711 |
6.810 |
1.300 |
4.701 |
1.228E-03 |
0.0001087 |
56.837 |
0.00 |
|
4000_50%L_25%H |
22.91 |
68.177 |
14.948 |
21.93 |
41.164 |
6.162 |
1.224 |
4.679 |
1.151E-03 |
0.0001359 |
54.733 |
0.00 |
|
4000_75%L_0H |
18.93 |
103.735 |
18.526 |
17.86 |
69.541 |
9.374 |
1.536 |
4.758 |
2.303E-03 |
0 |
97.931 |
0.00 |
|
4000_75%L_10%H |
19.15 |
103.145 |
18.738 |
18.17 |
68.680 |
9.404 |
1.556 |
4.766 |
2.072E-03 |
8.155E-05 |
91.603 |
0.00 |
|
4000_75%L_15%H |
19.31 |
102.857 |
18.898 |
18.37 |
68.212 |
9.405 |
1.570 |
4.772 |
1.957E-03 |
0.0001223 |
88.447 |
0.00 |
|
4000_75%L_20%H |
19.42 |
102.555 |
19.003 |
18.53 |
67.776 |
9.414 |
1.583 |
4.779 |
1.842E-03 |
0.0001631 |
85.276 |
0.00 |
|
4000_75%L_25%H |
19.58 |
102.267 |
19.158 |
18.73 |
67.307 |
9.421 |
1.597 |
4.785 |
1.727E-03 |
0.0002039 |
82.119 |
0.00 |
|
4000_100%L_0H |
13.23 |
138.304 |
17.264 |
12.48 |
105.434 |
9.445 |
1.443 |
4.718 |
3.070E-03 |
0 |
130.595 |
0.00 |
|
4000_100%L_10%H |
13.59 |
137.521 |
17.733 |
12.89 |
104.107 |
9.475 |
1.474 |
4.732 |
2.763E-03 |
0.0001087 |
122.161 |
0.00 |
|
4000_100%L_15%H |
13.83 |
137.137 |
18.052 |
13.16 |
103.379 |
9.460 |
1.503 |
4.742 |
2.610E-03 |
0.0001631 |
117.951 |
0.00 |
|
4000_100%L_20%H |
13.96 |
136.738 |
18.22 |
13.32 |
102.774 |
9.479 |
1.517 |
4.748 |
2.456E-03 |
0.0002175 |
113.727 |
0.00 |
|
4000_100%L_25%H |
14.20 |
136.354 |
18.527 |
13.59 |
102.066 |
9.468 |
1.535 |
4.758 |
2.303E-03 |
0.0002718 |
109.517 |
0.00 |
[1] Prabhukumar, G., Nagalingam, B., Gopalakrishnan, K. (1985). Theoretical studies of a spark-ignited supercharged hydrogen engine. International Journal of Hydrogen Energy, 10(6): 389-397. https://doi.org/10.1016/0360-3199(85)90065-5
[2] Rakopoulos, C., Kyritsis, D. (2005). Hydrogen enrichment effects on the second law analysis of natural and landfill gas combustion in engine cylinders. International Journal of Hydrogen Energy, 31(10): 1384-1393. https://doi.org/10.1016/j.ijhydene.2005.11.002
[3] Guo, H., Hosseini, V., Neill, W.S., Chippior, W.L., Dumitrescu, C.E. (2011). An experimental study on the effect of hydrogen enrichment on diesel fueled HCCI combustion. International Journal of Hydrogen Energy, 36(21): 13820-13830. https://doi.org/10.1016/j.ijhydene.2011.07.143
[4] Das, L. (2002). Hydrogen engine: Research and development (R&D) programmes in Indian Institute of Technology (IIT), Delhi. International Journal of Hydrogen Energy, 27(9): 953-965. https://doi.org/10.1016/s0360-3199(01)00178-1
[5] Masood, M., Ishrat, M., Reddy, A. (2007). Computational combustion and emission analysis of hydrogen–diesel blends with experimental verification. International Journal of Hydrogen Energy, 32(13): 2539-2547. https://doi.org/10.1016/j.ijhydene.2006.11.008
[6] Akhtar, M.U.S., Asfand, F., Mishamandani, A.S., Mishra, R., Khan, M.I. (2025). Hydrogen as a sustainable combustion fuel: Performance, challenges, and pathways for transition to low-carbon propulsion systems. Renewable and Sustainable Energy Reviews, 223: 116004. https://doi.org/10.1016/j.rser.2025.116004
[7] Shi, C., Ji, C., Ge, Y., Wang, S., Wang, H., Yang, J. (2020). Parametric analysis of hydrogen two-stage direct-injection on combustion characteristics, knock propensity, and emissions formation in a rotary engine. Fuel, 287: 119418. https://doi.org/10.1016/j.fuel.2020.119418
[8] Kumar, M., Paul, A. (2023). Comparative evaluation of combustion, performance, exergy and emission characteristics in hydrogen-biodiesel dual fuel engine under RCCI mode. Energy & Environment, 35(7): 3418-3440. https://doi.org/10.1177/0958305x231167467
[9] Pourdarbani, R., Ardabili, S., Akbarpouran, E., Hernandez-Hernandez, J.L. (2022). Exergo-environmental optimization of a diesel engine. Acta Technologica Agriculturae, 25(3): 157-168. https://doi.org/10.2478/ata-2022-0024
[10] Zhang, S.W., Sun, B.G., Luo, Q.H., Bao, L.Z. (2024). Experimental evaluation of pre-ignition and multi-objective optimal controlling of turbocharged direct injection hydrogen engines under high-load and high-speed conditions using Taguchi and TOPSIS methods. Energy Conversion and Management, 325: 119378. https://doi.org/10.1016/j.enconman.2024.119378
[11] Das, A.K., Hansdah, D., Panda, A.K. (2021). Thermal balancing and exergetic performance evaluation of a compression ignition engine fuelled with waste plastic pyrolytic oil and different fuel additives. Energy, 229: 120629. https://doi.org/10.1016/j.energy.2021.120629
[12] Narayanan, A., Hariharan, D., Partridge, K.R., Pearson, A.L., Srinivasan, K.K., Krishnan, S.R. (2023). Impact of low reactivity fuel type and energy substitution on dual fuel combustion at different injection timings. Energies, 16(4): 1807. https://doi.org/10.3390/en16041807
[13] Liu, X., Seberry, G., Kook, S., Chan, Q.N., Hawkes, E.R. (2022). Direct injection of hydrogen main fuel and diesel pilot fuel in a retrofitted single-cylinder compression ignition engine. International Journal of Hydrogen Energy, 47(84): 35864-35876. https://doi.org/10.1016/j.ijhydene.2022.08.149
[14] Krishnamoorthi, M., Malayalamurthi, R. (2017). Experimental investigation on performance, emission behavior and exergy analysis of a variable compression ratio engine fueled with diesel–aegle marmelos oil–diethyl ether blends. Energy, 128: 312-328. https://doi.org/10.1016/j.energy.2017.04.038
[15] Stępień, Z. (2021). A comprehensive overview of hydrogen-fueled internal combustion engines: Achievements and future challenges. Energies, 14(20): 6504. https://doi.org/10.3390/en14206504
[16] Chintala, V., Subramanian, K.A. (2014). Assessment of maximum available work of a hydrogen fueled compression ignition engine using exergy analysis. Energy, 67: 162-175. https://doi.org/10.1016/j.energy.2014.01.094
[17] Mohammadi, A., Shioji, M., Nakai, Y., Ishikura, W., Tabo, E. (2006). Performance and combustion characteristics of a direct injection SI hydrogen engine. International Journal of Hydrogen Energy, 32(2): 296-304. https://doi.org/10.1016/j.ijhydene.2006.06.005
[18] Bayramoğlu, K., Bayramoğlu, T., Polat, F., Sarıdemir, S., Alçelik, N., Ağbulut, Ü. (2024). Energy, exergy, and emission (3E) analysis of hydrogen-enriched waste biodiesel–diesel fuel blends on an indirect injection dual-fuel CI engine. Energy, 314: 134124. https://doi.org/10.1016/j.energy.2024.134124
[19] Li, Y., Jia, M., Chang, Y., Kokjohn, S.L., Reitz, R.D. (2016). Thermodynamic energy and exergy analysis of three different engine combustion regimes. Applied Energy, 180: 849-858. https://doi.org/10.1016/j.apenergy.2016.08.038
[20] Rakopoulos, D.C., Rakopoulos, C.D., Kosmadakis, G.M., Giakoumis, E.G., Kyritsis, D.C. (2024). Exergy analysis in highly hydrogen-enriched methane fueled spark-ignition engine at diverse equivalence ratios via two-zone quasi-dimensional modeling. Energies, 17(16): 3964. https://doi.org/10.3390/en17163964
[21] Taghavifar, H., Anvari, S. (2019). Optimization of a DI diesel engine to reduce emission and boost power by exergy and NLPQL method. Environmental Progress & Sustainable Energy, 39(2): e13338. https://doi.org/10.1002/ep.13338
[22] Singh, K., Dwivedi, G., Verma, T.N., Shukla, A.K. (2024). Energy, exergy, emissions and sustainability assessment of hydrogen supplemented diesel dual-fuel turbocharged common rail direct injection diesel engine. International Journal of Hydrogen Energy, 104: 378-392. https://doi.org/10.1016/j.ijhydene.2024.05.080
[23] Mohammed, H.N., Imran, M.S., Kurji, H.J. (2024). Energy and exergy analysis of thermoelectric generator installed on diesel engine exhaust heat recovery system. International Journal of Heat and Technology, 42(6): 2067-2074. https://doi.org/10.18280/ijht.420624
[24] Akroot, A., Hasan, H.A., Bdaiwi, M. (2024). Impact of eucalyptus biodiesel and nanoparticle additives on diesel engine performance. International Journal of Heat and Technology, 42(3): 755-764. https://doi.org/10.18280/ijht.420305
[25] Alipour, M., Ehghaghi, M.B., Mirsalim, M., Ranjbar, F. (2020). Energy and exergy analysis of the dual-fuel RCCI engine by ozone-assisted combustion of a lean mixture. Journal of Thermal Analysis and Calorimetry, 143(5): 3677-3686. https://doi.org/10.1007/s10973-020-09261-2
[26] Glasson, N., Green, R. (1994). Performance of a spark-ignition engine fuelled with hydrogen using a high-pressure injector. International Journal of Hydrogen Energy, 19(11): 917-923. https://doi.org/10.1016/0360-3199(94)90046-9
[27] Manavalla, S., Chaudhary, A., Panchal, S.H., Ismail, S., Khan, T.M.Y., Javed, S., Ali, M.A. (2022). Exergy analysis of a CI engine operating on ternary biodiesel blends. Sustainability, 14(19): 12350. https://doi.org/10.3390/su141912350
[28] Kul, B.S., Kahraman, A. (2016). Energy and exergy analyses of a diesel engine fuelled with biodiesel–diesel blends containing 5% bioethanol. Entropy, 18(11): 387. https://doi.org/10.3390/e18110387
[29] Verma, S., Das, L.M., Bhatti, S.S., Kaushik, S.C. (2017). A comparative exergetic performance and emission analysis of pilot diesel dual-fuel engine with biogas, CNG and hydrogen as main fuels. Energy Conversion and Management, 151: 764-777. https://doi.org/10.1016/j.enconman.2017.09.035
[30] Struchtrup, H. (2024). Thermodynamics and Energy Conversion, 2nd ed. Springer. https://doi.org/10.1007/978-3-031-60556-7
[31] Şanli, B.G., Uludamar, E. (2019). Energy and exergy analysis of a diesel engine fuelled with diesel and biodiesel fuels at various engine speeds. Energy Sources Part A: Recovery, Utilization and Environmental Effects, 42(11): 1299-1313. https://doi.org/10.1080/15567036.2019.1635229
[32] Bayramoğlu, K., Yilmaz, S., Nuran, M. (2022). Energy and exergy analyses of hydrogen addition in a diesel engine. International Journal of Exergy, 37(4): 377-392. https://doi.org/10.1504/IJEX.2022.122076