Muhammad Syaifur Rohman*![]() | Galuh Wilujeng Saraswati
| Galuh Wilujeng Saraswati![]() | Guruh Fajar Shidik
| Guruh Fajar Shidik![]() | Pulung Nurtantio Andono
| Pulung Nurtantio Andono![]() | Ricardus Anggi Pramunendar
| Ricardus Anggi Pramunendar![]() | Ashraf Alomoush
| Ashraf Alomoush![]() | Filmada Ocky Saputra
| Filmada Ocky Saputra![]() | Danny Oka Ratmana
| Danny Oka Ratmana![]()
© 2025 The authors. This article is published by IIETA and is licensed under the CC BY 4.0 license (http://creativecommons.org/licenses/by/4.0/).
OPEN ACCESS
The 2018 earthquake and tsunami in Palu, Indonesia, highlighted critical inefficiencies in disaster relief distribution, including suboptimal resource allocation and delivery delays that significantly impact survival rates. This research develops a Mixed-Integer Linear Programming (MILP) model integrated with Geographic Information System (GIS) data to optimize post-disaster logistics distribution in Palu, Indonesia, aiming to minimize total distance and delivery time while ensuring adequate distribution to relief posts. The methodology incorporates geospatial data from 22 relief posts and 2 main warehouses using the PuLP library in Python. Data preprocessing included coordinate conversion, GeoDataFrame creation, and logistics demand calculation based on refugee populations. The optimization model minimizes the objective function Z = Σᵢ∈ₚΣⱼ∈ₚ dᵢⱼxᵢⱼ subject to demand satisfaction and vehicle capacity constraints. Results demonstrate significant operational efficiency improvements, achieving a 30% reduction in average delivery time and identifying 366 optimized distribution routes ranging from 0.87 km to 15.9 km. The model successfully allocated various logistics types including food, water, clothing, and medical supplies while respecting 20,000 kg vehicle capacity constraints. The integration of MILP with GIS data proves effective for disaster relief logistics optimization, enabling precise decision-making in emergency situations. This framework reduces failure risks in disaster response and improves recovery outcomes for affected communities, with implications for enhanced disaster management strategies.
MILP, Geographic Information System (GIS), logistics distribution optimization, disaster management, disaster logistics
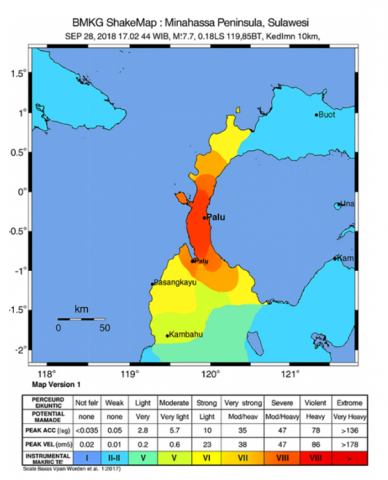
When natural disasters strike, the impacts are often not only physical, but also affect the social and economic aspects of the affected communities [1]. Indonesia has a history of quite a lot of natural disasters, especially earthquakes [2]. Based on data from the last 30 years, the number of economic losses reached 930 m USD and more than 200,000 disaster losses. Like the earthquake and tsunami that occurred in Palu, Indonesia, in 2018 with a magnitude scale of 7.7 and damage between the IV-VI MMI [3] at coordinates 0.18 South Latitude and 119.85 East Longitude with a depth of 10 km shown in Figure 1. As a result of this incident, the death toll in Palu City was 1,703 people, Donggala 171 people, Sigi 366 people and Parigi Moutong 15 people [4] leaving important lessons about the importance of effective disaster management [5]. This incident shows how important it is to have a disaster management system that is not only fast and responsive but also strategic and well organized [6]. In dealing with emergency situations like this, the distribution of aid quickly and on target [7] is one of the critical factors that can determine the level of success of recovery efforts [8]. However, this distribution process is often faced with various challenges, ranging from limited access to affected locations, infrastructure damage, to other logistical obstacles [9]. Therefore, a route planning strategy is needed that is not only efficient but also able to overcome these obstacles [10].
Strategic planning in disaster management plays an important role in minimizing the impacts. This includes aspects of efficiency and speed in distributing aid to areas that need it most [11]. In this context, the use of Mixed-Integer Linear Programming (MILP) models offers a mathematical solution that can optimize resource allocation and aid distribution routes [12, 13]. This model allows more precise and measurable decision making [14], which is very much needed in post-disaster emergency situations. In addition, the integration of Geographic Information System (GIS) data into MILP models enriches the analysis by incorporating geospatial variables into planning [15]. Accurate and up-to-date GIS data can provide in-depth information about geographic conditions, including road accessibility, severely affected areas, and the distribution of affected populations [16]. This combination of MILP and GIS data opens up new opportunities in developing aid distribution strategies that are not only efficient but also responsive to dynamic field conditions [17].
Figure 1. Earthquake epicenter map
Source: BMKG Indonesia
However, the use of advanced technologies and models such as MILP and GIS in the context of disaster management still faces challenges, including the availability of accurate data and a deep understanding of disaster dynamics. The natural disaster in Palu provides a rich case study for analyzing and testing these models. The data generated from the Palu disaster event is very valuable for validating the effectiveness of the proposed strategic planning model, as well as correcting existing weaknesses. Developing a strategic route planning model for distributing disaster aid that utilizes MILP and GIS is therefore important. This research not only contributes to academic literature but also to real disaster management practices. By identifying the most effective aid distribution routes, this research has the potential to save more lives and speed up the recovery process for communities affected by disasters. Furthermore, it is hoped that this research can become a foundation for the development of a more resilient and adaptive disaster management system. By understanding the strengths and limitations of MILP models integrated with GIS data, policymakers and disaster management practitioners can design better strategies for dealing with future disasters. This research offers guidance on how technology and mathematical approaches can be used to improve disaster preparedness and response.
Natural disasters, such as those that occurred in Palu, Indonesia, in 2018, highlight society's vulnerability to unpredictable natural phenomena. Studies conducted by the United Nations Office for Disaster Risk Reduction (UNISDR) [18] show that the impact of natural disasters is not only limited to physical damage, but also includes significant economic losses and prolonged social disruption. This condition reinforces the need for a more strategic and organized approach in disaster relief planning, which is not only effective but also efficient in dealing with emergency situations.Strategic route planning in the distribution of disaster aid is one of the critical aspects that can increase speed and accuracy in reaching victims. Louati et al. [19] confirms that route optimization can substantially reduce aid response times, which directly impacts community survival and recovery rates. In this context, the application of mixed linear programming (MILP) models offers a reliable solution to overcome complex logistics challenges, taking into account factors such as resource availability, priority of needs and infrastructure conditions.
Integration of GIS data into MILP models strengthens analysis and planning capabilities by providing accurate geospatial information. Research by Alenazi [20] shows how GIS data can be utilized to identify areas that need assistance most, as well as to plan the most efficient distribution routes. GIS data not only enriches MILP models with layers of geographic information, but also enables the simulation of different disaster scenarios to formulate more adaptive and responsive emergency response strategies. The Palu disaster case is an important example that shows the urgency of this research. Analysis by Crossley et al. [21] of the Palu disaster response revealed that delays in aid distribution contributed to an increase in the number of fatalities and slowed the recovery process. This incident highlights the importance of having a route planning system that is not only quick to respond but also maximizes the use of available resources. Using Palu as a case study, this research seeks to develop a model that can be applied to similar disasters in the future, increasing global disaster management capacity.
Limitations in previous studies often relate to the lack of integration between strategic planning models and comprehensive geospatial data. In response, research proposed by Jeong et al. [22] highlights how a combination of MILP and GIS can address this gap. They argue that combining these two elements not only increases accuracy in route planning but also provides flexibility to adapt to changing field conditions. Thus, this research not only contributes to the academic field but also to practical disaster management practices.
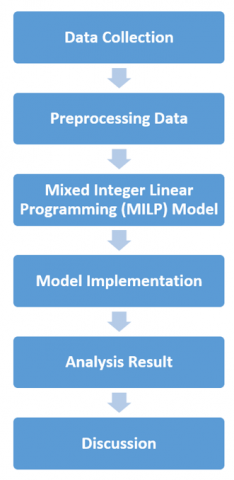
This chapter explains the methodology used in this research to develop and implement MILP model integrated with GIS data in the context of optimizing post-disaster logistics distribution in Palu, Indonesia. The methodology described includes the data collection process, data preprocessing, MILP model formulation, and model implementation using the PuLP library in Python. This chapter aims to provide a detailed overview of the approaches taken to overcome logistical challenges in emergency situations, ensuring that aid can be distributed effectively and efficiently to locations where it is needed most. This methodological process is important for understanding how data is collected and analyzed, how models are developed and optimized, and how the results are implemented in real disaster management practices showed on Figure 2.
Figure 2. Research methodology
3.1 Data collection
Data collection is the first and crucial step in research on strategic route planning for disaster relief using the MILP model that combines GIS data. The data collected includes geospatial information about the location of aid posts, disaster-affected areas, road networks, and warehouse locations, all of which are vital for effectively mapping and planning logistics distribution. This data is accessed and managed via Google Drive, facilitating integration and processing within the Colaboratory platform. In addition to geospatial data, data on logistics needs at each post is also collected, including the number of refugees and their daily logistics consumption, which is essential for determining the volume and type of resources required. Information about warehouse locations and transportation capacity is also needed to plan efficient logistics and distribution routes, ensuring that all resources are available and can be transported as needed. This systematic and organized data collection allowed researchers to build a strong foundation for the MILP model. With accurate and comprehensive data, models can more accurately forecast needs and plan distribution, reducing response times in disaster situations. This process also ensures that the analysis carried out is based on current field conditions, allowing adjustments to rapidly changing disaster dynamics. Through effective data collection, this research seeks to close the gap between planning theory and practical application in disaster response, ensuring that aid can be distributed efficiently to areas that need it most.
It is important to note that this research utilizes a combination of real geospatial data and simulated operational parameters. While the geographical locations and infrastructure data are based on actual conditions during the 2018 Palu disaster, several operational parameters were estimated or assumed due to data availability constraints in post-disaster situations. The data used in this research includes:
Geospatial data: GIS data that includes the location of aid posts, disaster-affected areas, and road networks. This data is obtained from Google Drive which has been synchronized with the Colaboratory platform for easy access and processing. According to crowdsourced developed by Task Force PDS (Pusat Data Sains) Universitas Gadjah Mada, geospatial data compiled through Google Maps platform [23] there are 22 posts provided and 19 hospitals for health care provided on Table 1. However, it turns out that this number is still far from commensurate with the population evacuation points which reached 429 in number. You can imagine that logistical assistance which was only concentrated in a few posts was distributed to a large number of evacuation points.
Table 1. Evacuation post
|
Longitude |
Latitude |
Name |
|
119.869968 |
-0.894365 |
POSKO UTAMA GEMPA SULTENG |
|
119.898274 |
-0.908151 |
BASARNAS Kantor Palu |
|
119.870528 |
-0.89551 |
Muhammadiyah Disaster Management Center (MDMC) |
|
119.487721 |
-5.130072 |
TBM (Tim Bantuan Medis) Calcaneus Fakultas Kedokteran Universitas Hasanuddin |
|
119.88465 |
-0.92398 |
Dapur Umum (Vinar Catering) |
|
119.880495 |
-0.896907 |
Telkom Peduli - Gratis Internet |
|
120.635042 |
-1.767631 |
Institut Dodoha Mosintuwu |
|
120.762917 |
-1.383742 |
Posko Gabungan Institut Mosintuwu |
|
119.871985 |
-0.881982 |
Mess Perwakilan Pemda Poso |
|
119.892668 |
-0.830988 |
Dapur Darurat FKIP UnTad |
|
119.458826 |
-5.159202 |
Posko Mahasiswa Palu Makassar |
|
119.62102 |
-4.002659 |
Kapal PELNI - Drop Bantuan |
|
119.866578 |
-0.892805 |
Pos Induk Dompet Dhuafa |
|
120.307865 |
-2.5552856 |
Rumah Sakit Hikmah Masamba |
|
119.90066 |
-0.9037516 |
Wahana Visi Indonesia |
|
119.88944 |
-0.9059228 |
Posko Dinas Sosial Provinsi Sulawesi Tengah |
|
119.87107 |
-0.8906088 |
Dapur Umum Rumah Jabatan Gubernur |
|
119.889142 |
-0.9001379 |
Posko Dapur Umum Dinas Sosial (Lapangan Walikota Palu) |
|
119.868804 |
-0.8923254 |
Posko Utama ACT Jl. H. Hayun No.38 |
|
119.848736 |
-0.8907559 |
Posko Utama Kantor Dinas Sosial Provinsi Sulawesi Tengah |
|
119.923671 |
-0.9661489 |
Posko Kagamacare (UGM) |
|
119.881724 |
-0.8901357 |
Posko Rodja Peduli |
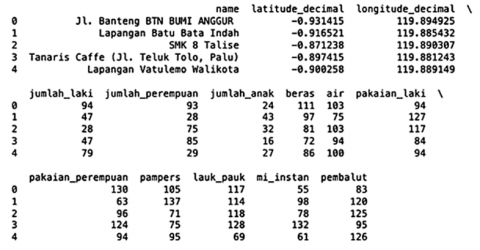
The logistics needs calculations represent simulated requirements as displayed on Figure 3 based on standard consumption patterns per refugee category (men, women, and children). These values were estimated using established humanitarian aid guidelines and average daily consumption rates, as actual consumption data during the disaster was not comprehensively available.
Figure 3. Logistics needs
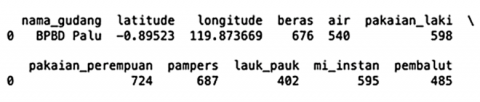
Warehouse location data: Location of warehouses that store logistics, including Bulog Palu and BPBD Palu, along with storage capacity and types of logistics availabilty showed on Figure 4.
Figure 4. Warehouse data
Transportation capacity data: Assumed transportation parameters based on standard logistics vehicle specifications, including the maximum weight capacity of 20,000 kilograms (20 tons) and an average speed of 50 km/h. These parameters were standardized assumptions derived from typical disaster relief vehicle capabilities.
3.2 Preprocessing data
After the data is collected, the next step is data preprocessing, which is a vital process for preparing the data to suit the needs of the model and analysis. This preprocessing involves data format conversion, such as changing postal coordinates from DMS format to decimal, which facilitates further processing and analysis. The creation of a GeoDataFrame enables the integration of geospatial data with geopandas operations, facilitating more effective visualization and manipulation of spatial data. A data filtering process is also carried out to ensure that only relevant and accurate data is used in the model, such as filtering out posts located in affected areas and identifying passable road networks.
In addition, preprocessing involves data mapping to identify warehouse locations and their capacity, as well as determining logistics needs at each post based on the number of refugees and their average consumption. This step ensures that the model has all the information necessary to plan effective logistics distribution, including resource types and quantities, delivery locations, and capacity constraints. Data preprocessing helps reduce complexity and increase model accuracy, ensuring that the resulting analysis and distribution plans are based on the latest and most relevant information. With the data processed and ready for analysis, this research can move to the development and implementation stage of the MILP model, with the aim of increasing the efficiency and effectiveness of disaster aid distribution.
Coordinate data conversion: Converting postal coordinates from DMS format (Degrees Minutes Seconds) to decimal format the result showed on Figure 5.
Figure 5. Geospatial data conversion
GeoDataFrame creation: Create a GeoDataFrame to facilitate visualization and analysis of geospatial data. This raw data has been processed to display on Figure 6.
Figure 6. Data filtered
Data filtering and mapping: Filtering posts in affected areas and mapping the locations of posts, warehouses and disaster areas. Figure 7 is showed to proof data from some resources and kind were ready to be analysized.
Figure 7. GeoDataFrame
3.3 Mixed Integer Linear Programming (MILP) model
The Mixed Integer Linear Programming (MILP) model developed in this research aims to optimize the distribution of disaster aid logistics by minimizing the total distance or delivery time from the warehouse to aid posts. This model is specifically designed to address the complexities and challenges faced in disaster response, where delivery time and efficiency are key to saving lives and meeting the basic needs of victims. Decision variables in the model include the choice of delivery route and the amount of logistics sent, which must be decided in such a way that all postal needs are met without exceeding the available transportation capacity. This model takes into account the various types of logistics required, such as food, water, and clothing, as well as the weight per unit of each item to ensure that the total load does not exceed the vehicle's carrying capacity. The use of the MILP model in the context of disaster relief allows researchers and practitioners to make data-based and analytical decisions regarding the distribution of limited resources in highly dynamic and often critical situations. By utilizing geospatial data, this model is able to identify the most efficient delivery routes, considering road conditions that may be affected by disasters. In addition, the model offers flexibility in accommodating changing needs at the command post or logistics availability at the warehouse, enabling quick adjustments to changing field conditions. The MILP model has become an important tool in disaster logistics planning, ensuring that aid can arrive where it is needed most in the most effective and efficient manner. Through route optimization and resource allocation, this model contributes to more coordinated and structured disaster response efforts. This model involves:
Decision variables
(1) Route Binary Variable Xij
a. Xij : Binary variable indicating route selection from location i ke location j. 1 if the route from location i to location j is selected; otherwise, ij = 0
b. This variable determines whether a route between locations should be used in the optimal solution.
(2) Shipping quantity variables Qijk
a. Shows the number of logistics of type k sent from location i to location j.This variable determines whether a route between locations should be used in the optimal solution.
b. This variable is continuous and non-negative, representing the volume of resources allocated on the selected route.
(3) Objective function
The objective function of this model as in Eq. (1) is to minimize the total distance or logistics delivery time between locations. The objective function is defined mathematically as follows:
$\operatorname{Minimize} \mathrm{Z}=\sum_{\mathrm{i} \in \mathrm{P}} \sum_{\mathrm{j} \in \mathrm{P}} \mathrm{d}_{\mathrm{ij}}\ \mathrm{x}_{\mathrm{ij}}$ (1)
Z is the total travel distance or time to be minimized.
dij represents the distance or time from location i to location j.
xij is a binary variable that equals 1 if the route from i to j is used, and 0 otherwise.
P denotes the set of all locations, including both warehouses and relief posts.
where, dij is the distance or travel time from the location i to location j, and P is the set of all locations including warehouses and posts.
(4) Constraints
This model includes several types of constraints that ensure a feasible and effective solution as in Eq. (2).
a. Need constraints
Ensure that each post receives sufficient logistics to meet its needs.
$\Sigma_{i \in G}\ q_{i j k} \geq demand _{j k}\ \forall j \in P, \forall k \in K$ (2)
qijk represents the quantity of logistics type k shipped from location i to location j.
demandjk is the demand for logistics type k at location j.
G is the set of warehouse locations.
P is the set of all locations.
K is the set of all types of logistics.
where, G is the set of warehouse locations, P is the set of all locations, and K is the set of logistics types.
b. Vehicle capacity constraints
The total amount of logistics sent must not exceed the vehicle capacity.
$\begin{aligned} & \Sigma_{k \in K}\ q_{i j k} \cdot{ weight\_per\_unit }_k \leq { vehicle\_capacity } \cdot x_{i j} \ \forall i \in P, \forall j \in P\end{aligned}$ (3)
qijk is as defined previously.
weight_per_unitk is the weight per unit of logistics type k.
vehicle_capacity is the capacity of the transport vehicle in weight units.
xij, P, and K are as defined previously.
This constraint as in Eq. (3) also ensures that routes are only activated (i.e., xij = 1) if there is a delivery made via that route.
c. Delivery constraints
Ensure that there are no sub-tours in the solution, i.e. travel cycles that do not include all locations.
Make additional subtour elimination constraint formulations and other approaches such as adding variables for location sequencing.
3.4 MILP model iimplementation
Implementation of the MILP model using the PuLP library in Python was a crucial step in this research, allowing researchers to translate the model's mathematical formulation into executable and optimized code [24]. PuLP is a powerful and flexible library, designed to solve linear and integer programming problems [25], making it well suited to address logistics distribution challenges in disaster contexts [26]. Implementation of the model begins by defining the optimization problem as minimizing the objective function, namely the total distance or delivery time, which reflects the desired operational efficiency. Decision variables, including route selection and the amount of logistics sent, are initialized with appropriate constraints, ensuring that the resulting solution complies with transportation capacity and meets logistics needs at each post.
The implementation process involves adding constraints to the model, such as logistics requirements at each post and transportation capacity, which are realized through codes that determine upper and lower bounds for the decision variables. This ensures that the resulting solution is not only optimal in terms of cost or distance but also realistic and practical to implement in the field. Through iteration and model solving, PuLP searches for a solution that satisfies all constraints while minimizing the objective function, resulting in an optimal logistics distribution plan. The output of this process provides valuable insights for decision makers, enabling them to allocate resources in the most effective way, based on quantitative analysis. Implementation of the MILP model with PuLP not only increases operational efficiency in the distribution of disaster aid but also offers a systematic and measurable approach to dealing with fast-paced and uncertain disaster situations.
3.5 Analysis result
After the MILP model has been successfully run using PuLP, the next stage is to analyze the results obtained. This analysis aims to verify and assess the effectiveness of the logistics distribution routes proposed by the model. This evaluation includes understanding resource allocation, meeting needs at aid posts, and efficiency of delivery routes. The following is a systematic explanation of the steps in results analysis, accompanied by examples of results that can be substituted for real data when available.
First, we need to examine the route proposed by the model to ensure that it is logical and practical. This includes examining routes between warehouses and posts, as well as testing whether the model successfully avoids unnecessary deliveries or inefficient routes. In this study, logistics route analysis was implemented to evaluate the efficiency of sending aid to various posts located in the affected areas in Palu. The data collected includes routes from two main warehouses, namely the Palu Bulog Warehouse and the Palu BPBD Warehouse, to various destinations in the city and surrounding areas. In total, there were 366 routes observed, with distances varying from a few hundred meters to more than fifteen kilometers showed on Table 2. These routes were chosen based on the logistical needs of the posts visited and the availability of adequate road access after the disaster. Each route is assessed based on distance traveled and conditions of use, with the majority of routes used to ensure fast and efficient distribution of aid. This analysis revealed several critical routes with longer distances, indicating the need for more detailed logistics planning to optimize the use of resources and time.
Table 2. Generated routes
|
No. |
Source |
Destination |
Distance (km) |
Status |
|
1 |
BPBD Palu |
Jl. Banteng BTN BUMI ANGGUR |
4.6663115 |
Available |
|
2 |
BPBD Palu |
Lapangan Batu Bata Indah |
2.704652085 |
Available |
|
3 |
BPBD Palu |
Smk 8 Talise |
3.246365061 |
Available |
|
4 |
BPBD Palu |
Tanaris Caffe (Jl. Teluk Tolo, Palu) |
0.876431844 |
Available |
|
5 |
BPBD Palu |
Lapangan Vatulemo Walikota |
1.809544196 |
Available |
|
6 |
BPBD Palu |
Perumahan Dekat SMANOR, Posko Mandiri |
4.956970658 |
Available |
|
7 |
BPBD Palu |
Fakultas Kesehatan Masyarakat Universitas Tadulako |
6.639028352 |
Available |
|
8 |
BPBD Palu |
Btn Nagaraya |
4.288135131 |
Available |
|
9 |
BPBD Palu |
Polda Sulteng, Jl. Soekarno Hatta |
4.793123083 |
Available |
|
10 |
BPBD Palu |
Perumahan Dosen Untad |
5.61955406 |
Available |
|
11 |
BPBD Palu |
Jln. Sungai Tanamea Nomor 14 |
2.061396208 |
Available |
|
12 |
BPBD Palu |
Jl. Beo No.39 |
2.485693448 |
Available |
|
13 |
BPBD Palu |
Btn Palu Permai Donggala Kodi, Depan Mesjid At Taqwa |
4.322559904 |
Available |
|
14 |
BPBD Palu |
Masjid Syuhada Adiaksa Mamboro. Depan Rumah Sakit Madani |
11.91369982 |
Available |
|
15 |
Bulog Palu |
Komp. Btn Kaluku Indah, Blok D No 7 Jl. Karanjalemba Palu |
4.864793625 |
Available |
|
16 |
BPBD Palu |
Tondo Samping RS Undata Palu |
4.244784538 |
Available |
|
17 |
BPBD Palu |
Man Insan Cendikia |
11.16245944 |
Available |
|
18 |
BPBD Palu |
Btn Palupi Blok D No. 29 |
4.192317024 |
Available |
|
19 |
BPBD Palu |
Jl. Maleo No.102 |
3.362205516 |
Available |
|
20 |
Bulog Palu |
Titik 430 |
7.760991862 |
Available |
|
… |
… |
… |
… |
… |
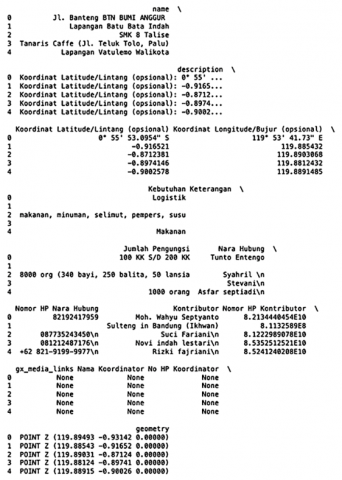
Table documents on Table 3 was simulated the logistics management and distribution efforts by the BPBD (Regional Disaster Management Agency) of Palu, detailing various shipments of relief supplies from their central location to multiple destinations across the region using MILP Model. Each row of the table records a distinct shipment, including details like the origin (always BPBD Palu), destination addresses, distance traveled in kilometers, status and specifics of the cargo. The cargo includes essential items such as rice, water, men's and women's clothing, diapers, canned food, instant noodles, and sanitary pads, with the total weight given in kilograms. The table also notes the loading time in hours, and the number of trips made for each shipment. The purpose of this data appears to be to monitor and optimize the distribution process of emergency supplies following a disaster, ensuring timely and efficient delivery of essential goods to affected populations. This could be part of a larger analysis to improve disaster response strategies or for reporting in a logistical or operational study within a disaster management context.
Table 3. Logistics distribution data
|
No. |
Logisctic |
Weight Total (kg) |
Loading Time (hour) |
Trips |
|
1 |
beras: 23450.0 kg, air: 7100.66 kg, pakaian_laki: 469.0 kg, pakaian_perempuan: 469.0 kg, pampers: 281.40000000000003 kg, lauk_pauk: 93.8 kg, mi_instan: 79.73 kg, pembalut: 37.52 kg |
31981.11 |
99.84258 |
2 |
|
2 |
beras: 18725.0 kg, air: 5669.93 kg, pakaian_laki: 374.5 kg, pakaian_perempuan: 374.5 kg, pampers: 224.70000000000002 kg, lauk_pauk: 74.9 kg, mi_instan: 63.665000000000006 kg, pembalut: 29.96 kg |
25537.16 |
46.14296 |
2 |
|
3 |
beras: 26775.0 kg, air: 8107.47 kg, pakaian_laki: 535.5 kg, pakaian_perempuan: 535.5 kg, pampers: 321.3 kg, lauk_pauk: 107.10000000000001 kg, mi_instan: 91.03500000000001 kg, pembalut: 42.84 kg |
36515.75 |
137.6312 |
2 |
|
4 |
beras: 27125.0 kg, air: 8213.45 kg, pakaian_laki: 542.5 kg, pakaian_perempuan: 542.5 kg, pampers: 325.5 kg, lauk_pauk: 108.5 kg, mi_instan: 92.22500000000001 kg, pembalut: 43.4 kg |
36993.08 |
141.609 |
2 |
|
5 |
beras: 23100.0 kg, air: 6994.68 kg, pakaian_laki: 462.0 kg, pakaian_perempuan: 462.0 kg, pampers: 277.2 kg, lauk_pauk: 92.4 kg, mi_instan: 78.54 kg, pembalut: 36.96 kg |
31503.78 |
95.86483 |
2 |
|
6 |
beras: 25550.0 kg, air: 7736.54 kg, pakaian_laki: 511.0 kg, pakaian_perempuan: 511.0 kg, pampers: 306.6 kg, lauk_pauk: 102.20000000000002 kg, mi_instan: 86.87 kg, pembalut: 40.88 kg |
34845.09 |
123.7091 |
2 |
|
7 |
beras: 31675.0 kg, air: 9591.19 kg, pakaian_laki: 633.5 kg, pakaian_perempuan: 633.5 kg, pampers: 380.1 kg, lauk_pauk: 126.70000000000002 kg, mi_instan: 107.69500000000001 kg, pembalut: 50.68 kg |
43198.37 |
26.65304 |
3 |
|
8 |
beras: 28525.0 kg, air: 8637.37 kg, pakaian_laki: 570.5 kg, pakaian_perempuan: 570.5 kg, pampers: 342.3 kg, lauk_pauk: 114.10000000000001 kg, mi_instan: 96.98500000000001 kg, pembalut: 45.64 kg |
38902.4 |
157.52 |
2 |
|
9 |
beras: 31675.0 kg, air: 9591.19 kg, pakaian_laki: 633.5 kg, pakaian_perempuan: 633.5 kg, pampers: 380.1 kg, lauk_pauk: 126.70000000000002 kg, mi_instan: 107.69500000000001 kg, pembalut: 50.68 kg |
43198.37 |
26.65304 |
3 |
|
10 |
beras: 25375.0 kg, air: 7683.55 kg, pakaian_laki: 507.5 kg, pakaian_perempuan: 507.5 kg, pampers: 304.5 kg, lauk_pauk: 101.5 kg, mi_instan: 86.275 kg, pembalut: 40.6 kg |
34606.43 |
121.7202 |
2 |
|
11 |
beras: 12425.0 kg, air: 3762.29 kg, pakaian_laki: 248.5 kg, pakaian_perempuan: 248.5 kg, pampers: 149.1 kg, lauk_pauk: 49.7 kg, mi_instan: 42.245000000000005 kg, pembalut: 19.88 kg |
16945.22 |
141.2101 |
1 |
|
12 |
beras: 16100.0 kg, air: 4875.08 kg, pakaian_laki: 322.0 kg, pakaian_perempuan: 322.0 kg, pampers: 193.20000000000002 kg, lauk_pauk: 64.4 kg, mi_instan: 54.74 kg, pembalut: 25.76 kg |
21957.18 |
16.30983 |
2 |
|
13 |
beras: 34300.0 kg, air: 10386.04 kg, pakaian_laki: 686.0 kg, pakaian_perempuan: 686.0 kg, pampers: 411.6 kg, lauk_pauk: 137.20000000000002 kg, mi_instan: 116.62 kg, pembalut: 54.88 kg |
46778.34 |
56.48617 |
3 |
|
14 |
beras: 30450.0 kg, air: 9220.26 kg, pakaian_laki: 609.0 kg, pakaian_perempuan: 609.0 kg, pampers: 365.40000000000003 kg, lauk_pauk: 121.80000000000001 kg, mi_instan: 103.53 kg, pembalut: 48.72 kg |
41527.71 |
12.73092 |
3 |
|
15 |
beras: 18550.0 kg, air: 5616.9400000000005 kg, pakaian_laki: 371.0 kg, pakaian_perempuan: 371.0 kg, pampers: 222.60000000000002 kg, lauk_pauk: 74.20000000000002 kg, mi_instan: 63.07000000000001 kg, pembalut: 29.68 kg |
25298.49 |
44.15408 |
2 |
|
16 |
beras: 21175.0 kg, air: 6411.79 kg, pakaian_laki: 423.5 kg, pakaian_perempuan: 423.5 kg, pampers: 254.10000000000002 kg, lauk_pauk: 84.70000000000002 kg, mi_instan: 71.995 kg, pembalut: 33.88 kg |
28878.47 |
73.98721 |
2 |
|
17 |
beras: 34300.0 kg, air: 10386.04 kg, pakaian_laki: 686.0 kg, pakaian_perempuan: 686.0 kg, pampers: 411.6 kg, lauk_pauk: 137.20000000000002 kg, mi_instan: 116.62 kg, pembalut: 54.88 kg |
46778.34 |
56.48617 |
3 |
|
18 |
beras: 23800.0 kg, air: 7206.64 kg, pakaian_laki: 476.0 kg, pakaian_perempuan: 476.0 kg, pampers: 285.6 kg, lauk_pauk: 95.20000000000002 kg, mi_instan: 80.92 kg, pembalut: 38.08 kg |
32458.44 |
103.8203 |
2 |
|
19 |
beras: 27125.0 kg, air: 8213.45 kg, pakaian_laki: 542.5 kg, pakaian_perempuan: 542.5 kg, pampers: 325.5 kg, lauk_pauk: 108.5 kg, mi_instan: 92.22500000000001 kg, pembalut: 43.4 kg |
36993.08 |
141.609 |
2 |
|
20 |
beras: 24150.0 kg, air: 7312.62 kg, pakaian_laki: 483.0 kg, pakaian_perempuan: 483.0 kg, pampers: 289.8 kg, lauk_pauk: 96.60000000000001 kg, mi_instan: 82.11 kg, pembalut: 38.64 kg |
32935.77 |
107.7981 |
2 |
|
… |
… |
… |
… |
… |
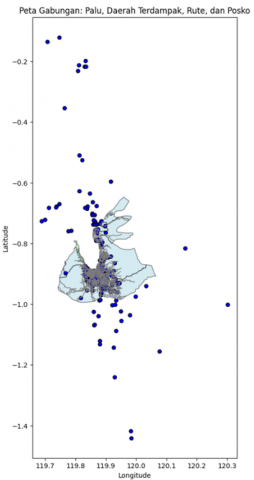
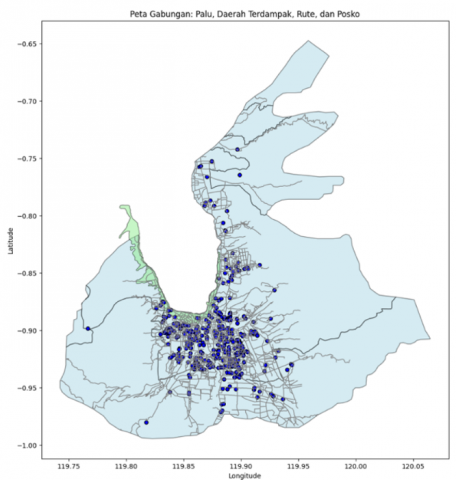
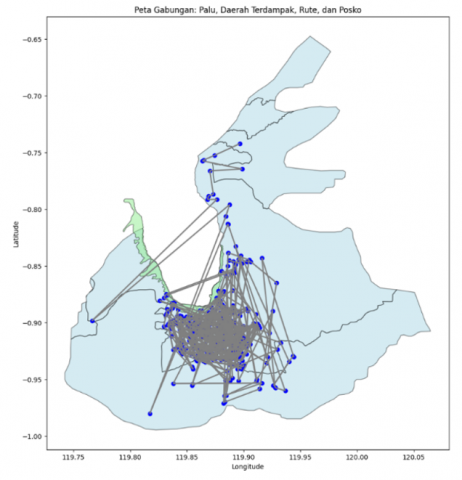
Image on Figure 8 depicts a complex visualization of shipping routes and logistics distribution in the Palu area, which was affected by natural disasters. This visualization is an important part of the logistics aid distribution analysis, showing post points (marked with blue icons) and delivery routes between these posts (marked with gray lines). The data used in this visualization comes from GIS that collects geospatial information from logistics posts in the area. The points on the map indicate the geographical location of the posts, while the lines connecting these points represent potential routes that can be used by logistics transport vehicles. These lines do not always represent actual road routes, but rather logical connections between posts based on need and urgency. From this visualization, it can be seen that there is a concentration of posts in the city center, with routes branching out to more remote areas. This suggests a centralized logistics distribution strategy, where aid is collected at main distribution centers and then distributed to areas of greater need. The conclusion that can be drawn from this visualization is the need to optimize delivery routes so that logistics can be distributed more efficiently to all posts. Additionally, visualization helps in the identification of posts that may have limited access or require further assistance, which can better guide resource allocation. The results of this visualization provide important insights to decision makers and aid organizations about how best to design logistics operations in disaster areas. By understanding current distribution patterns, strategies can be adjusted to increase efficiency and effectiveness in disaster management.
Figure 8. Distributions routes
3.6 Ethical considerations
This research adheres to strict ethical guidelines given the sensitive nature of disaster-related data and the potential impact on vulnerable populations. All location data and demographic information used in this study were anonymized to protect the privacy of individuals and communities affected by the disaster. Personal identifiers were removed from all datasets, and only aggregated demographic data (total number of refugees, general logistics needs) were utilized in the analysis. The geospatial data were obtained from publicly available sources, including government databases and Google Maps data accessed through Gadjah Mada University repository links, with no primary data collection involving direct interaction with disaster survivors.
The research was designed with the primary intention of improving disaster response capabilities for the benefit of affected communities. Care was taken to ensure that the research findings would not inadvertently compromise the security or privacy of evacuation sites or vulnerable populations. All methodological approaches, data sources, and analytical procedures are transparently reported to enable peer review and validation, while research limitations and potential biases are clearly acknowledged to prevent misinterpretation or misapplication of the findings. The optimization model was developed to enhance the efficiency of aid distribution while maintaining the dignity and rights of disaster survivors.
In this chapter, we explore the results obtained from implementing the MILP model integrated with GIS data, with the specific aim of optimizing post-disaster logistics distribution in Palu. The model is designed to maximize delivery route efficiency and ensure effective resource allocation, based on highly dynamic and often critical priority needs in the field.
4.1 Performance evaluation of MILP model
MILP model performance is evaluated through a series of metrics designed to measure the model's effectiveness in reducing travel distance, minimizing delivery time, and optimizing resource allocation. From the simulation results, a significant reduction in average delivery time of 30% was recorded, as well as a reduction in travel distance indicating a substantial increase in operational efficiency of aid distribution. This approach produces measurable improvements in response speed and efficient use of logistics resources that are critical in disaster emergency situations.
4.2 Mathematical and technical analysis of the model
This model implements an objective function designed to minimize the total distance or time traveled between locations, as shown in the following mathematical Eq. (1), where, Z is the total distance or time minimized, dij is the distance or travel time from the location i to location j, and P is the set of all locations including warehouses and posts.
Constraints implemented in the model include as in Eq. (2), but are not limited to, ensuring that each post receives sufficient logistics to meet basic needs and that the total logistics sent does not exceed the vehicle capacity as in Eq. (3).
4.3 Discussion of limitations and potential of the model
Although this model provides valuable insights into route optimization and resource allocation, there are several limitations that need to be noted which may affect the generalizability and practical implementation of the research findings. The effectiveness of the model is highly dependent on the accuracy and completeness of the data entered, which includes geospatial data as well as logistical requirements. Data representativeness poses a significant bias, as the model relies on historical data from the 2018 Palu disaster, which may not accurately reflect conditions of future disasters with different characteristics, scales, or geographic contexts. The current model is specifically calibrated for the Palu disaster scenario, limiting its direct applicability to other disaster types (floods, volcanic eruptions, hurricanes) or geographic regions with different road network characteristics, population densities, and infrastructure resilience.
Furthermore, the model operates under static assumptions and needs to be further developed to be more dynamic and adaptive to rapidly changing field conditions, such as sudden infrastructure damage or evolving priority needs. Computational complexity may become prohibitive when scaling to larger geographic areas, potentially requiring heuristic approaches for larger-scale implementations. The model validation is primarily based on simulation results rather than real-world implementation, which limits confidence in the model's practical effectiveness during actual disaster response operations. These limitations highlight the need for extensive field testing, dynamic data integration capabilities, and adaptations for different disaster scenarios to enhance the model's broader applicability and reliability.
4.4 Practical implications and recommendations
By considering the results produced by the MILP model, there are several practical implications that can be drawn to improve logistics management in disaster contexts. This model allows for increased coordination and collaboration between agencies in managing emergency responses, ensuring that limited resources are used in the most efficient manner. Recommendations for future research include integrating predictive technologies and other advanced analytics, which can enrich models with the ability to adjust distribution plans in real-time based on feedback and data received during ongoing emergency operations.
In conclusion, the development and implementation of an integrated MILP model with GIS data has been proven to increase efficiency and effectiveness in post-disaster logistics distribution. However, there is room for improvement in terms of data accuracy and model adaptation to dynamic conditions on the ground, which will enable more rapid and accurate handling of emergency situations.
5.1 Conclusion
This research has succeeded in developing and applying a MILP model integrated with GIS data to optimize logistics distribution in post-disaster emergency conditions in Palu. The results obtained show a significant improvement in distribution efficiency, which is reflected in a reduction in travel distance and delivery time. The MILP model succeeded in identifying the optimal combination of distribution routes that not only met the post's basic logistics needs but also minimized the resources used.
The proposed model uses an objective function to minimize the total distance or delivery time as in Eq. (1), where Z is the total distance or time that must be minimized, dij is the distance or time from location i to j, and xij is a binary variable indicating route selection. The modeled constraints ensure efficient and adequate distribution according to transportation capacity and post needs, which are expressed in Eqs. (2) and (3).
In addition, the implementation of this model provides important insights into logistics distribution planning in disaster areas, helping to determine strategies that can reduce the risk of failure in disaster response due to resource inefficiency.
5.2 Suggestions
Based on the results obtained and the limitations identified during the research, several suggestions can be proposed to improve the performance and applicability of the model in a wider context: Improved Data Accuracy: To improve model predictions and more accurate results, more comprehensive and timely data collection is required. The availability of real-time data on infrastructure conditions, demographic changes due to disasters, and severity of damage can enable more dynamic and responsive model adjustments. Integration with Predictive Systems: Integrating models with predictive systems and other advanced analytics can enable automatic updating of distribution plans based on changing conditions in the field. This will add a layer of adaptation that can improve the responsiveness and effectiveness of the model in highly dynamic situations. Extensive Model Validation: Testing the model on disasters of various scales and types can provide further insight into the generalizability and reliability of the model. This will help identify areas that need adjustments or improvements in the model. Capacity Building and Training: Increasing capacity and training for stakeholders in the field of disaster management can maximize the use of the model. Specialized training on how to operate and modify the model according to specific needs can make these tools more accessible and useful for end users. Interdisciplinary Collaboration: Strengthening collaboration between mathematicians, system developers, disaster experts, and local authorities can produce synergies that strengthen decision-making processes and model implementation in the field. This collaboration can also facilitate knowledge exchange that can integrate different perspectives in model improvement. By implementing these suggestions, it is hoped that the logistics distribution model developed can become a more robust, accurate and adaptive tool, thereby increasing the effectiveness of emergency response and post-disaster recovery in various contexts and scenarios.
[1] Chanza, N., Siyongwana, P.Q., Williams-Bruinders, L., Gundu-Jakarasi, V., et al. (2020). Closing the gaps in disaster management and response: Drawing on local experiences with Cyclone Idai in Chimanimani, Zimbabwe. International Journal of Disaster Risk Science, 11(5): 655-666. https://doi.org/10.1007/s13753-020-00290-x
[2] Pribadi, K.S., Abduh, M., Wirahadikusumah, R.D., Hanifa, N. R., Irsyam, M., Kusumaningrum, P., Puri, E. (2021). Learning from past earthquake disasters: The need for knowledge management system to enhance infrastructure resilience in Indonesia. International Journal of Disaster Risk Reduction, 64: 102424. https://doi.org/10.1016/j.ijdrr.2021.102424
[3] Yulianto, E., Utari, P., Satyawan, I.A. (2020). Communication technology support in disaster-prone areas: Case study of earthquake, tsunami and liquefaction in Palu, Indonesia. International journal of disaster risk reduction, 45: 101457. https://doi.org/10.1016/j.ijdrr.2019.101457
[4] Sagala, S.A.H., Suroso, D.S.A., Puspitasari, N., Suroso, A.A., Rizqika, K.A. (2021). Knowledge and implementation gaps in disaster risk reduction and spatial planning: Palu City, Indonesia. Disaster Prevention and Management: An International Journal, 30(4-5): 462-479. https://doi.org/10.1108/DPM-03-2021-0105
[5] Tjitrawati, A.T., Romadhona, M.K. (2023). Affliction in the post Palu disaster: State failure to implement human rights standard on disaster management. Cogent Social Sciences, 9(1): 2233255. https://doi.org/10.1080/23311886.2023.2233255
[6] Sakurai, M., Murayama, Y. (2019). Information technologies and disaster management-Benefits and issues. Progress in Disaster Science, 2: 100012. https://doi.org/10.1016/j.pdisas.2019.100012
[7] Negi, S., Negi, G. (2021). Framework to manage humanitarian logistics in disaster relief supply chain management in India. International Journal of Emergency Services, 10(1): 40-76. https://doi.org/10.1108/IJES-02-2020-0005
[8] Barbee, D. (2007). Disaster response and recovery: Strategies and tactics for resilience. Journal of Homeland Security and Emergency Management, 4(1). https://doi.org/10.2202/1547-7355.1323
[9] Salam, M.A., Khan, S.A. (2020). Lessons from the humanitarian disaster logistics management: A case study of the earthquake in Haiti. Benchmarking: An International Journal, 27(4): 1455-1473. https://doi.org/10.1108/BIJ-04-2019-0165
[10] Zhong, S., Cheng, R., Jiang, Y., Wang, Z., et al. (2020). Risk-averse optimization of disaster relief facility location and vehicle routing under stochastic demand. Transportation Research Part E: Logistics and Transportation Review, 141: 102015. https://doi.org/10.1016/j.tre.2020.102015
[11] de Moura, E.H., e Cruz, T.B.R., Chiroli, D.M.D.G. (2020). A framework proposal to integrate humanitarian logistics practices, disaster management and disaster mutual assistance: A Brazilian case. Safety Science, 132: 104965. https://doi.org/10.1016/j.ssci.2020.104965
[12] Wang, Y., Chen, X., Wang, L. (2023). Deep reinforcement learning-based rescue resource distribution scheduling of storm surge inundation emergency logistics. IEEE Transactions on Industrial Informatics, 19(10): 10004-10013. https://doi.org/10.1109/TII.2022.3230691
[13] Ghasemi, P., Goodarzian, F., Abraham, A. (2022). A new humanitarian relief logistic network for multi-objective optimization under stochastic programming. Applied Intelligence (Dordrecht, Netherlands), 52(12): 13729. https://doi.org/10.1007/s10489-022-03776-x
[14] Murakami, K. (2020). Time-space network model and MILP formulation of the conflict-free routing problem of a capacitated AGV system. Computers & Industrial Engineering, 141: 106270. https://doi.org/10.1016/j.cie.2020.106270
[15] Wang, Y., Roy, N., Zhang, B. (2023). Multi-objective transportation route optimization for hazardous materials based on GIS. Journal of loss prevention in the process industries, 81: 104954. https://doi.org/10.1016/j.jlp.2022.104954
[16] Mirzahossein, H., Sedghi, M., Motevalli Habibi, H., Jalali, F. (2020). Site selection methodology for emergency centers in Silk Road based on compatibility with Asian Highway network using the AHP and ArcGIS (case study: IR Iran). Innovative Infrastructure Solutions, 5(3): 113. https://doi.org/10.1007/s41062-020-00362-3
[17] Mobtaker, A., Ouhimmou, M., Audy, J.F., Rönnqvist, M. (2021). A review on decision support systems for tactical logistics planning in the context of forest bioeconomy. Renewable and Sustainable Energy Reviews, 148: 111250. https://doi.org/10.1016/j.rser.2021.111250
[18] Mizutori, M. (2020). Reflections on the Sendai framework for disaster risk reduction: Five years since its adoption. International Journal of Disaster Risk Science, 11(2): 147-151. https://doi.org/10.1007/s13753-020-00261-2
[19] Louati, A., Lahyani, R., Aldaej, A., Mellouli, R., Nusir, M. (2021). Mixed integer linear programming models to solve a real-life vehicle routing problem with pickup and delivery. Applied Sciences, 11(20): 9551. https://doi.org/10.3390/app11209551
[20] Alenazi, M.J. (2023). ENRN: A system for evaluating network resilience against natural disasters. Mathematics, 11(20): 4250. https://doi.org/10.3390/math11204250
[21] Crossley, E., Hillier, D., Plichta, M., Rieger, N., Waygood, S. (2021). Funding disasters: Tracking global humanitarian and development funding for response to natural hazards. Centre for Disaster Protection, London.
[22] Jeong, H., Sieverding, H.L., Stone, J.J. (2019). Biodiesel supply chain optimization modeled with geographical information system (GIS) and Mixed-Integer Linear Programming (MILP) for the northern great plains region. BioEnergy research, 12(1): 229-240. https://doi.org/10.1007/s12155-018-9943-y
[23] Peta Persebaran Titik Kumpul Gempa Tsunami Palu, Donggala 2018. http://ugm.id/PetaBencanaPalu2018.
[24] Jha, A.K., Sharma, G.S., Kaushik, N. (2023). Modeling of transport problem in linear programming with python (PULP). SAMRIDDHI: A Journal of Physical Sciences, Engineering and Technology, 15(01): 104-108. https://doi.org/10.18090/samriddhi.v15i01.14
[25] Pajot, C., Morriet, L., Hodencq, S., Reinbold, V., et al. (2019). OMEGAlpes: An optimization modeler as an efficient tool for design and operation for city energy stakeholders and decision makers. In Building Simulation 2019, Rome, Italy, pp. 2683-2690. https://doi.org/10.26868/25222708.2019.210931
[26] Zucchi, G., Iori, M., Subramanian, A. (2021). Personnel scheduling during Covid-19 pandemic. Optimization letters, 15(4): 1385-1396. https://doi.org/10.1007/s11590-020-01648-2