Ahmet H. Ornek* | Murat Ceylan
© 2021 IIETA. This article is published by IIETA and is licensed under the CC BY 4.0 license (http://creativecommons.org/licenses/by/4.0/).
OPEN ACCESS
In order to determine the health status of the neonates, studies focus on either statistical behavior of the thermograms’ temperature distributions, or just correct classifications of the thermograms. However, there exists always a lack of explain-ability for classification processes. Especially in the medical studies, doctors need explanations to assess the possible results of the decisions. Presenting our new study, how Convolutional Neural Networks (CNNs) decide the health status of neonates has been shown for the first time by using Class Activation Maps (CAMs). VGG16 which is one of the pre-trained models has been selected as a CNN model and the last layers of the VGG16 have been tuned according to CAMs. When the model was trained for 50 epochs, train-validation accuracies reached over 95% and test sensitivity-specificity were obtained as 80.701%-96.842% respectively. According to our findings, the CNN learns the temperature distribution of the body by mainly looking at the neck, armpit, and abdomen regions. The focused regions of the healthy babies are armpit and abdomen whereas of the unhealthy babies are neck and abdomen regions. Thus, we can say that the CNN focuses on dedicated regions to monitor the neonates and decides the health status of the neonates.
class activation maps, deep learning, explainable artificial intelligence, medicine, neonates, thermography, visualization
Thermal information is a significant marker to assess conditions of the matters living or not living such as an engine [1], an environment [2], an organism [3] or a neonate [4]. Medical thermography is a relatively new technique being in computer aided diagnosis systems for evaluating bodies' temperatures and giving advises to doctors [5]. Studies about determination of healthy-unhealthy neonates in Neonatal Intensive Care Units (NICUs) by using both machine learning and deep learning algorithms [6, 7] have been realized; however, any of them includes explainable features. With this paper we show to answer: how CNNs makes a decision when babies are classified as healthy and unhealthy.
The deep learning models such as CNNs correctly classify images into desired categories by learning their latent features. Although classifications are realized with small errors, they do not provide explainable information to assess the classification process. When the models could not learn features, developers try different model structures by adding more layers without knowing what will happen. Especially in medical studies, how the model decides and whether it learns are crucial points that totally should be explained.
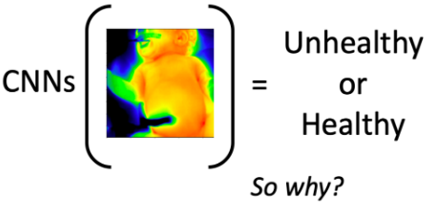
As can be shown in Figure 1 CNNs can make decisions as healthy and unhealthy, but in this case we only know these decisions made by a CNN (i.e. we do not know how CNNs makes decisions, where it focuses on, which part of images are important to decide etc.).
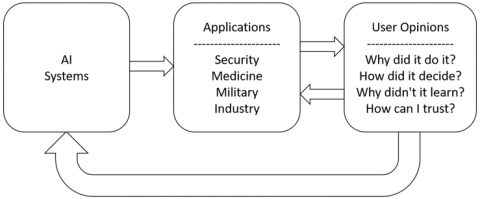
The basic concept of explain-ability is to give confidence to users therefore they can do their works by checking models trained. Figure 2 shows the general concepts of XAI that consists of AI systems, applications such as security, medicine, military and industry, and effects of user side such as Why did it do it? How did it decide?, How can I trust? so on.
Figure 1. Problem definition. While CNNs are able to correctly classify the thermograms, the causes of its decision are not known. In this study, we will be showing which regions are learned by the CNNs
Figure 2. General concepts of XAI
We are filling the big gap in neonatal healthy-unhealthy classification with this study and showing differences between healthy and unhealthy neonates by visualizing activation maps. Thanks to this study, the doctors and specialists will be able to know how AI model decides for health status of the neonates. The main contributions of our study to literature are as follows:
The rest of the paper is that the related works are given in Section 2. The imaging system used in NICU can be seen in Section 3. We are giving the methods and evaluating metrics used in this study in Section 4. While Section 5 shows the experiments and results, the Conclusion can be seen in Section 6.
Measuring the neonatal temperature distribution by using both thermography and thermometer, Clark and Stothers showed that the results of both techniques were similar [8]. Clark and Stothers’s study proved that thermal monitoring of neonates could be realized for the first time.
Necrotizing enterocolitis (NEC) disease which causes a crucial neonatal health problem that affects low-birth weight infants in NICU [9] has been studied by Nur [10]. According to her findings, unhealthy neonates' thermal asymmetries are higher than healthy neonates'.
Abbas et al. [11] proposed a non-contact monitoring system to measure respiratory of newborn babies. Abbas et al. [12] analyzed the heat flux during different medical scenarios such as an open radiant warmer and convective incubator to compensate the external effects while taking the thermograms from NICU.
The abdominal and foot regions were measured for extremely premature neonates by Knobel-Dail et al. [13] using thermography and thermistors. They pointed out the regional variations in thermal condition of neonates with this study.
We have been also working on this topic over the past three years and we showed how neonatal thermograms can be classified as healthy and unhealthy by using deep learning methods such as CNNs [7].
These studies about neonatal monitoring with thermography and artificial intelligence shows the evidences of non-contact and harmless thermal monitoring system for neonates. However to give an important suggestions to doctors that are interested in diseases about neonates, we have to explain the decisions of our intelligent systems also known as models that can learn.
When we come to the explanations of the models, we encounter three main explanation methods as numerical, rule-based, and visual [14].
The numerical methods measure the contributions of input features starting from zero to all or all to zero by using quantitative methods such as Information Gain (IG) [15]. On the other hand, the rule-based methods use the IG and extract various rules from inputs to outputs, and the best known rule-based method is Decision Trees [16]. While these methods give information about classification process, they do not efficiently work in big models such as CNNs because of their limitations in view of time and computational costs.
The visual expressions are typically used in convolution-based methods by creating activation maps (also known as salient masks or heat-maps). Using the activation maps, the contributions of each pixels can be represented on the input images. One of the visual expression methods is Class Activation Maps (CAMs) [17]. With the developing of CAMs, researchers have been able to uncover the class-related pixels contributions to the classification process [18, 19].
The three methods explained above can be combined to increase performance but it should not be forgotten that there is always a trade-off between the performance of a model and its explain-ability.
Thermograms used in this study were taken under difficult conditions from Selcuk University’s NICU with ethical approval from the Ethics Committee of Non-Interventional Clinical Research in Selcuk University, Faculty of Medicine (Number: 2015/16 – Date: 06.01.2015) because all time when we were taking thermograms from naked neonates we had to be fast and mistake-free.
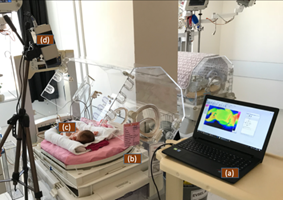
The VarioCAM HD Infrared Thermal Camera which its properties are at Table 1 was used to take thermograms. Our setup can be shown in Figure 3.
Table 1. The properties of the infrared thermal camera
|
Resolution |
480x640 |
|
Measurement Accuracy |
1 Celcius +- 1% |
|
Thermal Resolution |
0.02 Kelvin at 30 Celsius |
|
Frame per Minute |
100 |
Figure 3. System created for taking the thermograms from neonatal intensive care unit. (a) laptop (b) incubator (c) neonate (d) thermal camera
With the help of nurses in NICU the neonates were stripped and the thermograms were taken for hundred times in a minute by using the system in Figure 3. The laptop was used to store the thermograms taken and export them as thermal maps to process with deep learning methods.
While taking the thermograms reports of the neonates about their all information were also stored to label their status. The reports are created by two medical pediatric experts by analyzing the neonates' all conditions in different aspects such as weights, gestational ages, health information, heart rate, respiratory rate and diseases. To our best knowledge there is no such a big neonatal thermal images dataset. The dataset used in this study consists of 3800 thermograms taken from 38 different neonates half of them unhealthy and half healthy.
As can be inferred from Table 2 and Table 3, the mean value of 19 unhealthy neonates' weights is 2094.684 g and standard deviation (std) is 785.826 g whereas 19 healthy neonates' are 1583.429 g and 509.894 respectively. Since neonates are in NICU, they are premature babies having low weights. When we come to age distributions (gestational age), the unhealthy neonates' mean value is bigger than healthy neonates' (approximately 20 days), therefore, the unhealthy neonates have more mean weight than healthy neonates (approximately 500 gr).
Table 2. The characteristics of the healthy neonates
|
Neonate |
Birth Weight (gr) |
Age (day) |
|
Healthy-1 |
1690 |
215 |
|
Healthy-2 |
2200 |
224 |
|
Healthy-3 |
1375 |
198 |
|
Healthy-4 |
1870 |
223 |
|
Healthy-5 |
1300 |
196 |
|
Healthy-6 |
1825 |
238 |
|
Healthy-7 |
1580 |
203 |
|
Healthy-8 |
720 |
168 |
|
Healthy-9 |
955 |
189 |
|
Healthy-10 |
1175 |
200 |
|
Healthy-11 |
1100 |
196 |
|
Healthy-12 |
1900 |
229 |
|
Healthy-13 |
2300 |
236 |
|
Healthy-14 |
1195 |
206 |
|
Healthy-15 |
950 |
201 |
|
Healthy-16 |
2800 |
245 |
|
Healthy-17 |
1605 |
237 |
|
Healthy-18 |
1885 |
225 |
|
Healthy-19 |
1660 |
225 |
Table 3. The characteristics of the unhealthy neonates
|
Neonate |
Birth Weight (gr) |
Age (day) |
|
Unhealthy-1 |
2305 |
239 |
|
Unhealthy-2 |
1985 |
224 |
|
Unhealthy-3 |
2055 |
238 |
|
Unhealthy-4 |
1890 |
233 |
|
Unhealthy-5 |
2200 |
245 |
|
Unhealthy-6 |
3000 |
252 |
|
Unhealthy-7 |
3300 |
232 |
|
Unhealthy-8 |
1100 |
196 |
|
Unhealthy-9 |
2015 |
238 |
|
Unhealthy-10 |
2280 |
259 |
|
Unhealthy-11 |
865 |
196 |
|
Unhealthy-12 |
1590 |
210 |
|
Unhealthy-13 |
1100 |
231 |
|
Unhealthy-14 |
3300 |
266 |
|
Unhealthy-15 |
3079 |
259 |
|
Unhealthy-16 |
2700 |
245 |
|
Unhealthy-17 |
565 |
196 |
|
Unhealthy-18 |
2680 |
266 |
|
Unhealthy-19 |
1790 |
217 |
To explain how classes are detected for the neonates, a CAM structure is needed. For building a CAM structure we need CNNs model and transfer learning method. While the CNN learns the important features of the images and classifies them into classes desired, transfer learning reduces the needed time to train a CNN model effectively and improves the model performance. The models used in transfer learning are described as pre-trained models. By using a pre-trained model users do not train a CNN model from scratch, they only realize fine-tuning operations on pre-trained models which were trained with millions of different images by big companies to train model so that decrease the training time.
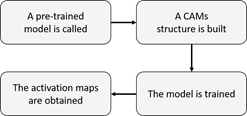
As seen in Figure 4, first of all the important features such as edge, corner and texture are extracted by a pre-trained model and second of all the last layer of the pre-trained model is changed according to outputs desired to produce class-related activations. Then the model is trained and the class-related activations are obtained.
Figure 4. The pipeline of the activation maps obtaining
4.1 Convolutional neural networks (CNNs)
To classify an image, it is necessary that important features (edges, corners and textures) are obtained. The CNN is one of the most used deep learning models due to its structure that can effectively learns deep features of images and classifies them into classes [20].
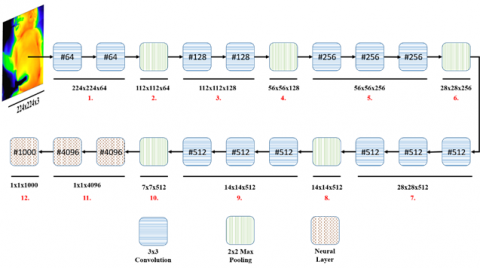
CNNs consists of two main sides as convolutional and neural which are dedicated to feature engineering [21, 22] and classification processes, respectively. A CNN model is displayed in Figure 5.
The convolutional side learns regional textures that are defined at the beginning like 3x3 or 5x5 sizes and the neural side learns global textures of its inputs. The meaningful features are extracted and classified according to classes desired.
The convolutional side (like 1., 3., 5., 7., and 9. parts of Figure 5) can consist of dozens of different convolutional layers. While first convolutional layers learn low-level (small regional) features such as corners and edges, last layers typically learn high-level (big regional) features such as textures [23].
Computational capability is an important key that is needed when a model is trained. In order to reduce dimensions and avoid high computation power, the pooling operation (2., 4., 6., 8., and 10. parts of Figure 5) is used after the convolutional layers.
4.2 Pre-trained networks (transfer learning)
Transfer learning is the process of taking a CNN model that has been trained with large data sets and processors with high capacities.
It is difficult to train a CNN from the scratch because of needing both high computational capabilities and thousands of labeled images. Pre-trained models come up with a solution to overcome those lack of needs [24-27]. A pre-trained model can be used for both feature extraction and fine-tuning issues.
Figure 5. A CNNs model with pre-trained VGG16 architecture
Since lower-level features such as edges are typically the same in each classification process, instead of re-learning these features for every training, the weights of the first convolution layers of the pre-trained models can be directly used. Thus, the CNNs models learn convolution weights that find textures like tissues.
We used VGG model which can be seen in Figure 5 with 16 layers also known as VGG16 that has 5 pooling layers, 13 convolutional layers, and 3 neural layers [27] (p.s. End-to-end 21,137,986 features, 224x224x3 input size and 7x7x512 the last convolutional layer size).
4.3 Class activation maps (CAMs)
Figure 6. The activations that are needed to use in visualization
There are visualization techniques in CNNs such as layers' outputs visualizations and filter visualizations. But these techniques are not enough to assess the decisions. CAMs are used to determine which parts of image are learned by CNNs.
The layers' outputs give information about how each layers affect their connected layers, and which types of convolutions are learned by filter visualization. Since we need to explain how CNNs work, advanced techniques such as CAMs are necessary to visualize important regions (i.e. class-related activations) of images.
We are trying to find activations seen in Figure 6 because those activations are related to diseases and if we apply them to images we are going to find the essential regions for classification. It is shown that how a CAM is built in Figure 7 and the detailed representation of the CAM side is given in Figure 8.
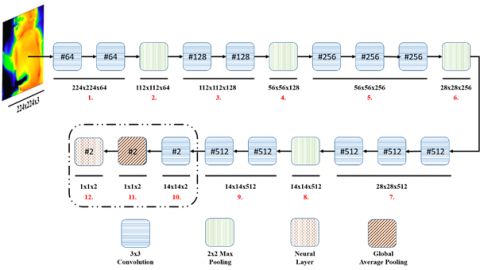
If Figure 5 and Figure 7 are compared, it is seen that some changes important are needed. To change the VGG16 model into CAMs model, we need to add a new convolution layer that its size is equal to our number of desired outputs as the last convolution.
As can be seen in 9. part of Figure 5, there are three convolutional layers (#512, #512, and #512). Since our output has two classes as healthy/unhealthy, the last convolution's layer size has been changed from #512 to #2 (10. part of Figure 7 and Figure 8).
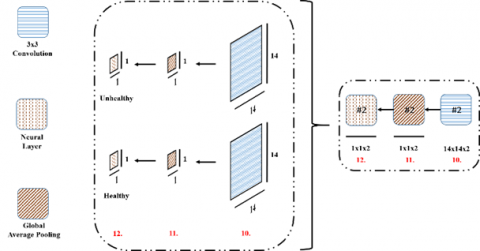
After obtaining the last convolution with the same sizes of output desired, Global Average Pooling (GAP) (Eq. (1)) [28] is applied to each last layer (11. part of Figure 7 and Figure 8).
$G A P_{n}=\sum_{x, y} f_{n}(x, y)$ (1)
where, fn(x, y) is width x height sized n th convolutional layer. With the GAP operation 1x1 sized convolutional layers are obtained, and then a neural layer is added as the last layer to the model (12. part of Figure 7 and Figure 8).
Figure 7. A CAM model created by pre-trained VGG16 model
Figure 8. The detailed representation of CAMs and global average pooling
When it comes to the activation maps the following equation is calculated:
$I_{c}=\sum_{n} w_{n}^{c} G A P_{n}$ (2)
where, Ic is the activation map calculated for class c, $ w_{n}^{c}$represents the weight of class c for n th layer (i.e. the importance of GAPn for the class c). Finally Softmax function [29] is calculated with the following equation:
$S F T_{c}=\frac{e^{I_{C}}}{\sum_{c} e^{I_{c}}}$ (3)
The Softmax function gives probabilities that sum of them is equal to 1 for example 0.3 healthy and 0.7 unhealthy.
4.4 Evaluation of the results
Typically three metrics are used to evaluate the results. The ratio of correctly classified data to all data is described as accuracy (Eq. (4)).
$\operatorname{accuracy}=\frac{T P+T N}{T P+T N+F P+F N}$ (4)
where, TP is number of the real patient data labeled as patient, FP is number of healthy data labeled as patient, TN is number of healthy data labeled as healthy, and FN is number of the unhealthy data as healthy. The confusion matrix is obtained by using those four expressions as shown at Table 4.
Table 4. The confusion matrix
|
Confusion Matrix |
Actual Class |
|
|
Class Predicted |
TP |
FN |
|
FP |
TN |
|
By using a confusion matrix, evaluations become more understandable and metrics such as specificity and sensitivity can be directly calculated.
The ratio of the TN to all healthy data is described as specificity (Eq. (5)) and the ratio of the TP to all unhealthy data is described as sensitivity (Eq. (6)).
specificity $=\frac{T N}{T N+F P}$ (5)
sensitivity $=\frac{T P}{T P+F N}$ (6)
After explaining how the dataset was collected and which methods were used in this study, the experiments carried out are explained in this section. The overall experiments can be seen at Table 5.
Table 5. The overall experiments
|
1 |
Acquisition of thermal images |
|
2 |
Divide the images into train, validation, and test sets |
|
3 |
Resize images from 480x640 to 224x224 |
|
4 |
Load the pre-trained VGG16 model |
|
5 |
Chance the size of last convolutional layer to two |
|
6 |
Remove the neural layer |
|
7 |
Add Global Average Pooling and a new neural layer |
|
8 |
Train the model |
|
9 |
Test the model |
As can be seen at Table 5, after the acquisition of thermograms, the dataset used in this study was created by using 100 thermograms from 38 different neonates half of them unhealthy and half healthy. To divide the dataset into training, validation, and testing sets 60, 10, and 30 thermograms have been used from each neonate respectively. Therefore totally 2280, 380, and 1140 thermograms have been used for training, validation, and testing sets.
There are some restrictions in pre-trained models such as resizing because they were trained by millions of images with determined sizes such as 224x224 or 299x299 and we cannot change their sizes. Since VGG16 only accepts 224x224 images, all thermograms were resized from 480x640 to 224x224. This situation may cause some information loos while training but the results are obtained over 90% accuracy for our classifications.
To create the model that classifies the thermograms and uncovers the class-related activations, VGG16 was loaded and its last convolutional layer's size was changed from #512 to #2 due to the fact that our desired output's size is two being healthy and unhealthy.
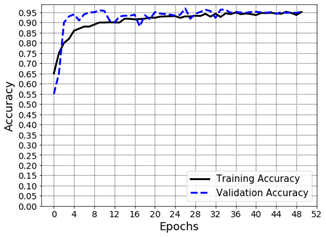
Removing the neural layer coming from the last convolutional layer, the GAP and a new neural layer with softmax were added to the model. Then the hyper-parameters were tuned as can be seen at Table 6 and the training and validation processes started for 50 epochs. As shown in Figure 9 the training and validation accuracies achieved over 95%.
Figure 9. Accuracy values belonging training and validation phases
At first stages of the training, the training and validation accuracies are relatively different due to lack of training computations to be realized. By training the model epoch by epoch the difference between the training and validation accuracy is getting close and at the end they are being the approximately same.
Table 6. All values used in this study
|
The pre-trained model used |
VGG16 |
|
Input size |
224x224 |
|
#Unhealthy neonates’ thermograms |
1900 |
|
#Healthy neonates’ thermograms |
1900 |
|
#Training data |
2280 |
|
#Validation data |
380 |
|
#Testing data |
1140 |
|
Loss function |
Cross Entropy |
|
Optimizer |
RMSprop |
|
Learning rate |
1e-5 |
|
#Epoch |
50 |
|
Training-validation metric |
Accuracy |
|
Testing metrics |
Sensitivity-Specificity |
Table 7. The confusion matrix
|
Confusion Matrix |
Actual Class |
|
|
Class Predicted |
460 |
110 |
|
18 |
552 |
|
After the model was trained, the test set was classified by the model. The obtained confusion matrix can be seen at Table 7. The model classified 460 of 570 thermograms of the unhealthy neonates, and 552 of 570 thermograms of healthy neonates correctly. The sensitivity and specificity, therefore, were obtained as 80.701% and 96.842% respectively. This shows the model has more capability to detect healthy neonates.
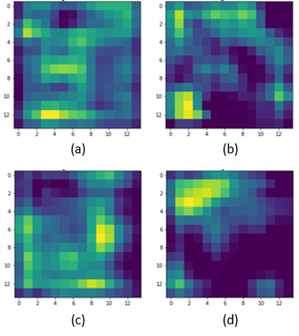
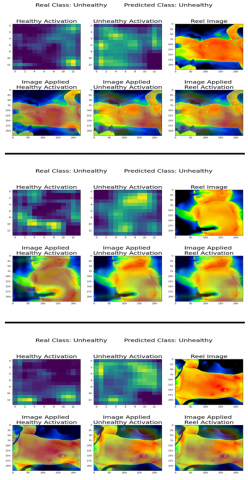
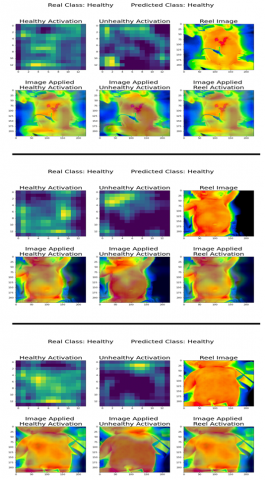
When we come to the activation maps, some randomly selected of them are shown in Figure 10 and Figure 11. Unhealthy neonates were placed in Figure 10, and healthy neonates were placed in Figure 11, and the activations belonging healthy and unhealthy classes are displayed on the images.
Figure 10. The outputs of the CAMs belonging three unhealthy neonates
Figure 11. The outputs of the CAMs belonging three healthy neonates
It is clearly seen that the model tries to find the thermal distributions of neck, armpit, and abdomen regions. Especially for healthy class-related activations the model is looking for armpit regions whereas for unhealthy class-related activations the model is looking for neck and abdomen regions.
These findings show us that the model learn the features of neonates that is meaning it does not look at the unrelated regions such as background. Moreover, related specific class regions are the same for the all thermograms.
Monitoring systems in the medicine are extremely crucial for early diagnosis of diseases and thermal information gives us ability to assess the health status of patients. The thermography method provides temperature values of the related skins, and neonatal monitoring could be realized by using both traditional and advanced ways.
Image classification problems have been solved more efficiently (over 90% accuracy) with the development of deep learning models such as CNNs recently. However, their decision process still keeps its secret and lots of researcher tries to find the answer how CNNs works.
So far CNNs have been used to classify the neonatal thermograms as healthy and unhealthy, but the question of how CNNs have decided could not be known. With the development of CAMs, we’ve been able to see important activations in convolutional layers.
With the realizing study, we both classify the neonates as healthy and unhealthy and show how CNNs makes a decision by using CAMs. To avoid training CNNs from scratch, VGG16 has been used as a pre-trained model; therefore, both time and computational costs decreased.
The developed model classified the thermograms of neonates with 80.701% (sensitivity) and 96.842% (specificity). Due to CAMs requirements such as global average pooling layer, most of the visual information are left at the last layer of the pre-trained model. This shows the model better learns the healthy neonates' thermograms than unhealthy neonates'. Normally we showed in our previous studies that a CNN model classifies both healthy and unhealthy neonatal thermograms with the same performance as about 95% accuracy.
Our main findings about explain-ability show that the CNNs are looking for neck, armpit, and abdomen regions' thermal distribution. Moreover, the class-related activations of the healthy babies are on the armpit and abdomen regions whereas activations of the unhealthy babies are on the neck and abdomen regions.
To conclude, our research results show that:
These results have vital importance for both us and medical specialists because the results show that the CNNs learn the specific regions of neonates being healthy and unhealthy.
In future studies we will be focusing on disease-specific activations and giving their importance for every disease neonates have.
This study was supported by Huawei Turkey R&D Center and the Scientific and Technological Research Council of Turkey (TUBITAK, project number: 215E019).
[1] Glowacz, A., Glowacz, Z. (2017). Diagnosis of the three-phase induction motor using thermal imaging. Infrared Physics & Technology, 81: 7-16. https://doi.org/10.1016/j.infrared.2016.12.003
[2] Amon, F., Hamins, A., Bryner, N., Rowe, J. (2008). Meaningful performance evaluation conditions for fire service thermal imaging cameras. Fire Safety Journal, 43: 541-550. https://doi.org/10.1016/j.firesaf.2007.12.006
[3] Lathlean, J.A., Seuront, L., Ng, T.P. (2017). On the edge: The use of infrared thermography in monitoring responses of intertidal organisms to heat stress. Ecological Indicators, 81: 567-577. https://doi.org/10.1016/j.ecolind.2017.04.057
[4] Topalidou, A., Ali, N., Sekulic, S., Downe, S. (2019). Thermal imaging applications in neonatal care: A scoping review. BMC Pregnancy and Childbirth, 19: 381. https://doi.org/10.1186/s12884-019-2533-y
[5] Borchartt, T.B., Conci, A., Lima, R.C., Resmini, R., Sanchez, A. (2013). Breast thermography from an image processing viewpoint: A survey. Signal Processing, 93: 2785-2803. https://doi.org/10.1016/j.sigpro.2012.08.012
[6] Ornek, A.H., Ceylan, M., Ervural, S. (2019). Health status detection of neonates using infrared thermography and deep convolutional neural networks. Infrared Physics & Technology, 103: 103044. https://doi.org/10.1016/j.infrared.2019.103044
[7] Ervural, S., Ceylan, M. (2021). Convolutional neural networks-based approach to detect neonatal respiratory system anomalies with limited thermal image. Traitement du Signal, 38(2): 437-442. https://doi.org/10.18280/ts.380222
[8] Clark, R., Stothers, J. (1980). Neonatal skin temperature distribution using infrared colour thermography. The Journal of Physiology, 302: 323-333. https://doi.org/10.1113/jphysiol.1980.sp013245
[9] Kliegman, R., Walker, W., Yolken, R. (1993). Necrotizing enterocolitis: Research agenda for a disease of unknown etiology and pathogenesis. Pediatric Research, 34: 701-708. https://doi.org/10.1203/00006450-199312000-00001
[10] Nur, R. (2014). Identification of thermal abnormalities by analysis of abdominal infrared thermal images of neonatal patients. Ph.D. thesis Carleton University.
[11] Abbas, A.K., Heimann, K., Blazek, V., Orlikowsky, T., Leonhardt, S. (2012). Neonatal infrared thermography imaging: Analysis of heat flux during different clinical scenarios. Infrared Physics & Technology, 55: 538-548. https://doi.org/10.1016/j.infrared.2012.07.001
[12] Abbas, A.K., Heimann, K., Jergus, K., Orlikowsky, T., Leonhardt, S. (2011). Neonatal non-contact respiratory monitoring based on real-time infrared thermography. Biomedical Engineering Online, 10: 93. https://doi.org/10.1186/1475-925X-10-93
[13] Knobel-Dail, R.B., Holditch-Davis, D., Sloane, R., Guenther, B., Katz, L.M. (2017). Body temperature in premature infants during the first week of life: Exploration using infrared thermal imaging. Journal of Thermal Biology, 69: 118-123. https://doi.org/10.1016/j.jtherbio.2017.06.005
[14] Gunning, D., Stefik, M., Choi, J., Miller, T., Stumpf, S., Yang, G.Z. (2019). XAI—Explainable artificial intelligence. Science Robotics, 4(37): eaay7120. https://doi.org/10.1126/scirobotics.aay7120
[15] Lei, S. (2012). A feature selection method based on information gain and genetic algorithm. In 2012 International Conference on Computer Science and Electronics Engineering, 2: 355-358. https://doi.org/10.1109/ICCSEE.2012.97
[16] Safavian, S.R., Landgrebe, D. (1991). A survey of decision tree classifier methodology. IEEE Transactions on Systems, Man, and Cybernetics, 21: 660-674. https://doi.org/10.1109/21.97458
[17] Zhou, B., Khosla, A., Oliva, A., Torralba, A. (2016). Learning deep features for discriminative localization. 2016 IEEE Conference on Computer Vision and Pattern Recognition (CVPR), pp. 2921-2929. https://doi.org/10.1109/CVPR.2016.319
[18] Muhammad, M.B., Yeasin, M. (2020). Eigen-CAM: Class activation map using principal components. In 2020 International Joint Conference on Neural Networks (IJCNN), pp. 1-7. https://doi.org/10.1109/IJCNN48605.2020.9206626
[19] Patro, B.N., Lunayach, M., Patel, S., Namboodiri, V.P. (2019). U-cam: Visual explanation using uncertainty based class activation maps. 2019 IEEE/CVF International Conference on Computer Vision (ICCV), pp. 7444-7453. https://doi.org/10.1109/ICCV.2019.00754
[20] Krizhevsky, A., Sutskever, I., Hinton, G.E. (2017). ImageNet classification with deep convolutional neural networks. Communications of the ACM, 60(6): 84-90. https://doi.org/10.1145/3065386
[21] Dollar, P., Tu, Z., Tao, H., Belongie, S. (2007). Feature mining for image classification. In 2007 IEEE Conference on Computer Vision and Pattern Recognition, pp. 1-8. https://doi.org/10.1109/CVPR.2007.383046
[22] Saeys, Y., Inza, I., Larrañaga, P. (2007). A review of feature selection techniques in bioinformatics. Bioinformatics, 23: 2507-2517. https://doi.org/10.1093/bioinformatics/btm344
[23] Xie, M., Jean, N., Burke, M., Lobell, D., Ermon, S. (2016). Transfer learning from deep features for remote sensing and poverty mapping. arXiv:1510.00098.
[24] Iandola, F.N., Han, S., Moskewicz, M.W., Ashraf, K., Dally, W.J., Keutzer, K. (2016). SqueezeNet: AlexNet-level accuracy with 50x fewer parameters and <0.5 mb model size. arXiv preprint arXiv:1602.07360
[25] Szegedy, C., Ioffe, S., Vanhoucke, V., Alemi, A. (2016). Inception-v4, inception-ResNet and the impact of residual connections on learning. arXiv preprint arXiv:1602.07261.
[26] Qin, Z., Zhang, Z., Chen, X., Wang, C., Peng, Y. (2018). Fd-mobilenet: Improved mobilenet with a fast downsampling strategy. In 2018 25th IEEE International Conference on Image Processing (ICIP), pp. 1363-1367. https://doi.org/10.1109/ICIP.2018.8451355
[27] Simonyan, K., Zisserman, A. (2014). Very deep convolutional networks for large-scale image recognition. arXiv preprint arXiv:1409.1556.
[28] Hsiao, T.Y., Chang, Y.C., Chou, H.H., Chiu, C.T. (2019). Filter-based deep-compression with global average pooling for convolutional networks. Journal of Systems Architecture, 95: 9-18. https://doi.org/10.1016/j.sysarc.2019.02.008
[29] Kouretas, I., Paliouras, V. (2019). Simplified hardware implementation of the softmax activation function. In 2019 8th International Conference on Modern Circuits and Systems Technologies (MOCAST), pp. 1-4. https://doi.org/10.1109/MOCAST.2019.8741677