Davide Borelli | Francesco Devia | Corrado Schenone* | Federico Silenzi | Federico Sollai | Luca A. Tagliafico
OPEN ACCESS
The use of Liquefied Natural Gas (LNG) is crucial for reaching the pollution reduction objectives that have been set by the new European laws. The widespread use of LNG allows for the reduction of air-polluting emissions in many fields, from residential to industrial and transport sectors. The European Project SIGNAL is aimed towards supporting and bolstering the diffusion of LNG usage, especially in port areas and in regions that are not connected to the main continental NG network (e.g. islands or border regions) where LNG is still a convenient alternative to the construction of distribution infrastructures. Considering that the impact of primary LNG consumption is strongly affected by the efficiency of technologies employed in energy conversion, it differs from sector to sector and from country to country. For this reason, it is useful to evaluate the environmental benefits deriving from the conversion to LNG fed technologies, to assess the effective emission reductions. In the present paper, a simple yet fast and reliable methodology to assess the environmental benefits is presented. The methodology is relying on the application of the Emission Factors available on the Emission Factor Database developed by the European Union, integrated with other national databases or literature studies, in case of lacking data. Moreover, in the present paper, the case study of Regione Sardegna is presented. Starting from the regional energy needs, it is possible to evaluate the current emissions levels amount for five selected pollutants (PM 2.5, PM10, CO, CO2, NOx, SOx). Then, two different scenarios are forecasted, with a 10-year timespan: a low LNG widespread and a high penetration one. Then, the emission levels for the two cases are evaluated and compared to the base case. Overall, the use of LNG is helpful towards the reduction of air emissions, especially for PM2.5, PM10, and SOx. The emissions for CO and NOx can anyway increase up to 5.5% when a single sector is analyzed, depending on the level of technology development of the considered sector.
Liquefied Natural Gas (LNG) is a mix of different hydrocarbons (mainly methane) that offers an alternative to standard fossil fuels. In the last years, the share of LNG traded worldwide has increased, bolstered by the worldwide environmental policies that are becoming stricter in terms of pollutant emissions. While LNG is still a fossil fuel, it offers advantages during combustion with respect to traditional fossil derivatives [1].
For instance, Hardisty et al. [2] found that, on average, conventional LNG burned in a conventional open cycle gas turbine (OCGT) plant produces approximately 38% less greenhouse gas emissions over its life cycle than black coal burned in a sub-critical plant, per MWh of electricity produced. The emission gap is lower if the LNG turbine cycle is compared to more modern and efficient ultra-supercritical coal powered plant. A comparative study carried out by Jaramillo et al. [3] aims to compare greenhouse gas (GHG), SOx, and NOx life-cycle emissions of electricity generated with Natural Gas, Liquefied Natural Gas and Synthetic Natural Gas and coal. The study suggests that, considering the present technologies of power plants, a mix of domestic NG, LNG, and SNG would have lower GHG emissions than coal. If carbon capture and sequestration (CCS) are used, however, coal and a mix of domestic NG, LNG, and SNG would have very similar life-cycle GHG emissions. For SOx and NOx, the study finds that there are significant emissions in the upstream stages of the natural gas life cycles. Arteconi et al. [4] proposes a study to outline the potential of LNG as vehicle fuel, highlighting positive and negative aspects. The study also compares the different supply options with reference to the Italian scenario, considering the suitability of local liquefaction. The analysis shows that, up to a terminal distance of 2000 km from the refuelling station, the purchase of LNG at regasification terminals is convenient. On the other hand, local liquefaction demands for process efficiency higher than 70%, low NG price and specific liquefaction technology. Oshima et al. [5] explored the opportunity to exploit the LNG regassification process, recovering cold exergy, to produce liquid hydrogen. They study a regasification system able to supply liquid hydrogen (LH2) and LNG for a 1000 MW power station. The electricity generator is coupled to a cryogenic-type Stifling Engine, which operates between room temperature and gases (LH2 or LNG) temperatures. The authors prove the system feasibility performing tests on a small-scale demonstrator. The possibility of recovering regassification exergy is studied also by Messineo et al. [6]: the authors studied the feasibility of coupling a LNG regassification system to a liquid carbon dioxide network distribution capable of supplying cold to the different facilities. They analysed the possibility of integrating this LNG regasification plant in a highly agricultural zone in Sicily. This would increase the efficiency of the agronomical food production, lower transformation, and conservation costs, compared to the traditional systems. Moreover, the proposed solution brings economic and environmental benefits to the interested areas. Another interesting application for recovering the exergy available during LNG regassification is proposed by Dispenza et al. [7] and [8]. The authors proposed to exploit a cryogenic stream of LNG during regasification as a cold source coupled to a combined heat and power (CHP) plant. The authors give an estimate of the appropriate regasification capacity of the modular units equal to 2∙109 SMC/year. In the follow-up paper, the authors propose some feasibility studies based on thermodynamic and economic analysis. The study aims toward the demonstration of the proposed plant layout feasibility. In this framework, it can be useful to analyse in depth the environmental benefits deriving from the adoption of LNG based technologies, in order to determine in a quantitative way, the amount of avoided pollutant emissions. In this paper, basing on real final energy demand data for the Italian Region Sardinia, an estimation of the environmental benefits bound to the widespread use of LNG is given. The analysis was carried out separately for different sectors (residential, tertiary, industrial, transport and thermoelectrical production), considering different pollutants. Moreover, it is based on the confrontation between the emission levels calculated for three different scenarios: the present-day situation (2019), and two forecasted scenarios (2030).
This paragraph is devoted to illustrating the methodology followed to assess the environmental benefits of adopting LNG as fuel as a replacement for traditional fossil derivatives, such as diesel, LPG, coal, etc.
2.1 Final energy consumption
The starting point for such an analysis is to collect data on the final energy consumption for the area under analysis. This information is usually made available by energy resource managers, public authorities, or local authorities. These data are essential to be able to define the current situation in terms of final energy consumption: they are necessary to provide all the information required to characterize the energy needs profiles of the sectors analyzed.
The more detailed the analysis, the more disaggregated and sector-specific the data must be. In particular, it is necessary to know the mix of fuels that are used to meet the sector-specific primary energy demand. This is very important to be able to define in advance what data are necessary to continue the analysis (characteristics of fuels, pollutants, emission factors).
For this analysis, the final energy consumption considered, for the Sardinia Region, has been shown in Table 1 the reference year is 2019.
The data given in Table 1 represent the current scenario in terms of emission levels used for the pollutants considered. These data are used as a benchmark to assess the possible environmental benefits related to the transition to the more widespread use of LNG as fuel.
Table 1. Sardinia Region final energy consumption for the year 2019
|
Residential |
||
|
Diesel Oil |
94 |
ktep |
|
Liquid Petroleum Gas |
106 |
ktep |
|
Tertiary |
||
|
Diesel Oil |
8 |
ktep |
|
Liquid Petroleum Gas |
8 |
ktep |
|
Industrial |
||
|
Coke Coal |
75 |
ktep |
|
Combustible Oil |
75 |
ktep |
|
Liquid Petroleum Gas |
35 |
ktep |
|
Marine Transport |
||
|
Marine Total |
185 |
ktep |
|
Marine Gas Oil |
157.25 |
ktep |
|
Marine Diesel Oil |
27.75 |
ktep |
2.2 Emission factors
The second key element for the correct methodological approach of this analysis is the identification of emission factors. In general, emission factors are considered as coefficients which, multiplied by a value expressing either the amount of energy or the amount of fuel requested, make it possible to obtain an estimate of the pollutant released into the environment as a result of the process under analysis.
From this it can be deduced that the emission factors are very specific, they must therefore be chosen carefully:
Such a detailed approach is not always applicable, especially in the case of large-scale analysis. The emission factors used in this analysis were taken from the "EMEP/EEA air pollutant emission inventory guidebook 2019" [9] which is connected to an extensive database containing emission factors for many sectors (civil, industrial, mining, chemicals, transport, etc.) as well as for many pollutants (carbon monoxide, Sulphur and nitrogen oxides, VOC, heavy metals, particulate matter, and many others). The database also provides different levels of detail and increasing specificity for the determination of emission factors, called TIER 1, TIER 2, TIER3.
In this paper, since the scale of the analysis is as big as an entire Italian region, the emission factors have been chosen among TIER 1, which are determined by considering a production technology and abatement system typical for the analyzed sector. The TIER 1 approach groups fuels into macro-categories that allow easier aggregation of emission factors.
It is important to note that, for carbon dioxide, the EMEP/EEA Handbook does not provide emission factor values. For this reason, it was also necessary to consider a secondary source which provided the missing data [10].
As far as the marine sector is concerned, it was necessary to further integrate the information available on the EMEP/EEA handbook, as the document did not contain emission factors for carbon dioxide, as well as for LNG-powered ships. For CO2, considering marine fuel (both marine diesel and gas oil) the reference emission factor values are extracted from the 2014 International Marine Organization Directive [11]. Missing information on emission factors for LNG-powered ships has been taken from the literature [12]. Considering MDO (marine diesel oil) and MGO (marine gas oil), the emission factors have been calculated as a percentage of the correspondent pollutant in case of fossil fuel-powered ships [12]. The calculations for carbon monoxide emissions have not been considered, for LNG-powered ships. This is because the emissions for this pollutant are closely dependent on the type of engine: to consider a ship that is natively fed by LNG is very different from considering a ship whose engine has been converted from combustible oils to the use of natural gas.
2.2.1 Emissions Calculation – Current situation
At this point it is possible to carry out the emissions assessment, performing the calculations according to the sector in question, the fuel used, and the pollutant analyzed. The total annual mass for each pollutant can be summarized by Eq. (1):
$M_{\text {pollutant,year }}=E F_{\text {pollutant }} \cdot C_{\text {energy.year }}$ (1)
where:
The emission factor can be expressed as a ratio of masses (e.g. kg/tonfuel): in this case, it must be multiplied by the total fuel mass used yearly, thus the fuel specific Lower Calorific Value (LCV) must be considered.
For the sake of brevity, Table 2 gives an example of the calculations performed for the residential and tertiary sectors, using the emission factors presented in Appendix A. Energy consumption refers to the values presented in Table 1.
It is important to point out that the "Large-scale thermoelectric production" sector and the "Terrestrial Transport" sector are not analyzed on this paper, but they will be in a future paper.
In Table 3 are listed the emissions globally emitted, broken down by type of pollutant, during the year 2019 for the Sardinia Region.
Table 2. Example of calculation of total annual emissions, industrial sector
|
Marine Transport |
||||||
|
Marine Gas Oil |
153825.7 |
ton |
Pollutant |
Emission Factor |
UM |
Emission [ton] |
|
1828817500 |
kWh |
PM2.5 |
1.4 |
kg/tonne fuel |
215.3 |
|
|
PM10 |
1.5 |
kg/tonne fuel |
230.7 |
|||
|
NOx |
78.5 |
kg/tonne fuel |
12075.3 |
|||
|
SOx |
20 |
kg/tonne fuel |
3076.5 |
|||
|
CO |
7.4 |
kg/tonne fuel |
1138.3 |
|||
|
CO2 |
3.144 |
t CO2/tonne fuel |
483628.2 |
|||
|
Marine Diesel Oil |
27145.7 |
ton |
Pollutant |
Emission Factor |
UM |
Emission [ton] |
|
322732500 |
kWh |
PM2.5 |
1.4 |
kg/tonne fuel |
38.0 |
|
|
PM10 |
1.5 |
kg/tonne fuel |
40.7 |
|||
|
NOx |
78.5 |
kg/tonne fuel |
2130.9 |
|||
|
SOx |
20 |
kg/tonne fuel |
542.9 |
|||
|
CO |
7.4 |
kg/tonne fuel |
200.9 |
|||
|
CO2 |
3.206 |
t CO2/tonne fuel |
87029.2 |
|||
Table 3. Total emissions Sardinia Region for the year 2019
|
Total emissions per pollutant, present situation |
UM |
|
|
PM2.5 |
329.9 |
Ton |
|
PM10 |
374.1 |
Ton |
|
NOx |
15524.8 |
Ton |
|
SOx |
5659 |
Ton |
|
CO |
1603.2 |
Ton |
|
CO2 |
3.4 |
Mton |
2.2.2 Emissions calculation – "Base" and "High Penetration" scenarios
Operatively, the methodology for calculating emissions when future scenarios are considered, is the same as that explained in the previous paragraph and consists in the application of the EQ. (1). The main difference consists in the mix of fossil fuels and LNG that is forecasted to cover the energy needs of the Sardinia Region, projected according to two different scenarios (Base and High Penetration) over a time horizon of 10 years (2030). Thus, two different evolution scenarios are analyzed. The "BASE" scenario imagines that there are basically no special measures to support the transition to LNG, also environmental policy measures (SECA areas, ARERA regulatory framework, PNIEC provisions) are not respected. In contrast, the "HIGH PENETRATION (AP)" scenario assumes that support measures are fostered for boosting the dissemination of LNG and CNG, and the implementation of all environmental policy measures planned are highly enforced.
Two comparisons were made: present situation vs BASE scenario and present situation vs AP scenario. From the results comparison it is possible to assess the environmental benefits in terms of avoided emissions.
Table 4. Final energy consumption projected for 2030 according to the forecasted scenarios
|
BASE SCENARIO |
HIGH PENETRATION |
||||
|
Residential |
Residential |
||||
|
Diesel Oil |
74 |
ktep |
Diesel Oil |
42.5 |
ktep |
|
LNG |
20 |
ktep |
LNG |
51.5 |
ktep |
|
LPG |
86 |
ktep |
LPG |
54.5 |
ktep |
|
LNG |
20 |
ktep |
LNG |
51.5 |
ktep |
|
Tertiary |
Tertiary |
||||
|
Diesel Oil |
3 |
ktep |
Diesel Oil |
0 |
ktep |
|
LNG |
5 |
ktep |
LNG |
8 |
ktep |
|
LPG |
3 |
ktep |
LPG |
0 |
ktep |
|
LNG |
5 |
ktep |
LNG |
8 |
ktep |
|
Industrial |
Industrial |
||||
|
COKE Oil |
31.5 |
ktep |
COKE Oil |
12.5 |
ktep |
|
LNG |
43.5 |
ktep |
LNG |
62.5 |
ktep |
|
Combustible Oil |
31.5 |
ktep |
Combustible Oil |
12.5 |
ktep |
|
LNG |
43.5 |
ktep |
LNG |
62.5 |
ktep |
|
LPG |
15 |
ktep |
LPG |
8 |
ktep |
|
LNG |
20 |
ktep |
LNG |
27 |
ktep |
|
Transport |
Transport |
||||
|
Marine Gas Oil |
143.4 |
ktep |
Marine Gas Oil |
98.0 |
ktep |
|
LNG |
13.9 |
ktep |
LNG |
59.2 |
ktep |
|
Marine Diesel Oil |
13.9 |
ktep |
Marine Diesel Oil |
12.9 |
ktep |
|
LNG |
13.9 |
ktep |
LNG |
14.8 |
ktep |
For both scenarios forecasted, is essential to identify the sector specific shares of energy mix that can be replaced by LNG. Thanks to these projections, it is possible to calculate the new energy consumption mix for the proposed scenarios. This is a key step, necessary for the assessment of the atmospheric emissions avoided.
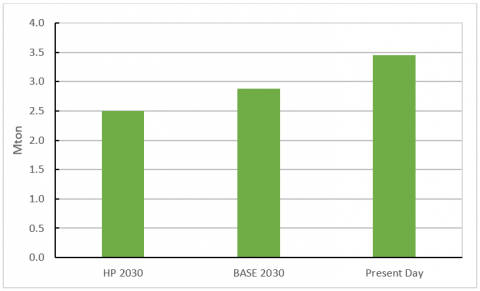
This part of the document describes the aggregated results of the environmental analysis, obtained by direct comparison between the emissions calculated in the three scenarios presented and described above. Due to the great diversity between orders of magnitude, the results for CO2 emissions are presented separately.
The percentage variation with respect to the current situation, shown in Table 5, are calculated:
Table 5. Percentual variation in total annual emissions
|
Percentual Variation |
|||
|
PRESENT 2019 |
BASE 2030 |
HP 2030 |
|
|
PM2.5 |
- |
-23.2 |
-45.6 |
|
PM10 |
- |
-25.3 |
-42.4 |
|
NOx |
- |
-12.8 |
-21.4 |
|
SOx |
- |
-28.0 |
-44.8 |
|
CO |
- |
-14.7 |
-35.3 |
|
CO2 |
- |
-16.4 |
-27.6 |
As can be seen, emissions are reduced for all the pollutants considered, with a considerable reduction in emissions of particulate matter and Sulphur oxides. This is due to the reduction in diesel and heavy fuel consumption.
Figure 1. CO2 emissions for the three scenarios analyzed
Bearing in mind the results obtained and illustrated in the previous paragraphs, it can be said that, especially for the residential, tertiary, industrial and maritime transport sectors, pollutant emissions are reduced by the adoption of new LNG-based technologies, replacing traditional fossil fuels. This applies for every scenario considered (base and high penetration).
The adoption of LNG as a transition fuel towards a greener energy economy seems to be the most natural prosecution of the pathway that is being tracked by European and world-wide legislations.
[1] Kumar, S., Kwon, H.T., Choi, K.H., Lim, W., Cho, J.H., Tak, K., Moon, I. (2011). LNG: An eco-friendly cryogenic fuel for sustainable development. Applied Energy, 88(12): 4264-4273. https://doi.org/10.1016/j.apenergy.2011.06.035
[2] Hardisty, P.E., Clark, T.S., Hynes, R.G. (2012). Life cycle greenhouse gas emissions from electricity generation: A comparative analysis of Australian energy sources. Energies, 5(4): 872-897. https://doi.org/10.3390/en5040872
[3] Jaramillo, P., Griffin, W.M., Matthews, H.S. (2007). Comparative life-cycle air emissions of coal, domestic natural gas, LNG, and SNG for electricity generation. Environmental Science & Technology, 41(17): 6290-6296. https://doi.org/10.1021/es063031o
[4] Arteconi, A., Polonara, F. (2013). LNG as vehicle fuel and the problem of supply: The Italian case study. Energy Policy, 62: 503-512. https://doi.org/10.1016/j.enpol.2013.08.016
[5] Oshima, K., Ishizaki, Y., Kamiyama, S., Akiyama, M., Okuda, M. (1978). The utilization of LH2 and LNG cold for generation of electric power by a cryogenic type Stirling engine. Cryogenics, 18(11): 617-620. https://doi.org/10.1016/0011-2275(78)90024-3
[6] Messineo, A., Panno, G. (2011). LNG cold energy use in agro-food industry: A case study in Sicily. Journal of Natural Gas Science and Engineering, 3(1): 356-363. https://doi.org/10.1016/j.jngse.2011.02.002
[7] Dispenza, C., Dispenza, G., La Rocca, V., Panno, G. (2009). Exergy recovery during LNG regasification: Electric energy production–Part one. Applied Thermal Engineering, 29(2-3): 380-387. https://doi.org/10.1016/j.applthermaleng.2008.03.036
[8] Dispenza, C., Dispenza, G., La Rocca, V., Panno, G. (2009). Exergy recovery during LNG regasification: Electric energy production–part two. Applied Thermal Engineering, 29(2-3): 388-399. https://doi.org/10.1016/j.applthermaleng.2008.03.035
[9] EMEP/EEA air pollutant emission inventory guidebook 2019 — European Environment Agency. https://www.eea.europa.eu/publications/emep-eea-guidebook-2019.
[10] Fattori di emissione per la produzione ed il consumo di energia elettrica in Italia — Italiano. Available: http://www.sinanet.isprambiente.it/it/sia-ispra/serie-storiche-emissioni/fattori-di-emissione-per-la-produzione-ed-il-consumo-di-energia-elettrica-in-italia/view.
[11] IMO. (2014). Mepc.245(66) - 2014 Guidelines on the Method of Calculation of the Attained Energy Efficiency Design Index (Eedi) for New Ships. Int. Marit. Organ, 245: 1-30.
[12] Alanen, J., Isotalo, M., Kuittinen, N., Simonen, P., Martikainen, S., Kuuluvainen, H. (2020). Physical Characteristics of Particle Emissions from a Medium Speed Ship Engine Fueled with Natural Gas and Low-Sulfur Liquid Fuels. Environmental Science & Technology, 54(9): 5376-5384. https://doi.org/10.1021/acs.est.9b06460