Vincenzo Costanzo* | Gianpiero Evola | Antonio Gagliano | Luigi Marletta | Francesco Nocera
OPEN ACCESS
In the framework of the ongoing EU-funded innovation project called e-SAFE (energy and Seismic Affordable rEnovation solutions), several solutions for the energy and seismic deep renovation of reinforced-concrete (RC) framed buildings in the EU countries are going to be developed and demonstrated. One of these solutions makes use of cross laminated timber (CLT) panels connected to the existing RC frame through specifically designed dampers to increase the seismic and energy performances of the existing envelope.
This paper aims to preliminary assess the hygrothermal performance of such CLT panels when applied to various typical wall structures under different climate conditions in Italy through numerical simulations carried out according to the EN 13788 Standard and considering various indoor vapor production classes. Results show that the most problematic existing wall structures are uninsulated concrete walls, for which a risk of surface condensation and mold growth is predicted in all climate zones because of their low thermal resistance (U-value of 3.55 W·m-2·K-1), followed by uninsulated solid brick walls (U-value of 1.81 W·m-2·K-1). The application of CLT panels is found to not only significantly improve the thermal behaviour of the walls, but also to eliminate any surface and interstitial condensation issues in all climate zones.
CLT panels, EN 13788 Standard, hygrothermal analysis, walls retrofit solutions
In 2018, the amendment to the Energy Performance of Buildings Directive (EPBD) stated that each Member State shall establish a long-term strategy for the renovation of their national building stock so as to facilitate the cost-effective transformation of existing buildings into nearly zero-energy buildings. In particular, the States are committed to define a roadmap leading to the reduction of greenhouse gases (GHG) in the EU by 80-95% by 2050 compared to 1990 levels [1]. Residential and non-residential buildings are currently responsible for 40% of the final energy demand in the EU, and for approximately 36% of all emissions of GHG. In order to reach these ambitious targets, deep renovation of the existing EU building stock is sought. In particular, according to the EU building stock observatory, around 78% of the residential buildings in the EU have been constructed before 1990 [2]. Moreover, about 35% of the EU buildings are over 50 years old, and almost 75% are highly energy inefficient [3]. Despite the urgent need to improve the energy efficiency of the EU building stock, the renovation rate is still highly unsatisfactory [3]. Furthermore, energy efficiency is not the only problem faced by the European building stock because about 50% of the European territory is earthquake-prone [4]. In these countries, energy renovation actions must therefore strategically combine with seismic retrofitting.
In this framework, the ongoing EU-funded innovation project called e-SAFE (energy and Seismic Affordable rEnovation solutions) addresses various solutions for the combined energy and seismic deep renovation of residential reinforced-concrete (RC) framed buildings in the EU. One of these solutions makes use of cross-laminated timber (CLT) panels connected to the existing RC frame to increase the seismic and energy performance of the existing envelope. This research presents preliminary results concerning the thermal and hygrometric analysis of CLT panels when applied to existing wall structures located in different climate zones in Italy, by following the calculation procedures set by EN 13788 Standard [5].
The use of CLT panels for structural reinforcement and energy refurbishment of existing buildings has shown great potential thanks to the high strength and stiffness of this engineered wood product as well as to its low thermal conductivity [6, 7]. CLT panels coupled with a further insulation layer and different finishing materials have been investigated in replacement of the existing masonry infill walls of RC framed buildings with the main purpose of increasing the overall lateral stiffness of the structure [8]. On the other hand, the same integrated system has been proposed also in addition to existing external walls by realizing the connection to the bearing RC structure through ad hoc dissipative devices [9]. This last arrangement well meets the current renovation requirements of quick installation, cost effectiveness, low-disruption, use of low-carbon materials, and reversibility. However, these studies are still at a preliminary stage and further investigations are needed.
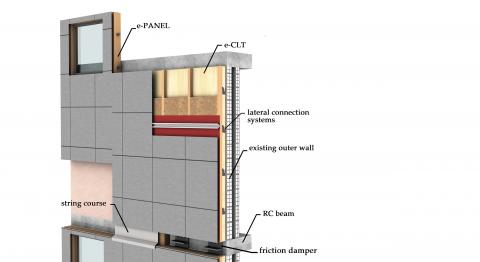
The CLT system envisaged in the e-SAFE project and called e-CLT consists in the application of prefabricated CLT panels to the outer side of the existing walls by connecting them to the RC structure through innovative dissipative devices (the friction dampers shown in Figure 1, [6]). The e-CLT system is conceived so that in occurrence of moderate ground motions, the dampers rigidly connect CLT panels to the RC structure, thus making available additional lateral stiffness and strength.
e-CLT integrates both local bio-based recyclable (or recycled) insulating materials and customizable cladding finishing solutions. Size and number of CLT panels to be applied on the façade are determined based on the initial seismic deficiency of the building and the assumed target performance. The result is a new performing envelope applied on the existing one, which concurrently aims at improving the energy, seismic and aesthetic performance of the renovated building (see Figure 1).
Figure 1. e-CLT connection to existing walls [6]
The assessment of the thermal and hygrometric behavior of the e-CLT solution for the refurbishment of existing wall structures is made through the methods prescribed by the EN 13788 Standard [5] and considering different climate conditions and indoor vapor concentrations. The hygrothermal risk assessment of the various wall assemblies is carried out through the freeware software PAN v.7.1.0.4, a tool developed by the Italian National Association for Thermal Insulation (ANIT) that complies with all the relevant European and National Standards [10].
3.1 Typical Italian wall structures analyzed as reference
The wall structures considered in this study are some of those listed in the final report of the EU Tabula project [11], since they are representative of a large share of existing walls for the non-historic Italian residential building stock. In detail, the investigated walls are:
The thermophysical properties of the materials used in the various wall assemblies, along with those pertaining to CLT panels, are listed in Table 1 and are gathered from the EN ISO 10456:2007 Standard [12].
Table 1. Thermophysical properties of the wall assemblies’ materials
|
Material |
Density ρ (kg∙m-3) |
Thermal conductivity λ (W∙m-1∙K-1) |
Specific heat Cp (J∙kg-1∙K-1) |
Water vapour resistance μ (-) |
|
External plaster |
1800 |
0.90 |
1000 |
10 |
|
Internal plaster |
1400 |
0.70 |
1000 |
10 |
|
Solid brick |
1800 |
0.72 |
1000 |
10 |
|
Wooden-based insulating layer |
50 |
0.038 |
2100 |
1 |
|
Hollow clay brick |
800 |
0.40 |
1000 |
10 |
|
Still air gap (vertical, 2 cm) |
1 |
0.11* |
1004 |
1 |
|
Still air gap (vertical, 3 cm) |
1 |
0.16* |
1004 |
1 |
|
Still air gap (vertical, 7 cm) |
1 |
0.38* |
1004 |
1 |
|
Reinforced concrete |
2400 |
2.00 |
1000 |
80 |
|
External wooden cladding |
1350 |
0.28 |
1674 |
110 |
|
CLT panel |
420 |
0.12 |
1600 |
60 |
*this is the equivalent thermal conductivity corresponding to a thermal resistance of 0.18 m2∙K∙W-1
3.2 Hygrothermal assessment
3.2.1 EN 13788 method
Surface condensation and mold growth on the internal surface of building components are directly linked with their surface temperature. This in turn depends on the U-value of the components, the presence of thermal bridges and the psychrometric conditions of indoor air.
The standard approach employed to assess the risk of surface condensation and mold growth is defined in the European Standard EN ISO 13788 [5]. Here, the so called “temperature factor” (otherwise known as f-factor), is defined as a bulk index that describes the thermal quality of an envelope component in terms of surface condensation and mold formation avoidance, and can be calculated as follows:
${{f}_{RSI}}=\frac{{{T}_{si}}-{{T}_{o}}}{{{T}_{op}}-{{T}_{o}}}$ (1)
Being TSI the risk surface temperature, TO the outdoor air temperature and TOP the indoor operative temperature (℃).
Operatively speaking, the f-factor calculated for the analyzed component is then compared with a minimum allowable temperature factor fRSI,min, derived by imposing a threshold condition to the surface relative humidity. The critical relative humidity value considered in Italy is 80%.
However, condensation can also take place in the inner layers of a building component, and as such, it would not be visible from the outside. It is the case of interstitial condensation, which can be triggered by various complex physical phenomena like vapour convection and vapour diffusion when the water is in its gaseous state, or by capillary transport and surface diffusion when the water is in its liquid state.
Notwithstanding such a complexity, the approach prescribed by the EN ISO 13788 Standard only considers the vapour diffusion mechanism generated by the difference in partial vapour pressure between the indoors and the outdoors.
The specific flux of water vapour through a material layer of a building component can then be appraised through the Fick’s diffusion equation as follows:
$g={{\delta }_{0}}\cdot \frac{{{p}_{i}}-{{p}_{o}}}{{{s}_{D}}}$ (2)
Here, δ0 is the water vapour permeability of air (187.5∙10-12 kg∙m-1∙s-1∙Pa-1), pi and pO are the indoor and outdoor water vapour partial pressure (Pa) respectively, and sD is the equivalent air layer thickness (m) for water vapour diffusion. The latter one is defined as the product of a layer’s material thickness (m) by its vapour resistance factor μ (-), a non-dimensional quantity that expresses the resistance opposed to water vapour diffusion by a material compared to still air (the higher the value, the higher the resistance to the flow).
The water vapour contained in the air and flowing through a square meter of a building material can eventually condensate, i.e. changing its state from vapour to liquid, if its partial vapour pressure reaches the corresponding saturation pressure pS (Pa), a quantity that depends only on the material’s temperature.
For a multi-layer construction assembly, the EN 13788 Standard recommends to follow the so-called Glaser’s method, which accounts for these mechanisms.
3.2.2 Boundary conditions for hygrothermal assessment
It is necessary to first set reference climate conditions indoors and outdoors, which can be made relying on the EN ISO 15927-1:2004 Standard [13]. Various locations in Italy – ranging from warm to cold – are thus investigated according to their Heating Degree Days (HDD). In fact, HDD provide a simple yet effective measure of the severity of a specific climate. HDD are defined as the summation of all the positive differences between a conventional indoor set point temperature (Ti) and the average daily outdoor air temperature (To) over a defined period. In Italy, the conventional indoor set point temperature is fixed to 20℃, while the various areas have been classified into six climate zones ranging from A (warmest) to F (coldest) according to their HDD (see Table 2). This classification is dictated by the Presidential Decree n. 412 of the 26th August 1993 [14] and determines the conventional heating period of buildings, as reported in Table 2.
Table 2. Climate zones considered in the analysis
|
Climate zone |
Representative city and relative HDD (°C∙day) |
Heating period |
|
A |
Lampedusa (588) |
December 1st – March 15th |
|
B |
Catania (833) |
December 1st – March 31st |
|
C |
Naples (1034) |
November 15th – March 31st |
|
D |
Rome (1415) |
November 1st – April 15th |
|
E |
Bologna (2259) |
October 15th – April 15th |
|
F |
Cuneo (3012) |
Throughout the year when needed |
For each city representative of the Italian climate zones, the average monthly climate conditions gathered from the Italian Standard series UNI 10349:2016 [15] are used to derive the corresponding indoor conditions as dictated by the EN ISO 13788 Standard [5] for walls exposed to outdoor conditions.
The assessment of indoor conditions is carried out considering a worst-case scenario, i.e. supposing a heating system able to provide sensible heating only and not to manage latent heat. This means that indoor relative humidity is expected to rise, especially in case of high occupancy rate and high vapour production from the occupants, which depends on their activity.
More in detail, indoor air temperature is set to 20℃ during the heating periods listed in Table 2, while it coincides with the outdoor air temperature value in the remaining of the year (a lower threshold of 18℃ applies in case of particularly cold outdoor conditions). As for indoor relative humidity values, these are derived by adding to the vapour partial pressure in the outdoor a contribution associated to indoor vapour sources, as a function of the intended use of the indoor space (e.g., offices, spaces with or without a mechanical ventilation system, kitchens, etc.) and the average monthly outdoor air temperature.
Since internal vapour production can significantly influence the hygrothermal performances of the walls, in this research both the suggested “vapour class production 3” – houses without mechanical ventilation and with unspecified occupancy pattern – and the more demanding “class production 4” – gyms, kitchens and canteens – are taken into account. This allows performing a sensitivity analysis of mould growth, surface condensation and interstitial condensation risks to indoor humidity values.
Finally, the amount of condensate that is detected in the various assemblies’ layers is compared against the threshold values set by the EN ISO 13788 Standard and reported in Table 3 that, in any case, should be below the suggested value of 500 g∙m-2.
Table 3. Threshold values for interstitial condensation for various construction materials
|
Material |
Density ρ (kg∙m-3) |
Maximum condensate (g∙m-2) |
|
Clay |
600–2000 |
≤ 500 |
|
Concrete |
400–2400 |
≤ 500 |
|
Wood and derived materials |
500–800 |
≤ 30·ρ·s |
|
Plasters and mortars |
600–2000 |
≤ 30·ρ·s |
|
Organic fibers with waterproof glue |
300–700 |
≤ 20·ρ·s |
|
Organic fibers with non-waterproof glue |
300–700 |
≤ 5·ρ·s |
|
Mineral fibers |
10–150 |
≤ 5000·ρ·s·λ·(1-1.7·λ)-1 |
|
Cellular plastic materials |
10–80 |
≤ 5000·ρ·s·λ·(1-1.7·λ)-1 |
4.1 Existing wall structures performances
4.1.1 Thermal properties
Table 4 describes in detail the stationary and dynamic thermal parameters calculated according to the Standards EN ISO 6946:2017 [16] and EN ISO 13786:2017 [17].
To this aim, the values of the internal and external surface thermal resistance are set to 0.13 m2∙K∙W-1 and 0.04 m2∙K∙W-1 respectively.
Table 4. Thermal parameters of typical wall structures
|
Wall ID |
Superficial mass (kg∙m-2) |
U-value (W∙m-2∙K-1) |
YIE (W∙m-2∙K-1) |
Attenuation factor (-) |
Phase shift (h) |
|
1 |
500 |
1.81 |
0.43 |
0.25 |
10 |
|
2 |
501.2 |
1.09 |
0.15 |
0.14 |
11 |
|
3 |
210.1 |
1.11 |
0.59 |
0.53 |
7.1 |
|
4 |
410 |
3.55 |
1.52 |
0.47 |
5.3 |
|
5 |
211.2 |
0.72 |
0.32 |
0.44 |
8.4 |
|
6 |
411.8 |
1.20 |
0.31 |
0.27 |
7.1 |
|
7 |
212.4 |
0.61 |
0.27 |
0.44 |
8.2 |
As it is possible to observe, all these wall structures show poor thermal performance. In fact, the stationary thermal parameter U-value ranges from 0.61 W∙m-2∙K-1 of the clay bricks cavity wall filled with 3 cm of insulation in the gap, to 3.55 W∙m-2∙K-1 of the uninsulated concrete wall. In addition, the periodic thermal transmittance YIE and the phase shift are usually different from the values of 0.10 W∙m-2∙K-1 and 10 hours, respectively, suggested for avoiding overheating issues during summer. Furthermore, it is interesting to note that the phase shift is directly correlated to the superficial mass of the element (the higher the mass the higher the delay) while being inversely correlated to the U-value, as demonstrated by the performances achieved by the uninsulated concrete wall (ID4) and its poorly insulated version (ID6).
4.1.2 Hygrometric behavior
The most problematic existing wall structures are uninsulated concrete walls (ID 4), for which a risk of surface condensation and mould growth is predicted in all climate zones because of their low thermal resistance (U-value = 3.55 W∙m-2∙K-1). Significant issues are posed also by uninsulated solid brick walls (U-value = 1.81 W∙m-2∙K-1), for which surface condensation and mould growth can be an issue in climate zones C, D, E and F respectively.
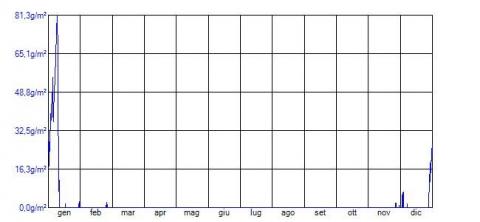
As far as interstitial condensation is concerned, a limited amount of condensate is predicted for uninsulated concrete walls only in the coldest climate zones (E and F) at the interface between the internal plaster and the reinforced concrete layer. However, as shown in Figure 2, the amount of cumulated condensate in the coldest period (November to February) is about 330 g∙m-2 (below the upper threshold of 500 g∙m-2) and completely re-evaporates within the year. As such, interstitial condensation is not considered an issue.
Figure 2. Interstitial condensation for wall ID4 – Climate Zone F, indoor vapor production class 3
If considering the higher indoor vapour production class 4, surface condensation and mould growth are now an issue for all the different wall assemblies in climate zones C to F. This can be easily explained if considering that now indoor relative humidity is typically higher than 80%, which is widely recognized as the activation threshold for the formation of fungi on internal surfaces and corresponds to the threshold values set by the Italian regulations.
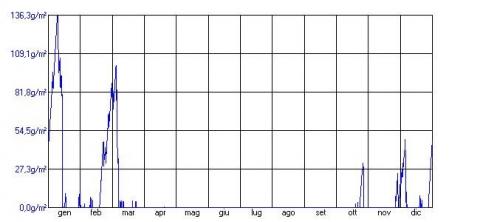
Figure 3. Interstitial condensation for wall ID4 – Climate Zone F, indoor vapor production class 4
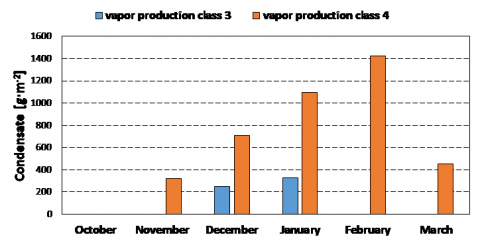
Figure 4. Cumulated condensate for wall ID4 – Climate Zone F, indoor vapor production classes 3 and 4
When considering interstitial condensation issues, also wall ID3 (cavity wall with air gap and no insulation) in climate zone F is subject to some condensation, precisely at the interface between the air gap and the external hollow clay brick, but the amount is negligible (less than 5 g∙m-2 in December) and completely re-evaporated in a year cycle. Conversely, the amount of cumulated condensate within concrete wall (ID4) in the coldest climate zone F is about 1400 g∙m-2 at the interface between internal plaster and reinforced concrete (see Figure 3). This is considerably higher than the suggested threshold of 500 g∙m-2 (and more than four times higher than the corresponding case with vapour concentration class 3, see Figure 4), and cannot be completely re-evaporated within a year. As such, corrective design actions are required for this kind of wall structure when placed in the coldest climate zones E and F.
4.2 Improvements obtainable through e-CLT
4.2.1 Thermal properties
The stationary and dynamic thermal parameters obtained after the e-CLT renovation for the seven wall structures are summarized in Table 5.
The application of the e-CLT solution to the outer surface of existing walls brings noticeable benefits in terms of improved thermal resistance thanks to:
Consequently, e-CLT significantly reduces the U-value of the different wall structures. These values now are all quite similar, and range between 0.23 W∙m-2∙K-1 for wall ID 7r (cavity wall with air gap and average insulation) to 0.34 W∙m-2∙K-1 for wall ID 4r (concrete wall with no insulation), while the corresponding values without the e-CLT package were 0.61 W∙m-2∙K-1 (wall ID 7) and 3.55 W∙m-2∙K-1 (wall ID 4) (see Table 4). This makes the e-CLT retrofit solution compliant with the maximum admissible U-values after major building renovation in Italy as dictated by the Inter-Ministerial Decree 26/06/2015 [18]. In fact, these values span from 0.26 W∙m-2∙K-1 in the coldest climate zone F to 0.40 W∙m-2∙K-1 of the warmest climate zone A.
Table 5. Thermal parameters of retrofitted wall structures
|
Wall ID |
Superficial mass (kg∙m-2) |
U-value (W∙m-2∙K-1) |
YIE (W∙m-2∙K-1) |
Attenuation factor (-) |
Phase shift (h) |
|
1r |
533.3 |
0.31 |
0.01 |
0.04 |
17.5 |
|
2r |
534.5 |
0.28 |
0.01 |
0.03 |
19.1 |
|
3r |
243.4 |
0.28 |
0.02 |
0.08 |
15.3 |
|
4r |
443.3 |
0.34 |
0.04 |
0.11 |
13 |
|
5r |
244.6 |
0.25 |
0.01 |
0.05 |
17 |
|
6r |
445.1 |
0.29 |
0.02 |
0.07 |
15 |
|
7r |
245.8 |
0.23 |
0.01 |
0.04 |
16.5 |
Moreover, the additional thermal mass provided by e-CLT and the presence of the insulation material significantly improve the dynamic thermal response as well. In fact, the attenuation factor ranges between 0.03 (wall ID 2r) and 0.11 (wall ID 4r) and the dynamic thermal transmittance YIE ranges between 0.01 W∙m-2∙K-1 and 0.04 W∙m-2∙K-1, that is to say well below the maximum value of 0.10 W∙m-2∙K-1 allowed in Italy. The phase shift is between 13 h (wall ID 4r) and 19.1 h (wall ID 2r), which classifies all the proposed solutions as “excellent”.
4.2.2 Hygrometric behavior
As expected, the improvements in the thermal parameters of the retrofitted walls do positively influence also their hygrometric behaviour. In fact, surface condensation and mould growth risks are now solved for all wall structures and indoor vapour production classes analysed because of their increased thermal resistance, which raises the temperature of the walls’ internal surface and thus reduces the risk of achieving dew point conditions.
In terms of interstitial condensation, some condensate is present at the exterior face of the insulating material for vapour concentration class 3 only in the case of wall ID 3r (cavity wall with air gap and no insulation) in the coldest climate zone F, but the very low amount predicted (2.2 g∙m-2) is easily re-evaporated. When considering an increased indoor vapour production (vapour concentration class 4), some interstitial condensation may occur in climate zones E and F for five out of the seven wall structures (namely walls ID 1r, 2r, 3r, 5r and 7r), but once again the amount of cumulated condensate is low (below 20 g∙m-2) and re-evaporated in a year.
This research studied the thermal and hygrometric behavior of the e-CLT system developed in the framework of the H2020 Innovation Project e-SAFE. Such a system is made of CLT panels connected to existing wall structures through energy dissipative devices on the inner side while being covered with a wooden-based insulation material and a cladding layer on the outer side. The e-CLT performance, assessed through the stationary method dictated by the European EN 13788 Standard, revealed that this energy retrofit intervention significantly improve both the thermal and hygrometric behavior of typical wall structures located in different climate zones in Italy.
As examples, the U-values achieved after applying CLT panels to solid brick walls and cavity walls drop down from 1.81 W∙m-2∙K-1 and 1.11 W∙m-2∙K-1 to 0.31 W∙m-2∙K-1 and 0.28 W∙m-2∙K-1, respectively, thus making these constructions complying with the maximum admitted U-values for walls after major renovations. In addition, the summer thermal performance is significantly improved thanks to the supplementary thermal mass brought by CLT panels, which typically shows density values in the range of 400 to 600 kg∙m-3, and the improved thermal resistance.
From the hygrometric point of view, the e-CLT solution eliminates any surface condensation and mold growth risks present in various typical wall structures (most notably solid bricks and concrete walls), and reduces the amount of interstitial condensation within their structure. In fact, the additional water vapor resistance (μ ≈ 60) makes it more difficult for the water vapor to migrate from the indoors and reach the coldest points of the wall. In any case, the maximum amount of condensate predicted is only 20 g∙m-2 in the worst scenario (renovated concrete walls in coldest climate zone F, indoor vapor production class 4). This figure is well below the maximum threshold of 500 g∙m-2 set by the normative and the corresponding amount achieved by the same wall without the application of e-CLT (1400 g∙m-2).
Further studies are planned to assess other condensation mechanisms such as vapor convection, capillary transport and surface diffusion through advanced transient hygrothermal simulations.
The research activities described in this paper were carried out in the framework of the "Energy and seismic affordable renovation solutions" (e-SAFE) project, which has received funding from the European Union's Horizon 2020 research and innovation programme under grant agreement No. 893135. Neither the Executive Agency for Small-and-Medium-sized Enterprises (EASME) nor the European Commission is in any way responsible for any use that may be made of the information it contains. This research was also partially funded by the University of Catania in the framework of the SIS-RENEW research project (Piano di incentivi per la Ricerca 2020–2022).
|
CP |
specific heat, J∙kg-1∙K-1 |
|
fRSI |
temperature factor, dimensionless |
|
g |
specific water vapor flux, kg∙m-2∙s-1 |
|
HDD |
heating degree day, ℃∙day |
|
sD |
equivalent air layer thickness, m |
|
U |
stationary thermal transmittance, W∙m-2∙K-1 |
|
YIE |
periodic thermal transmittance, W∙m-2∙K-1 |
|
Greek symbols |
|
|
λ |
thermal conductivity, W∙m-1∙K-1 |
|
µ |
water vapor resistance, dimensionless |
|
ρ |
density, kg∙m-3 |
[1] Directive (EU) 2018/844 OF THE EUROPEAN PARLIAMENT AND OF THE COUNCIL of 30 May 2018 amending Directive 2010/31/EU on the energy performance of buildings and Directive 2012/27/EU on Energy Efficiency.
[2] EU Building Stock Observatory database, https://ec.europa.eu/energy/en/eu-buildings-database.
[3] EU Energy Efficient Buildings, https://ec.europa.eu/energy/en/topics/energy-efficiency/energy-performance-of-buildings.
[4] Marini, A., Passoni, C., Riva, P., Negro, P., Romano, E., Taucer, F. (2014). Technology options for earthquake resistant, eco-efficient buildings in Europe: Research needs. European Commission, Joint Research Centre Scientific and Policy Reports. https://doi.org/10.2788/68902
[5] EN ISO 13788:2013, Hygrothermal performance of building components and building elements – Internal surface temperature to avoid critical surface humidity and interstitial condensation – Calculation methods. European Committee for Standardization, 2013.
[6] Margani, G., Evola, G., Tardo, C., Marino, E.M. (2020). Energy, seismic, and architectural renovation of RC framed buildings with prefabricated timber panels. Sustainability, 12(12): 4845. https://doi.org/10.3390/su12124845
[7] Nocera, F., Gagliano, A., Detommaso, M. (2018). Energy performance of cross-laminated timber panel (X-Lam) buildings: A case study. Math. Model. Eng. Probl., 5: 175-182. https://doi.org/10.18280/mmep.050307
[8] Brandner, R., Flatscher, G., Ringhofer, A., Schickhofer, G., Thiel, A. (2016). Cross laminated timber (CLT): overview and development. European Journal of Wood and Wood Products, 74(3): 331-351. https://doi.org/10.1007/s00107-015-0999-5
[9] Sustersic, I., Dujic, B. (2014). Seismic shaking table testing of a reinforced concrete frame with masonry infill strengthened with cross laminated timber panels. In Proceedings of the World Conference on Timber Engineering, Quebec, QC, Canada, 10-14.
[10] PAN v.7.1.0.4 software. Available at: https://www.anit.it/software-anit/pan/.
[11] TABULA Project Final Report. Available at: https://episcope.eu/fileadmin/tabula/public/docs/report/TABULA_FinalReport_AppendixVolume.pdf.
[12] EN ISO 10456:2007, Building materials and products – Hygrothermal properties – Tabulated design values and procedures for determining declared and design thermal values. European Committee for Standardization, 2007
[13] EN ISO 15927-1:2004, Hygrothermal performance of buildings. Calculation and presentation of climatic data. Monthly means of single meteorological elements. European Committee for Standardization, 2004.
[14] Presidential Decree 26/08/1993 n. 412, Regolamento recante norme per la progettazione, l'installazione, l'esercizio e la manutenzione degli impianti termici degli edifici ai fini del contenimento dei consumi di energia, in attuazione dell'art. 4, comma 4, della legge 9 gennaio 1991, n. 10 (in Italian), 1993.
[15] UNI 10349:2016 (serie), Riscaldamento e raffrescamento degli edifici - Dati climatici Ente Nazionale Italiano di Unificazione, 20016 (in Italian).
[16] EN ISO 6946:2017, Building components and building elements – Thermal resistance and thermal transmittance – Calculation methods. European Committee for Standardization, 2017
[17] EN ISO 13786:2017, Thermal performance of building components – Dynamic thermal characteristics – Calculation methods. European Committee for Standardization, 2017.
[18] Inter-Ministerial Decree 26/06/2015, Applicazione delle Metodologie di Calcolo delle Prestazioni Energetiche e Definizione delle Prescrizioni e dei Requisiti Minimi degli Edifici. Ministero dello Sviluppo Economico (in Italian), 2015.