Alessandro Ribezzo | Matteo Fasano | Luca Bergamasco | Luigi Mongibello | Eliodoro Chiavazzo*
OPEN ACCESS
One major limitation of phase-change materials (PCM) for thermal energy storage comes from their poor thermal conductivity hindering heat transfer process and power density. Nanocomposites PCMs, where highly conductive nanofillers are dispersed into PCM matrices, have been exploited in the past decades as novel latent heat storage materials with enhanced thermal conductivity. A computational model based on continuum simulations capable to link microscopic characteristics of nanofillers and the bulk PCM with the macroscopic effective thermal conductivity of the resulting nanocomposite is the aim of this work. After preliminary mean-field simulations investigating the impact of the nanofiller aspect ratio on the thermal conductivity of the nanocomposite, finite element simulations at reduced aspect ratios have been performed with corrected thermal conductivity values of the filler, to take into account the thermal interface resistances between fillers and matrix. Finally, the thermal conductivity at the actual aspect ratios has been extrapolated by the results obtained at reduced aspect ratios thus saving computational time and meshing efforts. This method has been validated through comparison against previous literature evidence and new experimental characterizations of nanocomposite PCMs.
nanocomposites, phase change materials, thermal conductivity, composite materials, finite element
The growing relevance of renewable forms of energy has highlighted the need to store and manage thermal energy. Important renewables energy forms, such as solar, have the need to decouple the intermittent production and demand to exploit them in a more efficient way.
Global thermal energy storage capacity for cooling applications needs to double to meet the expected demand in the next decade [1]. Phase-change materials (PCMs) are an efficient way to store thermal energy, as they assure a sufficiently higher energy density compared to traditional sensible heat storage. However, storage plants that exploit the use of PCMs present low power density and effective energy capacity due to the poor thermal conductivity of these materials, which hinders heat transfer processes [2, 3].
Nanocomposites, in which highly conductive nanofillers -e.g. graphite flakes and carbon nanotubes - are dispersed into PCM matrices, may alleviate the above issue [4, 5]. A synergistic approach between multi-scale numerical simulations and experiments to predict the thermophysical properties of PCM-based nanocomposites for cold storage is the aim of this work.
The output from numerical simulations is the effective thermal conductivity of the nanocomposite at different volume fractions and for different filler sizes. Those properties are important to optimize the latent heat storage material (with or without microencapsulation) to be employed in thermal systems for domestic cooling, and to define its most suitable operating conditions as compared to state-of-art cold storage systems [2]. The numerical model described in this work is validated by comparing the effective thermal conductivity estimated numerically with previous literature results and new experimental evidence. The latter has been obtained by measuring the thermal conductivity of a commercial paraffin wax-based PCM for cold storage with the addition of graphite carbon flakes.
2.1 Experimental methods
The graphite flakes used in this work have been supplied by Sigma-Aldrich (mesh 100 – product number 332461).
The paraffin wax-based phase change material comes from RubithermTM (PureTemp 15). It presents a melting temperature of 15°C, heat storage capacity of 182 J/g, a thermal conductivity of 0.15 W/mK in the liquid phase and 0.25W/mK in the solid phase.
A TCi Thermal Conductivity Analyzer of C-THERM has been used to measure the thermal conductivity of both pristine PCM matrix and phase change nanocomposite.
During experiments, the temperature control has been assured by a Tenney Tps Junior Test chamber.
2.2 Numerical methods
Introducing highly conductive fillers in a poorly conductive phase change material has been widely demonstrated to be an effective way to enhance its overall heat conduction properties [6, 7]. Nevertheless, quantifying this thermal conductivity enhancement for the composite is still challenging. In particular, the difficulty to model the overall thermal conductivity of phase change nanocomposites is due to the complexity of the system and the multi-scale nature of the problem. Characteristics such as the nanofiller diameter, shape and aspect ratio [4], the orientation and dispersion of fillers inside the PCM, and the thermal interface resistance between fillers and matrix [5] have been observed to have a relevant role in determining the effective thermal behavior of the composite.
Thermal interface resistance is still a challenging parameter to be predicted by numerical approaches mainly due to its multiscale nature.
These resistances are influenced, in fact, by the characteristics of the two materials, the effective contact geometry, the chemical bonds strength at the interface and the mismatch in the phonon density of states between the phases [10].
The model exploited in this work to compute the overall thermal conductivity of the nanocomposite is based on finite elements and mean-field approximations implemented in the Digimat software [8]. This modeling approach is designed to predict the influence of microstructure on the macroscopic effective thermal conductivity of the composite.
Firstly, a cubic Representative Volume Element (RVE) - in which both the matrix and the fillers are included - is generated. The RVE constitutes the link between the microscopic and macroscopic scales and, therefore, it has to be small enough to save computational time and at the same time large enough to be representative of the heterogeneous microstructure. After the generation of the RVE, a heat flux between two of its parallel faces is imposed, and the effective thermal conductivity of the composite computed by means of Fourier’s law. As the RVE is a random sample of the composite, periodic boundary conditions are imposed along all three Cartesian coordinates. The microstructure of the composite (i.e. fillers dimensions, shape orientation and dispersion inside the matrix) can be properly changed in the initial geometry.
Due to computational constraints, in our simulations we have initially considered fillers with aspect ratios in the range 0.02-50, whereas, the properties of nanocomposites made of fillers with higher aspect ratio have been extrapolated.
To obtain a preliminary understanding of the influence of aspect ratio of fillers on the thermal conductivity of PCM nanocomposites mean-field simulations have been carried out exploiting Digimat-MF [8].
Digimat-MF is a module using a semi-analytical mean-field homogenization to compute the thermal properties of composites as a function of their microstructure exploiting the same RVE built in the finite element module.
The Digimat.-MF module is based on the mean-field homogenization proposed by Mori and Tanaka [11], based on an approximate use of the Eshelby’s solution [12].
In this model each inclusion in the RVE behaves as if it was isolated in the matrix and it is successful in predicting the effective thermal conductivity of two-phase composites at moderate volume fractions (less than 25%) of inclusions which is the range of our interest [8].
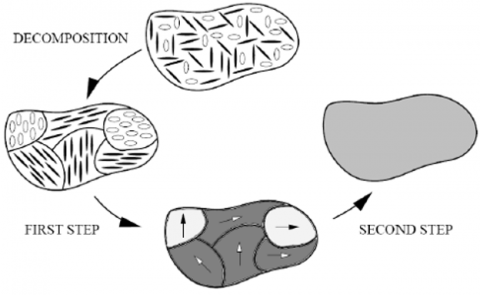
To properly simulate a random 3D distribution of fillers in the matrix the orientation of each inclusion in the RVE is described by a unit vector, function of two spherical angles. An orientation distribution function is introduced to define the probability to find fibers within a solid angle. A two-step homogenization procedure has been performed with misaligned inclusions as shown in figure 1.
Figure 1. Two-step homogenization procedure for random £D RVE [8]
The actual RVE is replaced by an equivalent one in which inclusions with the same orientations are merged in pseudo-grains. Each pseudo-grain is a constant filler orientation composite with a certain filler concentration being, therefore, homogenized by the Mori and Tanaka model.
Finally, the Voigt model [8] is used to homogenize the pseudo-grains and to generate the homogeneous equivalent RVE.
In our work, in order to take into account interface thermal resistances between the nanofiller and the matrix, an effective thermal conductivity of the filler has been considered following the approach by Chu et al. [13] in which the effective thermal conductivities in the in-plane and out-of-plane direction is computed as:
$\lambda_{x}=\frac{\lambda_{g}}{\frac{2 R_{k} \lambda_{g}}{L}+1} ; \lambda_{z}=\frac{\lambda_{g}}{\frac{2 R_{k} \lambda_{g}}{c}+1} ;$ (1)
In Eq. (1) the fillers geometrical characteristics (diameter L and thickness c), the thermal interface resistance Rk and the filler thermal conductivity λg are taken into account.
3.1 Comparison with literature results
The simulation results are initially compared with the experimental results obtained in the work of Warzoha et al. [9] in which graphene nanoparticles (GNPs) were added in a paraffin PCM. The cases considered are named h5, h15 and h25 and their properties summarized in Table 1.
Table 1. GNP characteristics in the composite tested experimentally by Warzoha et al. [9] and replicated in our simulations
|
Name |
Diameter [m] |
Thickness [m] |
Aspect Ratio |
|
h5 |
5E-6 |
15E-9can be |
edited 333 |
|
h15 |
15E-6 |
15E-9 |
1000 |
|
h25 |
25E-6 |
15E-9 |
1666 |
Preliminary mean-field simulations have been performed to understand the trend of the effective thermal conductivity of the composite as function of the filler aspect ratio, showing a linear trend.
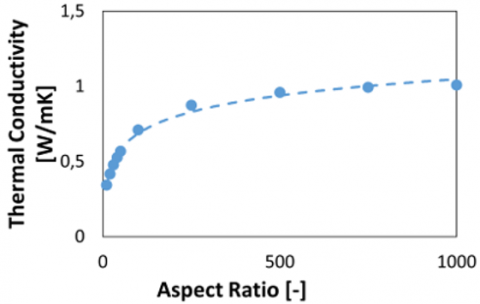
As an example, the influence of the aspect ratio of h15 GNP (areal=1000) on the simulated effective thermal conductivity of the composite is shown in Figure 2 where, keeping constant the thermal conductivity of the fillers in the in-plane and out of plane directions and the filler volume, a logarithmic fitting of the results seems reasonable (dashed line in Figure 2). This decrease in the effective thermal conductivity of the composite due to the aspect ratio decrease could be due to the more severe impact of the low out-of-plane thermal conductivity in the heat flux for fillers with reduced aspect ratio compared to fillers with higher aspect ratios.
Results, in both MF and FE simulations, have been obtained with Rk as a fitting parameter in order to match with the experimental results. Table 2 summarizes the thermal interface resistance and the thermal conductivity in the two directions, obtained by Eq. (1) for the three different cases for the best fitting.
Table 2. Rk, $\lambda_{x}$ and $\lambda_{z}$ values obtained with the best fitting
|
Name |
Rk [m2K/W] |
$\lambda_{x}$ [W/mK] |
$\lambda_{z}$ [W/mK] |
|
h5 |
1.5E-7 |
16.57can be |
edited 0.050 |
|
h15 |
1.8E-7 |
41.10 |
0.042 |
|
h25 |
2.7E-7 |
45.59 |
0.028 |
The output results of the finite element simulations in Figure 2 for aspect ratio in the range 0-50 are fitted according to a logarithmic trend to extrapolate the thermal conductivity value at higher aspect ratios (areal).
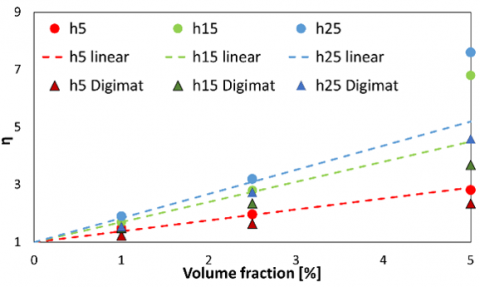
Figure 3 shows the nanocomposite thermal enhancement η, which is defined as the ratio between the thermal conductivity of the composite and that of the matrix only. Results are reported for the h5, h15 and h25 cases obtained with Digimat compared to the experimental results reported from Warzoha et al. [9].
Note that multiplying the numerical results by a correction factor of 1.2 an accurate match with the linear trend (dashed lines in Figure 3) is obtained (with a mean error of 1.4%,1.5% and 8% for h5, h15, h25 GNPs, respectively).
Figure 2. Trend of MF simulations of thermal conductivity as function of the aspect ratio (circles) and logarithmic fitting (dashed lines)
In Figure 3 a deviation from the linear trend of the experimental results can be seen for composites with 5% in volume of fillers, especially h15 and h25 ones. This difference may be due to the fact that the interface thermal resistance in Eq. (1) considers only filler-matrix interfaces, while neglecting filler-filler. At concentrations higher than the percolation threshold, which is the value for which a continuous contact between the filler exists, the contact interface resistances should be considered also at filler-filler interfaces. The presence of a continuous thermal path is positive for enhancing the thermal flux throughout the composite which manifest in thermal conductivity values above the linear trend in Figure 3.
This difference is more evident increasing the aspect ratio from h5 to h25 because higher aspect ratios bring to less scattered and more continuous thermal paths.
Figure 3. Trend of MF simulations of thermal conductivity as function of the aspect ratio (circles) and logarithmic fitting (dashed lines)
3.2 Comparison with new experimental results
The abovementioned model has been then used to represent the thermal behavior of a paraffin-based PCM including carbon flakes. The experimental results have been carried out at ENEA Portici.
The comparisons between the numerical results and experimental ones are shown in Figure 4.
The discrepancy between experiments and simulations, whose mean percentage value is 7.8%, could be due to the fact that the experiments were performed with liquid paraffin, while the model considers only heat conduction (no advective term).
Figure 4. Thermal conductivity of PCM composites as function of the filler mass fraction for the numerical (rhombus) and new experimental results (squares)
In this work, a model to predict the effective thermal conductivity of a nanocomposite has been presented. The model can create a link between the microscopic properties of the nanocomposite as the filler characteristics and distribution inside a matrix and a macroscopic thermal property as the overall thermal conductivity.
The possibility of modeling the impact of high aspect ratio fillers on thermal properties through an extrapolation of reduced aspect ratio fillers could avoid computational and meshing problems due to the large size differences between matrix and nanofillers.
Further improvements could be done to model the thermal interfaces resistances with prediction capability, since in this work it was considered as a fitting parameter.
Moreover, to simulate properly the PCM in its whole behavior, implementations able to simulate the thermal conductivity in the liquid phase of nanocomposites needs to be adressed.
The present work may provide useful guidelines in simulating complex micro and nanocomposites with reduced computational and meshing efforts.
This work has been supported by the Italian Ministry of Economic Development (MISE) and the Italian National Agency for New Technologies, Energy and Sustainable Economic Development (ENEA) in the framework of the research contract entitled: “Sviluppo di modelli per la caratterizzazione delle proprietà di scambio termico di PCM in presenza di additivi per il miglioramento dello scambio termico.”
|
a |
Aspect ratio |
|
c |
Filler thickness, m |
|
L |
Filler diameter, m |
|
PCM |
Phase Change Materials, |
|
Rk |
Interface Thermal Resistance, Km2/W |
|
RVE |
Representative Volume Element |
|
Greek symbols |
|
|
l |
Thermal conductivity, W/mK |
|
Subscripts |
|
|
g |
Filler |
|
x |
In plane direction |
|
z |
Out of plane direction |
[1] IRENA, Innovation Outlook: Thermal Energy Storage, 2020, International Renewable Energy Agency, Abu Dhabi.
[2] Neri, M., Chiavazzo, E., Mongibello, L. (2020). Numerical simulation and validation of commercial hot water tanks integrated with phase change material-based storage units. Journal of Energy Storage, 32: 101938. https://doi.org/10.1016/j.est.2020.101938
[3] Li, C., Yu, H., Song, Y., Zhao, M. (2018). Synthesis and characterization of PEG/ZSM-5 composite phase change materials for latent heat storage. Renewable Energy, 121: 45-52. https://doi.org/10.1016/j.renene.2017.12.089
[4] Fasano, M., Bigdeli, M.B., Sereshk, M.R.V., Chiavazzo, E., Asinari, P. (2015). Thermal transmittance of carbon nanotube networks: Guidelines for novel thermal storage systems and polymeric material of thermal interest. Renewable and Sustainable Energy Reviews, 41: 1028-1036. https://doi.org/10.1016/j.rser.2014.08.087
[5] Nejad, S.M., Srivastava, R., Bellussi, F.M., Thielemann, H.C., Asinari, P., Fasano, M. (2021). Nanoscale thermal properties of carbon nanotubes/epoxy composites by atomistic simulations. International Journal of Thermal Sciences, 159: 106588. https://doi.org/10.1016/j.ijthermalsci.2020.106588
[6] Wu, S., Li, T., Tong, Z., Chao, J., Zhai, T., Xu, J., Wang, R. (2019). High‐performance thermally conductive phase change composites by large‐size oriented graphite sheets for scalable thermal energy harvesting. Advanced Materials, 31(49): 1905099. https://doi.org/10.1002/adma.201905099
[7] Zhou, S.X., Zhang, X.L., Liu, S., Li, Y.Y., Xu, X.F. (2019). Performance study on expand graphite/organic composite phase change material for cold thermal energy storage. Energy Procedia, 158: 5305-5310. https://doi.org/10.1016/j.egypro.2019.01.642
[8] Digimat Documentation
[9] Warzoha, R.J., Fleischer, A.S. (2014). Effect of graphene layer thickness and mechanical compliance on interfacial heat flow and thermal conduction in solid–liquid phase change materials. ACS Applied Materials & Interfaces, 6(15): 12868-12876. https://doi.org/10.1021/am502819q
[10] Warzoha, R.J., Fleischer, A.S. (2014). Heat flow at nanoparticle interfaces. Nano Energy, 6: 137-158. https://doi.org/10.1016/j.nanoen.2014.03.014
[11] Mori, T., Tanaka, K. (1973). Average stress in matrix and average elastic energy of materials with misfitting inclusions. Acta Metallurgica, 21(5): 571-574. https://doi.org/10.1016/0001-6160(73)90064-3
[12] Eshelby, J.D. (1957). The determination of the elastic field of an ellipsoidal inclusion, and related problems. Proceedings of the royal society of London. Series A. Mathematical and Physical Sciences, 241(1226): 376-396. https://doi.org/10.1098/rspa.1957.0133
[13] Chu, K., Jia, C.C., Li, W.S. (2012). Effective thermal conductivity of graphene-based composites. Applied Physics Letters, 101(12): 121916. https://doi.org/10.1063/1.4754120
[14] Chiavazzo, E., Asinari, P. (2010). Reconstruction and modeling of 3D percolation networks of carbon fillers in a polymer matrix. International Journal of Thermal Sciences, 49(12): 2272-2281. https://doi.org/10.1016/j.ijthermalsci.2010.07.019