Valeria Selicati* | Nicola Cardinale
OPEN ACCESS
At present, the focus on manufacturing-sustainability is not necessarily on energy management, but rather on its intelligent use. An increase in productivity leads to a reduction in costs, but may increase consumptions based on demand elasticity as rebound effect.
The article focuses on exergy coupled with Life Cycle Assessment to address manufacturing-sustainability. Indicators are widely adopted in order to better interpret and communicate the results of a hybrid analysis; they are easy to interpret and represent a useful strategy to quickly and intuitively detect changes in the energy efficiency and quality of processes that are subject to change in time.
The aim of this work is to firstly provide an overview on the metrics related to the hybrid or coupled use of exergy and Life Cycle Assessment, their meaning, their practice in particular use cases. The most representative indicators are compared within a real case study and discussion of the results is provided.
Among the main outcomes, their accuracy in evaluating environmental but especially on social and economic aspects is not yet clear. The lack of complete and up-to-date data and uncertainty analysis is often problematic, such as the lack of scientific consistency in the interpretation of the assessment.
exergetic analysis, indicators, life cycle assessment, manufacturing sustainability, reversibility
Sustainability is a concern of fulfilling current needs without affecting future generations’ ability to fulfil theirs. It involves measures to protect our common environment in economically sustainable ways that are socially good for human health and well-being, over the medium and long term.
Sustainable development in manufacturing is a process of continuous improvement of environmental, social and economic performance, all as a function of time. Measuring, managing, interpreting and communicating sustainability is a key step in decision-making policy.
The first step that a practitioner must take is to map all aspects of the sustainability of the system to be analyzed. Once all relevant aspects have been identified, the objectives of the improvement shall be defined. These objectives include, for example, minimizing the resources used and, consequently, maximizing value by reducing energy consumption, optimizing the plant, reducing CO2 emissions, and so on. The downstream interpretation of these interventions and the consequent strategic actions to be taken can be carried out with appropriate indicators to measure the performance of the system against its objectives. Peter Drucker said “Only what gets measured gets managed” [1].
In manufacturing, the dimensions to be assessed widens from three to five, becoming environmental stewardship, economic growth, social well-being, technological advancement, and performance management [2].
The evaluation of these dimensions requires advanced assessment methods Among these existing in the literature, the article focuses on the strategic coupling between the laws of thermodynamics, i.e., the Exergetic Analysis, and the Life Cycle of the product or process. These two methods have been hybridized in various ways, on different levels, so much so that it was even difficult to interpret the results quickly in order to produce the decision-making strategies most suitable for the case studied [3].
The aim of this work is to firstly provide a deep overview on all the metrics related to the hybrid or coupled use of exergy and LCA, their meaning, their practice in particular use cases.
Then, the second aim is to provide a better and general definition of the metric as a tool to facilitate the interpretation of the results of the assessment. The most representative indicators are compared in a real industrial case study. For the sake of brevity, this article will not delve theoretically into the fundamental principles of exergetic analysis, life cycle assessment, or integrated EA-LCA methods.
Among the main outcomes for possible food for thought, it appears that many indicators or sets of indicators proposed in the literature are intended to provide reliable information on various aspects of the global sustainability context, but it is always a problem when aggregation of results is needed as an integrated metric. Their accuracy in evaluating environmental but especially on social and economic aspects is not yet clear. The lack of complete and up-to-date data and uncertainty analysis is often problematic, such as the lack of scientific consistency in the interpretation of the assessment.
The paper is organized as follows: the first section describes manufacturing sustainability and the best methods for measuring it. The second section focuses on how to return the analysis results, and thus their interpretation, and is followed by a brief state of the art on the use of the most commonly used indicators in the manufacturing sector. The third section is related to the case study, and it concludes with a discussion of the findings from the manufacturing sustainability assessment analyses. Finally, the conclusions close the paper.
The degradation of the environment is caused by waste generated during the manufacturing process, during product use, and after the product has reached the end of its useful life. As a result, reducing resource consumption and manufacturing systems’ environmental impact has become increasingly important. As a result, it is critical for manufacturing industries to strive for sustainable manufacturing.
Sustainable production can be described as a system that integrates product and process design issues with manufacturing, planning and control issues in a way that identifies, quantifies, evaluates and manages the flow of environmental waste, with the aim of ultimately reducing the environmental impact of the Earth’s self-recovery capability while at the same time trying to manage it. Therefore, the sustainable approach must be related to a policy of change to achieve this goal with a continuous effort in a reasonable time frame for present and future generations.
The Life Cycle Assessment (LCA) is a widespread method for addressing sustainable production. It is an approach to study the environmental effects of various processes, including the production of goods and services, but also parts of a particular process or products. LCA is concerned with identifying the environmental effects of a given product or process at each of these stages of life. In reality, LCA can provide an excellent insight for practitioners to research any given product in order to find the best ways to reduce the environmental impact of a particular product or process. Full implementation of the LCA enables any practitioner to make a reasonable comparison of the phases of life of the product, assess where the greatest environmental benefit is to be achieved, and eventually track the long-term impact of improvements in design and/or manufacturing [4].
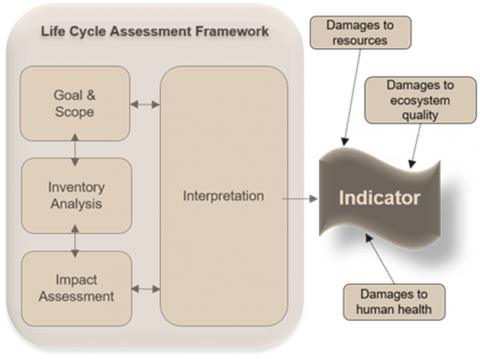
Figure 1. LCA framework form [5]
The ISO standards are based on a process-based LCA approach and are organized into four steps: goal and scope definition, inventory analysis, impact assessment, and interpretation as shown in Figure 1.
As this article focuses on the interpretation of sustainability, the last phase in the process uses the results of the three previous steps and provides recommendations for the enhancement of the environment of the product or process under consideration. Ideally, this knowledge provides direct guidance to beneficial approaches, such as the creation of environmental initiatives.
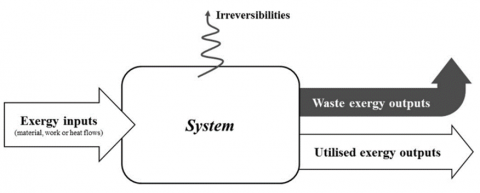
Exergetic analysis (EA) is based on the second law of thermodynamics and seeks to account the amount of useful work that can be extracted from a real system when it is brought into equilibrium with its environment. The optimization parameters include the minimization of the exergy loss due to system irreversibilities (see Figure 2), which is the explanation for the process less-than-theoretical effectiveness.
Figure 2. Exergy balance of a system, from [6]
Exergy is an optimization approach that can support and extend the conventional LCA. In fact, classical LCA approach focuses deeply on environmental emissions, while EA is much more centered on products, highlighting the availability of resources and system efficiency. EA and LCA can interact with each other to provide a more holistic view of the system/process to be assessed [3].
Exergetic analysis coupled with Life Cycle Assessment brings considerable advantages: they provide more objective-oriented evaluation results; secondly, they become a valuable tool for decision-making policies aimed at creating a retrofitting solution, allowing the system to avoid any potential failure automatically. Besides, they are useful instruments that help to understand process management alternatives to improve and innovate production process technologies [7].
There are several ways to integrate or couple EA and LCA, that cluster in different hybrid methods, all explained in depth in [3]. Among those mentioned in the review are:
- Exergetic Life Cycle Assessment (ELCA), the most common, which combines EA and LCA in a variety of ways, ranging from the most basic, comparing the results of the two separate analyses [8], to almost complete integration [9].
- Cumulative Exergy Demand (CExD), which is so widely used that it is now included in all LCA software [10].
- Exergoenvironmental Analysis, one of the most complex, but also one of the most common, because it almost completely integrates the LCA and the EA [11].
The hybridization approach is also very useful in terms of interpreting the results, which is the central theme of this article. While most sustainability indicators must be contextualized within international regulatory processes and frameworks (such as Carbon Footprint or Global Warming Potential) in order to meet the requirements of scientificity, reproducibility and reliability, the indicators (or, in this case, efficiencies) returned by the exergetic analysis or when combined with the LCA are self-explanatory and easy to understand.
In the literature, indicators have been identified in many significantly different ways [12]. The term indicator identifies a tool that can provide information in a synthetic form, simpler than a more complex phenomenon, and with a broader meaning. It is therefore an instrument capable of making visible a trend or phenomenon which is not immediately perceptible. An indicator is a measure or an aggregation of measures from which conclusions on the phenomenon of interest can be inferred according to the objective set.
Each indicator must have the following characteristics in order to be scientifically valid [13]:
There are different ways in which indicators can be defined. Many of the phenomena that affect sustainability are quantifiable. Some are directly measurable chemical and physical phenomena (e.g. CO2 emissions); others, on the other hand, are characteristics for which we do not have direct measuring instruments, but which can always be expressed quantitatively by reference to an appropriate and considered scale of intensity [14]. A distinction must be made between: physical indicators, units of measurement and levels of variables identified as significant; multidimensional indicators or indices, consisting of aggregation of indicators and data of the same type or of different types. In addition, the indices can be expressed in absolute values through the standardization and aggregation of the starting information.
To better interpret and communicate the results from a hybrid analysis and be able to easily compare different production or different systems with different unit of measurement, indicators are widely adopted. They can also provide aggregate information. They are quite easy to interpret because their value can vary from zero (worst conditions) to one (ideal conditions). Indicators are a useful strategy to quickly and intuitively detecting changes in the energy efficiency and quality of processes, which are subject to the becoming of time. Environmental indicators must represent the goals of the various environmental issues, which are clearly linked to the belief system of those who identify them and are thus subjective. Some countries have established their own scale of environmental goals, which has enabled specialists to establish an effective system of indicators.
3.1 Brief state of art of the main sustainability indicators in manufacturing field related to Exergy and LCA
Many authors emphasize the benefit of using exergy losses as an indicator which provides uniform measure to compare and assess different processes [15, 16]. Exergy-based indicators offer an effective sustainability metrics for the evaluation of the exploitation of material resources and energy and quantifying the side effects of the ecological and socio-economic behaviors in complex systems. On the other hand, the indicators from LCA provided after the characterization and normalization of the assessment have been always considered inaccurate due to the subjectivity that characterizes this step [17], plus, only few of the LCA’s assessment methods provide for the possibility of obtaining dimensionless indicators of the relevant impact categories. In literature many indicators or sets of indicators have been proposed that are supposed to provide reliable information about various aspects of the global context of sustainability, but it is always a problem when an aggregation of results is needed, as an integrated index of LCA and EA results: their accuracy as environmental or social and economic indicators is not so clear yet [18].
Table 1. List of the most representative indicators found in literature for manufacturing-sustainability
|
Indicator’s name |
Indicator’s ratio |
Meaning |
|
Coefficient resources-use performance [19] |
$\eta_{g}=\frac{\dot{E} x^{p}}{\dot{E} x^{i}}$ |
The ratio of the useful exergy produced by the system to the total exergy supplied to the system. |
|
Net use efficiency [19, 22] |
$\eta_{\varepsilon}=\frac{\sum \dot{E} x^{j}}{\sum \dot{E} x^{i}}$ |
The ratio of total exergy output to the total exergy supplied to the system. The ratio is proportional to the exergy destruction inherent in the system. |
|
Global Warming Potential [kgCO2eq] [20] |
$G W P=\sum_{i=1}^{n}\left(m_{i} \cdot I F_{i}\right)$ |
The impact of a resource over a given time period when compared to the same amount of carbon dioxide (CO2) over the same time period. |
|
Renewability Factor [21] |
$F R=\frac{C E x D_{r}}{C E x D_{n r}}$ |
The ratio between cumulative exergy demand of renewable resources to cumulative exergy demand of non-renewable resources. |
|
Exergetic Eco-Efficiency [23] |
$\eta_{e c o}=\frac{\eta_{\varepsilon} \cdot\left(F_{n r}+F_{r}\right)}{F_{n r}+\eta_{\varepsilon} \cdot F_{r}}$ |
The efficiency of consumption of both renewable and non-renewable sources along the entire Life Cycle of the product or process object of study. |
|
Life Cycle Quality Index [24] |
$\psi=\frac{U C E x}{C E x D}$ |
The ratio between the useful effects that a process or product can provide to the overall necessary to provide that process or product. |
|
Life Cycle Irreversibility Index [24] |
$X=1-\psi$ |
Complementary of ψ. |
|
Technology Obsolescence Index [24] |
$X_{a, b}=\frac{X_{a}}{X_{b}}$ |
Which innovative technology compared with the existent might reduce the irreversibilities of the process or product under study. |
Within the system, the material, energy and other streams take part in the process and they are transformed into the product and the waste streams. The performances (or yields) of a given process or activity are given by the exergetic yields related to the exergetic balances of the process/activity itself. The traditional exergy efficiency rate provides information about the ratio between benefits and costs or losses. The losses are equal to the difference between what is provided and how much it is obtained and identified with the destruction of exergy due to irreversibility [19]. The formulations and the meaning of the most representative metrics that we are going to review are mentioned in Table 1. The most used exergetic indicators are output/input exergy ratio (for efficiency assessment) and exergy for unit of product (for sustainability assessment). Depending on whether the aim is to evaluate the portion of useful exergy for the realization of the final product or to evaluate the overall exergy of the process, the performance metrics of the process or its components are defined in the following net and general efficiencies, respectively ηε and ηg.
The Global Warming Potential (GWP) was created to enable comparisons of the global warming impacts of various resources [20]. It is a measure of how much energy a ton a resource can consume for a given period of time in comparison to a ton of carbon dioxide emissions (CO2). The greater the GWP, the more a given gas warms the Earth in comparison to CO2 during that time span. The time frame most commonly used for GWPs is 100 years. GWPs offer a standard unit of measurement that helps analysts to add up emissions figures for various gases (e.g., to compile a national GHG inventory) and policymakers to compare emissions reduction opportunities across industries and gases.
Another point of view is provided by Dominguez et al. [21], in order to evaluate the relation between non-renewable and renewable resources along all the life cycle of each energy source considered for the electric power generation, introduced an indicator called ‘renewability factor’ (FR). It represents the ratio between the cumulative exergy demand for renewable resources to the cumulative exergy demand for non-renewable resources. Another way to evaluate the sustainable use of the resources is given in 2006 by Toxopeus and Lutters [23] and it was used also by Koroneos and Stylos in 2014 in their implementation of an ELCA on polycrystalline photovoltaic system in energy generation context [25]. They introduced an ELCA-based exergetic eco-efficiency indicator ηeco to account the efficiency of consumption for both renewable and non-renewable sources along the Life Cycle of the product or process under study. It relates the exergetic efficiency of overall input and output flows to the differentiation between renewable and non-renewable flows during the Life Cycle. The high difference between the value of traditional exergetic efficiency and the new one is in the magnitude of the contribution of renewable exergy (solar radiation) in the formation of the total incoming exergy that the traditional indicator cannot catch. Gulotta et al. [24] in their study included EA in the LCA by introducing three new indices focused on quality, irreversibility and technological obsolescence, in order to help decision-makers in the comparison of similar technologies. The Life Cycle Quality Index ψ evaluates the effective use of resources by comparing the useful cumulative exergy associated with all sub-processes and the overall cumulative exergy demand, the Life Cycle Irreversibility Index is able to suggest the potential exergetic inefficiencies of the process or technologies and possible retrofit actions. The Technology Obsolescence index χa,b helps the comparison of similar processes and products having the same functional unit. Technology obsolescence may be a good metric in policy decision-making to determine how much more innovative one technology is than another by identifying which new technology could reduce existing irreversibilities from manufacturing to end-of-life, minimizing the resources exploited from nature. In general, the technology obsolescence aspect is still slightly marked in the analysis of industrial processes.
Other metrics related to EA and LCA can be found in the literature; these will be explored in more detail in a future study.
These indicators are presented by the authors with many different names, but the common pattern is the comparison between output flows with input flows of the system, with some specific peculiarities for each case study. Also, their meaning is described in different ways as indicator/index of quality, of performance, of efficiency, of sustainability.
In this work, the best meaning that can be provided to this type of indicator is ‘indicator of reversibility’. The choice is endorsed first by the definition of sustainability as stated the Brundtland Report in 1987 [26]: “is the development that meets the needs of the present without compromising the ability of future generations to meet their own needs”; second by Dewulf et al. in [27] who argued that a technological process is sustainable only if its resource supplying, production and resource depletion or wastes won’t damage the ecological balance in the ecosphere. That means to make sure that the process takes in raw materials from the ecosphere at a rate lower than their capacity to be regenerated. Third, by [28] that defined an indicator named “exergy replacement cost”, i.e. the exergy needed to bring the resources back to their initial state (equilibrium).
The aim of the case study is to provide an overview of the value of the most relevant indicators of manufacturing sustainability, among those described in the state of the art, in particular one related to LCA only, one related only to exergetic analysis, and four related to a methodology that integrates EA-LCA in different ways.
The case study relates to a SME located in southern Italy that produces all the metallic components for the windows frame. The company is very focused on the quality of its products, but without affecting sustainability. In fact, it commits to renewing the EPD certification on its products every three years.
The indicators will be calculated on the basis of the same manufacturing process for the production of a corner square (which therefore represent the functional unit, as well as the finished product of the analysis).
One final product, 1 pc of corner square (Figure 3), is composed by six components.
The semi-automatic assembly and manual packaging (with labels and cardboard) phases follow.
To make the results of LCA and exergetic analysis, in terms of indicators, more comparable, the phases of transport (typical of LCA), and assembly and packaging will not be included in the analysis. This reduces heterogeneity in the process definition, inventory, and calculations. Ultimately, for the two distinct analyses: goal and scope are the same, the system boundaries are the same, and the inventory analysis is carried out on the same flows of matter and energy.
For each sub-process, Table 2 lists the main flows of materials, energy, and wastes. These quantities have already been calculated in terms of the functional unit, that is 1pc of steel corner.
For the sake of brevity, the results of the analyses per unit of manufacturing process, all related to the functional unit, will be shown as indicators of the performance of sustainability and technological quality of processes.
Figure 3. One corner square, the functional unit
4.1 Results and discussion
The indicators described below have been calculated on the basis of the formulae given in Table 1. The LCA and EA carried out, therefore, are functional to the determination of the parameters required for calculating the indicators.
Table 2. Main process parameters, i.e., process flows
|
Sub-process |
Materials |
Electrical Energy |
Wastes |
|||
|
Type |
Quantity |
Non-renewable |
Photovoltaic |
Type |
Quantity |
|
|
Die casting zamak |
Zamak panels |
0.0014 kg |
0.0012 kWh |
0.00011 kWh |
Metal |
0.0001 kg |
|
Additives/Chemicals |
0.0005 kg |
VOC |
0.00011 kg |
|||
|
Die casting aluminum |
Aluminum panels |
0.0248 kg |
0.00067 kWh |
0.00003 kWh |
Metal |
0.00048 kg |
|
Natural gas |
0.012 m3 |
VOC |
0.00002 kg |
|||
|
Additives/Chemicals |
0.001 kg |
Oil mist |
0.0009 kg |
|||
|
Flattening and cutting |
Stainless steel coils |
0.0011 kg |
0.00082 kWh |
0.00008 kWh |
Metal |
0.00005 kg |
|
Additives/Chemicals |
0.0003 kg |
Oil |
0.0001 kg |
|||
|
Washing |
Water |
0.0976 l |
0.0022 kWh |
0.00021 kWh |
Sludge |
0.095 l |
|
Natural gas |
0.0018 m3 |
Formaldehyde |
0.000001 kg |
|||
|
Additives/Chemicals |
0.0003 kg |
Chemicals |
0.0003 kg |
|||
|
Vibro-tumbling |
Abrasive grains |
0.0002 kg |
0.00082 kWh |
0.00008 kWh |
Grains |
0.0002 kg |
|
Shot blasting |
Abrasive blasting |
0.0003 kg |
0.0016 kWh |
0.00014 kWh |
Grains |
0.0003 kg |
|
Drilling and threading |
Additives/Chemicals |
0.0001 kg |
0.000034 kWh |
0.000006 kWh |
Metal |
0.0001 kg |
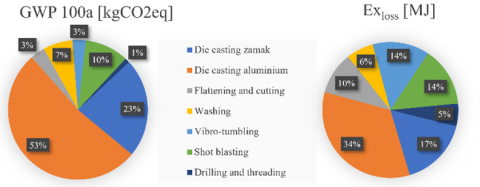
The results are shown in Table 3, while in Figure 4 is shown the contribution to the total GWP and Exergy loss for each sub-process.
LCA’s GWP 100y, which is widely used as a benchmark for obtaining EPD certifications for a sustainable product The GWP of a greenhouse gas expresses its contribution to the greenhouse effect in relation to the CO2 effect, which has a reference potential of 1. Each GWP value is determined for a specific time period of 100 years. The case study reported a total value of GWP of 0.3186 kgCO2eq/pc net of assembly and packaging for the case study carried out with SimaPro® and Ecoinvent v.3 database. The interpretation of this metric in relation to the study process is to calculate the amount of CO2 equivalent generated for each sub-process. The greater the quantity produced, the more energivor the process. Thus, according to GWP 100y, die casting aluminum is the most energy-intensive sub-process (considering, however, that this process is called into question twice, for the production of both wings, male and female). In general, die casting processes have the greatest environmental impact. Exergy losses are inefficient uses of available energy that are irreversible, the wasted work potential. This is also called dissipated energy. and can be reduced with appropriate retrofit solutions. The Exloss value has also been included in the table because it is sometimes misunderstood as a metric for determining which sub-process is more energy-intensive and thus has the most room for improvement, both in terms of technological quality and sustainability. Once again, the total Exloss, which is 1.315 MJ, is the sum of exergies lost in sub-processes. Looking at the Exloss values of sub-processes, it is clear that there are cases where the result is consistent with that expressed by GWP 100y.
Exergy efficiency, ηg, is defined as the coefficient of resource-use performance. It is a dimensionless metric that may be expressed as a percentage. Exergy efficiency emphasizes the importance of assessing losses and internal irreversibilities in order to improve the performance. Higher exergy efficiency represents higher energy content used in the system, making the system more sustainable, while lower exergy efficiencies represent energy losses and internal irreversible reactions, resulting in low energy quality and a lower sustainable ranking. It is determined by dividing the useful exergy output by the total exergy input. The entire process under investigation has an average efficiency of 50.70%, putting steel corner production on a medium sustainable path. The ηg results are fully consistent with Exloss, highlighting die casting processes as the most energy-intensive sub-processes, as they were generated by pure exergetic analysis. Because ηg is not cumulative in this case, the efficiency of the process is represented by the value 12.34% of the die casting aluminum, regardless of the number of pieces produced. Its efficiency is slightly higher than the zamak, which contradicts the GWP 100y. The Exergetic Eco-Efficiency, ηeco, is used as a comparison metric between two similar processes. It is concerned with the potential difference in the impact of exergy generated from renewable sources versus exergy generated from non-renewable sources. Thus, the more precise it is possible to define which streams in the process come from renewable resources and which come from non-renewable resources, as opposed to the wise use of recyclable materials, the more reliable this metric becomes. The most notable difference in the case study in question is the amount of electricity absorbed by the machines in the various sub-processes, which is generated for approximately 9% by photovoltaics and the remainder purchased from nets, consisting of 20% coal, 1.1% oil, 61.2% natural gas, 5.1% nuclear, 8.7% renewable, and the remainder from a combination of sources.
Table 3. List of the main indicators’ results for each sub-process
|
Sub-process |
Metric |
|||||
|
GWP 100y [kgCO2eq] |
Exloss [MJ] |
ηg [%] |
ηeco [-] |
χ [-] |
FR [-] |
|
|
Die casting zamak |
0.0731 |
0.217 |
11.20 |
0.137 |
0.92 |
0.149 |
|
Die casting aluminum |
0.1674 |
0.445 |
12.34 |
0.114 |
0.89 |
0.229 |
|
Flattening and cutting |
0.0107 |
0.133 |
47.89 |
0.564 |
0.74 |
0.46 |
|
Washing |
0.0218 |
0.085 |
79.08 |
0.721 |
0.65 |
0.355 |
|
Vibro-tumbling |
0.0099 |
0.178 |
52.47 |
0.821 |
0.24 |
0.371 |
|
Shot blasting |
0.0321 |
0.186 |
63.28 |
0.680 |
0.58 |
0.431 |
|
Drilling and threading |
0.0036 |
0.071 |
88.65 |
0.873 |
0.17 |
0.444 |
|
Overall |
0.3186 |
1.315 |
50.70* |
0.559* |
0.60* |
0.348* |
*average between the values of each sub-process
Figure 4. Comparison of the contributions of each sub-process in terms of Global Warming Potential and Exergy loss
In light of the foregoing, and depending on the source of raw materials, the overall process has an average eco-efficiency of about 0.56, which is not directly comparable to simple energy efficiency, but when compared to the hierarchy of sub-processes, it is very consistent with what the GWP has expressed.
Furthermore, the two die casting processes are the worst sub-processes in terms of environmental impact. The Life Cycle Irreversibility Index, χ, complementary of the Life Cycle Quality Index ψ, supports to the comparison of processes and products having the same functional unit. In contrast to the previous indicator, this one emphasizes the value of useful exergy generated throughout the life cycle, as well as the recycling potential of waste materials, and thus the exergy that can be recovered rather than that which is completely lost. The Life Cycle irreversibility index considers the exergy inefficiency, however if a real system is compared to the latest technological innovations, or to an ideal Carnot machine, an index that measures technology obsolescence may be implemented. In terms of the case study, the Life Cycle Irreversibility Index confirms what the other indicators have said thus far: die casting processes are the most impacting, and in this case, those with the most irreversibility.
It should be noted that the majority of sub-processes have a relatively high value. This is due to the fact that all real processes are characterized by irreversibility, particularly those involving sudden changes in temperature, changes in state, or significant waste of auxiliary material that does not contribute to the increase in useful exergy generated. In fact, processes with less irreversibility include vibro-tumbling, drilling and threading, because there are no large temperature differences. On average, the entire production cycle of the steel corner piece is characterized by a 60% irreversibility. The Renewability Factor is calculated by dividing the cumulative exergy demand of renewable resources by the non-renewable resources. This metric is equivalent to the ηeco, but since it is calculated entirely on SimaPro using the hybrid CExD method, it eliminates the uncertainty that may arise when integrating the LCA and EA only at the end, rather than from the beginning. In the case study, FR also confirms that die casting processes are the least sustainable, with a low renewability factor. However, it is inconsistent with ηeco on the other sub-processes as well. The entire manufacturing process has a low renewability factor of 0.348 on average.
Finally, while all metrics agree that the zamak and aluminum die casting processes are the most energy-intensive and least sustainable, this agreement is not evident when compared to other sub-processes. Because the inventory developed within the LCA, which is carried out with SimaPro, is characterized by background data that already contains specific pre-set processing, the results of LCA and EA analysis cannot be directly compared. Here, is near talking about completely different metrics and orders of magnitude, to the point where SimaPro®’s CExD values and the results of pure exergetic analysis do not converge to comparable results. All of this adds uncertainty to the interpretation of the results for appropriate consumption mitigation and process optimization strategies. As a result, indicators derived from integrated EA-LCA analyses may appear to be a more consistent solution. It should be noted, however, that each indicator attempts to capture different aspects, as shown in Table 1 and better described above in this paragraph.
Sustainable manufacturing is the most critical factor to be recognized by all production engineers, not because it is a cultural trend, but because it is a requirement as an obligation to the environment in which we live. The study of the product life cycle has become a method of choice used to determine the environmental effect of the products or process or activities. The three main concepts to be considered are to minimize the usage of resources in the process, use environmentally friendly materials, reduce all types of waste and reuse and recycle as much material as possible to achieve the aim of earth’s self-recovery capability.
Based on what has emerged from the state of the art and the case study, it is not possible to identify an indicator that uniquely and comprehensively quantifies the degree of manufacturing sustainability, nor the one of the steel corner production process. Despite the lack of a standardized, comprehensive and widespread model of evaluation, Exergy Analysis within the Life Cycle thinking remains a good strategy for optimizing manufacturing processes.
The multi-dimensional structure of the metrics discussed in this work underlines how sustainable manufacturing is a complex issue. The lack of adequate metrics and a well-established collection of equations for a set of sustainability problems, as well as the lack of full and up-to-date data and uncertainty analysis, are often problematic in such a way as to make the assessment low in scientific accuracy.
|
EA |
Exergy Analysis |
|
Ex |
exergy flow rate, J.s-1 |
|
F |
resource |
|
FR |
dimensionless Renewability Factor |
|
CExD |
Cumulative Exergy Demand, MJ |
|
GHG |
Greenhouse Gas, CO2eq |
|
GWP |
Global Warming Potential, kgCO2eq |
|
IF |
dimensionless Impact Factor |
|
LCA |
Life Cycle Assessment |
|
m |
mass flow rate, kg.s-1 |
|
Greek symbols |
|
|
$\varepsilon$ |
net use |
|
$\eta$ |
dimensionless efficiency |
|
$\chi$ |
dimensionless technology obsolescence index |
|
$\Psi$ |
dimensionless life cycle quality index |
|
Superscripts and subscripts |
|
|
a |
product/process a |
|
b |
product/process b |
|
eco |
ecological |
|
g |
general |
|
i |
state point at the inlet of sub-process |
|
j |
state point at the outlet of sub-process |
|
loss |
flow rate loss during the sub-process |
|
nr |
non-renewable |
|
p |
product |
|
r |
renewable |
|
y |
years |
[1] Klaus, P. (2015). The Devil Is in the Details–Only What Get Measured Gets Managed. In Measuring Customer Experience (pp. 81-101). Palgrave Macmillan, London. https://doi.org/10.1057/9781137375469_7
[2] Joung, C.B., Carrell, J., Sarkar, P., Feng, S.C. (2013). Categorization of indicators for sustainable manufacturing. Ecological Indicators, 24: 148-157. https://doi.org/10.1016/j.ecolind.2012.05.030
[3] Selicati, V., Cardinale, N., Dassisti, M. (2020). The interoperability of exergy and life cycle thinking in assessing manufacturing sustainability: A review of hybrid approaches. Journal of Cleaner Production, 124932. https://doi.org/10.1016/j.jclepro.2020.124932
[4] UNI EN ISO 14040:2006, ‘Environmental management - Life cycle assessment - Principles and framework’, 2006. http://store.uni.com/catalogo/index.php/uni-en-iso-14040-2006.html.
[5] Selicati, V., Cardinale, N. (2020). Benchmarking sustainability on an industrial case within Industry 4.0 paradigm: Advantages of involving exergetic analysis in life cycle thinking. Tecnica Italiana-Italian Journal of Engineering Science, 63(2): 244-250. https://doi.org/10.18280/ti-ijes.642-418
[6] Gourmelon, S., Thery-Hetreux, R., Floquet, P., Baudouin, O., Baudet, P., Campagnolo, L. (2015). Exergy analysis in ProSimPlus® simulation software: A focus on exergy efficiency evaluation. Computers & Chemical Engineering, 79: 91-112. https://doi.org/10.1016/j.compchemeng.2015.02.014
[7] Cornelissen, R.L., Hirs, G.G. (2002). The value of the exergetic life cycle assessment besides the LCA. Energy Conversion and Management, 43(9-12): 1417-1424. https://doi.org/10.1016/S0196-8904(02)00025-0
[8] Mejia, L.C.A., Toledo, C.E.E., Rayle, B.M.R. (2012). Decision making in sustainable development: some methods to evaluate energy and nonrenewable resources waste when using some plastics. American Journal of Operations Research, 2(3): 399-407. https://doi.org/10.4236/ajor.2012.23048
[9] Portha, J.F., Louret, S., Pons, M.N., Jaubert, J.N. (2010). Estimation of the environmental impact of a petrochemical process using coupled LCA and exergy analysis. Resources, Conservation and Recycling, 54(5): 291-298. https://doi.org/10.1016/j.resconrec.2009.09.009
[10] Shirkhani, A., Kouchaki‐Penchah, H., Azmoodeh‐Mishamandani, A. (2018). Environmental and exergetic impacts of cement production: A case study. Environmental Progress & Sustainable Energy, 37(6): 2042-2049. https://doi.org/10.1002/ep.12894
[11] Hamut, H.S., Dincer, I., Naterer, G.F. (2014). Exergoenvironmental analysis of hybrid electric vehicle thermal management systems. Journal of Cleaner Production, 67: 187-196. https://doi.org/10.1016/j.jclepro.2013.12.041
[12] Singh, R.K., Murty, H.R., Gupta, S.K., Dikshit, A.K. (2009). An overview of sustainability assessment methodologies. Ecological Indicators, 9(2): 189-212. https://doi.org/10.1016/j.ecolind.2008.05.011
[13] United Nations (2019). Guidelines for the Development of a Criteria and Indicator Set for Sustainable Forest Management. UN, 2019.
[14] Boulanger, P.M. (2008). Sustainable development indicators: a scientific challenge, a democratic issue. SAPI EN. S. Surveys and Perspectives Integrating Environment and Society, (1.1). Available: http://journals.openedition.org/sapiens/166.
[15] Bakshi, B.R., Fiksel, J. (2003). The quest for sustainability: Challenges for process systems engineering. AICHE Journal, 49(6): 1350-1358. https://doi.org/10.1002/aic.690490602
[16] Rosen, M.A., Dincer, I., Ozbilen, A. (2012). Exergy analysis and its connection to life cycle assessment. Life Cycle Assessment Handbook: A Guide for Environmentally Sustainable Products, 185-215. https://doi.org/10.1002/9781118528372.ch8
[17] Cleveland, C.J., Kaufmann, R.K., Stern, D.I. (2000). Aggregation and the role of energy in the economy. Ecological Economics, 32(2): 301-317. https://doi.org/10.1016/S0921-8009(99)00113-5
[18] Böhringer, C., Jochem, P.E. (2007). Measuring the immeasurable—A survey of sustainability indices. Ecological Economics, 63(1): 1-8. https://doi.org/10.1016/j.ecolecon.2007.03.008
[19] Bakshi, B.R., Gutowski, T.G., Sekulić, D.P. (Eds.). (2011). Thermodynamics and the Destruction of Resources. Cambridge University Press.
[20] 2006 IPCC Guidelines for National Greenhouse Gas Inventories, Industrial Processes and Product Use., vol. 3, 5 vols. IPCC, 2006.
[21] Domínguez, A.E.R., Fernández, M.C., Soria, C.G., Clavijo, D.O., La, P.D., Nodal, C.M., Moya, A.M.C., Morales, M.C. (2011). Exergetic Life Cycle Analysis in the Selection of Energetic Sources for Isolated Communities in Latin American. 10.
[22] Ozbilen, A., Dincer, I., Rosen, M.A. (2012). Exergetic life cycle assessment of a hydrogen production process. International Journal of Hydrogen Energy, 37(7): 5665-5675. https://doi.org/10.1016/j.ijhydene.2012.01.003
[23] Toxopeus, M.E., Lutters, E., Houten, F.V. (2006). Environmental Indicators & Engineering: an alternative for weighting factors. Proceedings of LCE2006, Leuven.
[24] Gulotta, T.M., Guarino, F., Mistretta, M., Cellura, M., Lorenzini, G. (2018). Introducing exergy analysis in life cycle assessment: A case study. Mathematical Modelling of Engineering Problems, 5(3): 139-145. https://doi.org/10.18280/mmep.050302
[25] Koroneos, C., Stylos, N. (2014). Exergetic life cycle assessment of a grid-connected, polycrystalline silicon photovoltaic system. The International Journal of Life Cycle Assessment, 19(10): 1716-1732. https://doi.org/10.1007/s11367-014-0752-z
[26] Brundtland, G.H. (1987). Report of the World Commission on environment and development:" our common future." UN.
[27] Dewulf, J., Van Langenhove, H., Mulder, J., Van den Berg, M.M.D., Van der Kooi, H.J., de Swaan Arons, J. (2000). Illustrations towards quantifying the sustainability of technology. Green Chemistry, 2(3): 108-114. https://doi.org/10.1039/B000015I
[28] Valero, A., Valero, A., Domínguez, A. (2013). Exergy Replacement Cost of Mineral Resources. Journal of Environmental Accounting and Management, 13.