A. Greco* | C. Masselli
OPEN ACCESS
One of the most significant contributions in energy request lies in refrigeration and air conditions. A drastic "change of course" is necessary, starting from mutating the concepts of energy sources and the way we conceive air-conditioning. Therefore, the need for the scientific community to focus on renewable sources is growing, among them a very promising technique is solar cooling.
In this paper a dynamic investigation of a solar absorption plant for air-conditioning of an office building located in Naples (Italy) is introduced. The system is based on evacuated-tube solar collectors. The hot water coming from the solar collectors is employed to supply the cooling absorption system for cold-water producing used in the air conditioning. If the water coming from solar collectors does not have a temperature adequate to correctly supply the absorption system, the intervention of boilers as backup systems is planned. The investigation aims to analyse the energy performances of the system during the whole cooling season. To this hope a transient dimensional model was developed to dynamically simulate the solar cooling system coupled to the building.
air conditioning, solar cooling, evacuated tube collectors, transient model, renewable energy
Scientists who assess the health of our planet see indisputable evidence that Earth has been getting warmer, in some cases rapidly. Most believe that human activities, in particular the burning of fossil fuels and the resulting build-up of greenhouse gases in the atmosphere have influenced this warming trend [1-3]. The 21st century sees a remarkable augmentation of the energy demand: the worldwide annual per capita energy consumption climbed from 1400 kWh in 1975 to 3200 kWh in our days, as documented by the World Bank Open Data [4]. This need for energy touches all the sectors [5]. Among the most crucial ones there are the heating, cooling, and air conditioning fields, to which more than 20% of the total all-over the world energy consumption is attributed [6, 7]. A drastic "change of course" is necessary, starting from mutating the concepts of energy sources and the way we conceive cooling and air conditioning. The growing interest in finding alternative to refrigeration and Heating Ventilation & Air Conditioning (HVAC) systems based on vapor compression, has oriented scientific community in developing solutions based on renewable energies. Renewable energy refers to the provision of energy via renewable resources which are naturally supplied fast enough as being used. The most common are solar, wind, biomass, rain, tides, waves, and geothermal heat-based energies.
In this paper attention is focused on solar energy. Italy has a generally hot and sunny climate, and many buildings use electrically powered air conditioning for much of the year. The multi-year (2004-2010) mean of annual global horizontal irradiance for Italy is shown in Figure 1. The Figure clearly shows that the global irradiation for Italy goes from a minimum around 900 kWh m-2 (Northern Italy) to a maximum of 1850 kWh m-2 (Sicily).
Figure 1. The multi-year (2004-2010) mean of annual global horizontal irradiance for Italy
The Italian climate gives suitable conditions for solar powered cooling system operation. Therefore, a clean and sustainable cooling system, such as solar cooling, can provide an alternative green source for comfort in buildings.
The solar cooling system is an environmentally friendly system which consumes renewable energy. Among the potential options for solar cooling, solar powered absorption cooling system is competitive due to the high efficiency and commercialization of absorption chiller. A solar absorption cooling system generally consists of: a solar collector plant, an absorption chiller interfacing with hot and cold heat storage tanks and with cooling towers, cooling load, pumps and control units.
In this paper is introduced a dynamic investigation of a solar absorption plant for air-conditioning of an office building located in Naples (Italy). The system is based on evacuated-tube solar collectors [8]. The hot water coming from the solar collectors is employed to supply the cooling absorption system for cold-water producing used in the air conditioning. If the water coming from solar collectors does not have a temperature adequate to correctly supply the absorption system, the intervention of boilers as backup systems is planned. The investigation aims to analyse the energy performances of the system. To this aim a model of a solar cooling system has been developed in TRNSYS.
The solar cooling system was projected to satisfy the energy demand of an office building located in Naples (Italy). The plant is able to produce thermal energy during the entire operating year to obtain hot water. During the summer, hot water feeds an absorption refrigeration system for the production of cold water to be employed for the air conditioning of the rooms of the building. In the event that the water temperature is lower than the minimum value needed to guarantee the properly operation of the absorption system, the intervention of the boilers of the thermal power plant is envisaged, as a backup system. In the winter, hot water is used directly as an integration to the existing central heating system.
In order to optimize the use of the Solar Collector Plant (SPC) during the summer season, the collectors are arranged according to an azimuth angle of +10° SW and a slightly accentuated inclination angle with respect to the horizon, with consequent reduction of the visual impact.
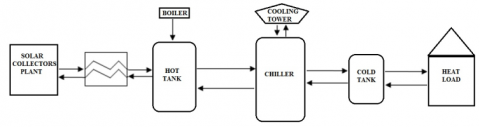
Figure 2. Block diagram of the components composing the solar cooling system
In Figure 2 is reported a schematic of the components composing the plant. As clearly visible from the figure the system is composed by:
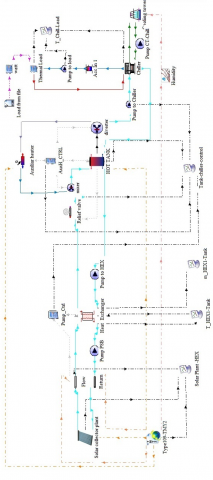
With the purpose of testing and optimizing its operation, the system described in section 2 has been modelled through the software TRNSYS with the weather data of Naples (40°51'22''N; 14°14'47''E). The detailed scheme of the TRNSYS model of the solar cooling system is visible in Figure 3.
3.1 Solar Collector plant
The solar collector plant is constituted by 360 Evacuated Tube Collectors (ETC) placed in 90 parallel strings for a total gross area of 1500 m2. The heat transfer fluid is a 30%Ethylene-Glycol/70%Water (30%EG-70%W) mixture (Cp=3.831 kJ kg-1K-1 at 20°C) and the fluid flow rate of the SPC circuit is 30000 kg hr-1.
The transient efficiency of the collector is defined as the ratio between the useful power (transferred to the heat transfer fluid) and the radiant power incident on the collector:
$\eta=\frac{\dot{Q}_{u}}{A_{C} \cdot \mathrm{G}}$ (1)
$\eta=\frac{\dot{m} C_{p}\left(T_{o u t}-T_{i n}\right)}{A_{c} \cdot G}$ (2)
According to the Ghaderian and Sidik [9] Eq. (2) could be expressed through the coupled second-degree polynomial:
$\eta=a_{0}-a_{1} \frac{\Delta T}{G}-a_{2} \frac{\Delta T^{2}}{G^{2}}$ (3)
Indeed, the thermal efficiency of the single ETC employed in the introduced solar collector plant is:
$\eta=0.808-3.34 \frac{\Delta T}{G}-0.02 \frac{\Delta T^{2}}{G^{2}}$ (4)
3.2 Heat exchanger
The heat exchanger has nominal power of 550 kW, needed to ensure the heat transfer between the 30%EG-70%W mixture, flowing in SPC circuit, and the water supplying the hot storage tank circuit. Indeed, the overall heat transfer coefficient is 75 kW K-1. A logical control is coupled to the heat exchanger in order to disable the SPC circuits whenever the temperature of the SPC outlet water falls down the set point temperature, due to intermittent availability of the solar energy during the day.
Figure 3. TRNSYS scheme of the solar cooling system
3.3 Storage tanks
The hot storage tank, placed downstream of a relief valve that controls the pressure in the circuit, has 25000 lt as volume and it is a stratified storage tank with uniform losses (0.83 W m-2 K-1 as uniform tank losses coefficient). The tank is modeled following multi-node approach in which it is divided in 10 nodes. Each node is governed by the tank energy balance as a function of time. The highest node of the tank is the outlet for the fluid supplying the chiller and the lowest node is the return flow towards the tank.
To guarantee the correct operation of the absorption chiller, the hot water inlet temperature must be equal or greater than 80 °C. Indeed, an auxiliary heater is placed parallel to the tank and it is regulated by an ON-OFF logical control. Whenever the outlet water temperature toward the chiller is lower than the set point temperature (80°C) the control enables the integrated boiler circuits until the set point temperature in the highest node of the tank is reached.
The cold storage tank is placed between the chiller and the thermal load; it has a volume of 4000 lt and it is a stratified storage tank with uniform losses too (0.83 W m-2 K-1 as uniform tank losses coefficient). The cold storage tank is placed to continuously supply the air conditioning system of the building with cold water at the desired set point (10°C).
3.4 Absorption chiller
The absorption machine is a Br-Li chiller having 470 kW as nominal power, 350 kW as rated capacity and 0.73 as rated COP. The chiller interfaces with two cooling towers having 400 kW as heat exchange rated capacity each. The flow rate of chilled water toward the heating load is 58400 kg hr-1.
3.5 Building and thermal load
The solar cooling system is projected to meet the cooling energy demand of an ideal office building of 2500 m2 as global surface area. The roof is made of two-layer cement and waterproofed with a double-layer. The office time schedule is from 8:00 to 18:00 and the whole area can be considered as single thermal zone. the average daily usage is 150 units. The walls are made of brick cement and 120 windows of 2.50 m2 surface each.
The office building is modeled through the Energy Plus 8.3 software and consequently, the hourly thermal loads were calculated. Thus, by simulating this model, a typical seasonal cooling demand on an hourly timescale was generated.
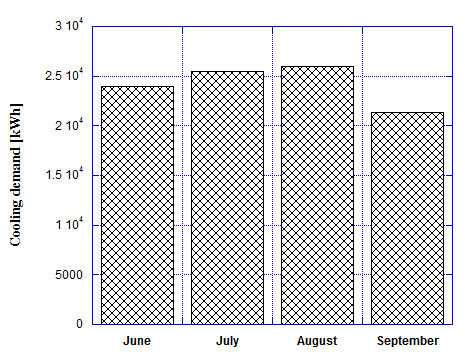
The office building was coupled to the solar cooling system by means of timesheet files to account the typical seasonal cooling demand on hourly scale, during the system operation. In Figure 4 is reported the monthly cooling demand of the office building for the months from June to September. As expected, due to the hot seasonal temperatures, the highest cooling demand are registered for the months of July and August.
Figure 4. Monthly load cooling demand
The model introduced in section 3 was run during the whole summer season, specifically from June 1st to September 30th of a typical meteorological year considering the weather data of Naples (40°51'22''N; 14°14'47''E). In this section detailed results in terms of temperature and energy, on the system operation, are reported.
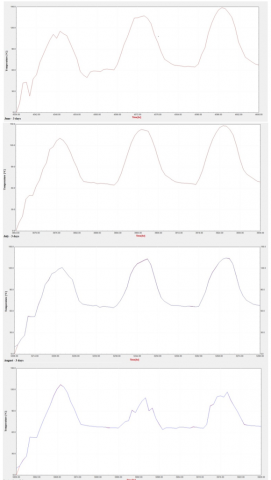
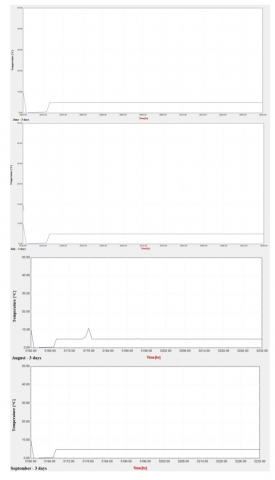
In Figure 5 the June to September the temperature trends of the outlet flow from SCP are reported. Specifically, 3 representative days for each month were plotted. As clearly visible from the Figure during the working time the SPC is able to warm up the heat transfer fluid satisfactory (up to 90°C). Moreover, from the figure one can notice that the highest temperatures are registered in June and July to decrease slowly during August and September. The latter observation found confirm in the intensity of the available solar incident radiation that is higher in the months of June and July.
Figure 5. June to September temperatures of the outlet flow from solar collector plant plotted for three representative days per month
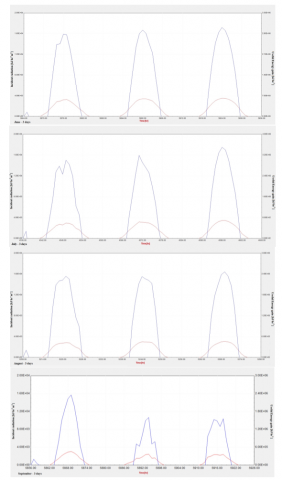
In Figure 6 the solar incident radiation and useful energy gain of the solar collector plant are plotted for the period June to September, with three days per month. With reference to the red plot one can notice that the available solar incident radiation is higher in the months of June and July, touching a maximum peak at 01:00 PM of around 3800 kJ hr-1 m-2 and 3900 kJ hr-1 m-2, respectively. Correspondingly, at the same time hour, the useful energy gain of the SCP touches a peak of 2.8 106 kJ hr-1 and 3.0 106 kJ hr-1, respectively in June and July. Thus, integrating with respect to the time for one day of June and converting in kWh, the daily useful energy given by SCP is around 8550 kWh, whereas for July is 9500 kWh daily. In August the useful energy gain slightly decreases with a punctual peak of 2.39 106 kJ hr-1 for a per-day useful energy amount of 6640 kWh. A more drastic reduction of the sunlight time per day and, simultaneously, of the intensity of the incident radiation in September carries to a lower daily peak (1.6 106 kJ hr-1) and consequently to a smaller amount of useful energy per day (4490 kWh).
Figure 6. June to September solar incident radiation (red plot and left-side y-axes) and useful energy gain of the SCP (blue plot and right-side y-axes) for three days per month
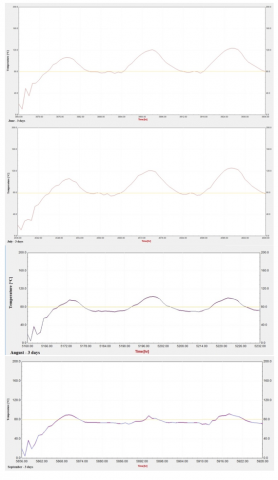
In Figure 7 the June to September temperatures of the water flow from the heat exchanger toward the hot tank are reported for three representative days for each month. The orange line is an ideal one indicating the minimum acceptable temperature (80°C) for flow inlet in the hot tank for correct storage of the water. During the summer, this requirement is almost always addressed. During the working time of the (office 08:00AM - 18:00 AM), in the months of June, July and August the solar collector plant water is always able to enter to the tank with the temperature greater than 80°C. In the month of September, due to the lower intensity of the incident solar radiation, during a cloudy day this condition could not be satisfied, as visible in Figure 7 for the second representative day of September. In this case and anyhow, whenever this condition is not verified (water temperature from heat exchanger to hot storage tank equal or greater than 80°C), the correct operation of the absorption chiller could not be guaranteed. Indeed, the AUX_control enables the integrated boiler circuits until the set point temperature in the highest node of the tank is reached.
Furthermore, whenever the temperature of the fluid flowing toward the HEX from the SPC becomes lower than the temperature of the water returning to the heat exchanger from the tank, 2, another dedicated logical control (PUMP_control) on the HEAX disables the heat exchange with the solar collector plant and the coming flow circulates in a thermal closed loop. The ON/OFF time of this heat exchange control is clearly visible in Figure 8 (blue line under the name of PUMP_control).
Figure 7. June to September temperatures of the water flow from the heat exchanger toward the hot tank are reported for 3 representative days for each month
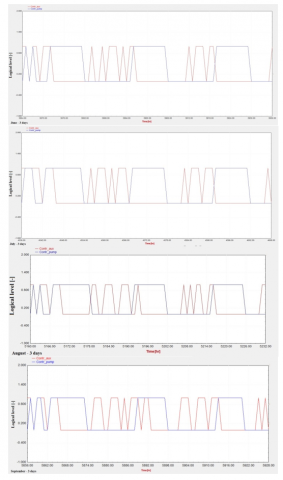
In Figure 8 the ON/OFF time of the above mentioned controls (AUX_control and PUMP_control) of the solar cooling system are shown. Specifically, the blue line represent the logical level of the control on the heat exchanger (PUMP_control) that regulates the heat transfer from the 30%EG-70%W mixture, flowing in SPC circuit, to the water supplying the hot storage tank circuit. The red line shows the logical level of the AUX_control, i.e. the ON/OFF time of the auxiliary heater placed in parallel with the hot storage tank to supply hot water whenever the outlet water temperature from the tank toward chiller is lower than the set point temperature (80°C). Indeed, when this condition is verified the AUX_control is high (logical level=1, i.e. ON) and it enables the integrated boiler circuits until the set point temperature in the highest node of the tank is reached.
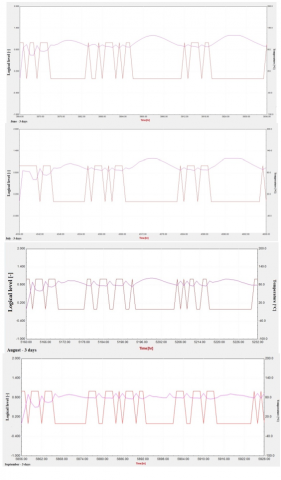
To further clearness, in Figure 9 the same control on auxiliary heater (red line) is plotted together with the temperature trends of the outlet water flow from hot tank to chiller (purple line). These two lines are reported on the same graph because it is easily distinguishable when the hot water comes from the solar collector plant and when the auxiliary heater activates to supply the chiller. One can notice the more frequent activation of the boiler during the month of September, especially in the cloudy day. Worthy of notation is that the boiler is activated when the water temperature is lower than 80°C and it is deactivated when the temperature grows up to 90°C. This threshold value avoids the undesired intermittent operation of the boiler in very short time intervals, that could cause instability in the system. Anyhow the above introduced control system (boiler in parallel to the tank and control on the heat exchange) always guarantees the correct operation of the chiller during the summer.
Figure 8. June to September ON/OFF time of the controls on the heat exchanger (blue line) and auxiliary boiler (red line) of the solar cooling system
Figure 9. June to September ON/OFF time of the controls on the auxiliary boiler (red line) and outlet water flow from hot tank to chiller (purple line)
Figure 10. Chilled water temperature provided to load after cold tank storage is plotted for three representative days for each month from June to September
In Figure 10 the chilled water temperature provided to load after cold tank storage is plotted for three representative days for each month from June to September. As clearly visible from all the figures the requirement of having a cold temperature to the load smaller than 10°C is always met. This is due to double combination of the solar collector plant and the auxiliary boiler.
In this paper a model of solar cooling system, developed through the software TRNSYS, has been introduced. The model was used to conduct a dynamic investigation with the system coupled to an office building located in Naples (Italy). The system is based on evacuated-tube solar collectors. The hot water coming from the solar collectors is employed to supply the cooling absorption system for cold-water producing used in the air conditioning. The double combination of the solar collector plant and an auxiliary boiler ensures the right operation of the chiller. The presented results shown the correct operation of the solar cooling system that is able to satisfy the cooling demand of the office.
|
A |
surface, m2 |
|
a |
coefficient, - |
|
C |
heat capacity, J kg-1 K-1 |
|
G |
incident radiation, W m-2 |
|
$\dot{\mathrm{m}}$ |
flow rate, kg s-1 |
|
$\dot{\mathrm{Q}}$ |
power, W |
|
T |
Temperature, °C |
|
Greek symbols |
|
|
Δ |
finite difference, - |
|
$\eta$ |
collector transient efficiency, - |
|
µ |
dynamic viscosity, kg. m-1. s-1 |
|
Subscripts |
|
|
0 |
zero-order |
|
1 |
first-order |
|
2 |
second-order |
|
in |
inlet |
|
out |
outlet |
|
p |
constant pressure |
|
u |
useful |
[1] Le, T.H., Chang, Y., Park, D. (2020). Renewable and nonrenewable energy consumption, economic growth, and emissions: International evidence. The Energy Journal, 41(2). https://doi.org/10.5547/01956574.41.2.thle
[2] Afridi, M.A., Kehelwalatenna, S., Naseem, I., Tahir, M. (2019). Per capita income, trade openness, urbanization, energy consumption, and CO2 emissions: An empirical study on the SAARC Region. Environmental Science and Pollution Research, 26(29): 29978-29990. https://doi.org/10.1007/s11356-019-06154-2
[3] Al-Ghussain, L. (2019). Global warming: review on driving forces and mitigation. Environmental Progress & Sustainable Energy, 38(1): 13-21. https://doi.org/10.1002/ep.13041
[4] World Bank Open Data - Electric power consumption (kWh per capita). Available online: https://data.worldbank.org/indicator/EG.USE.ELEC.KH.PC, accessed on March 17th 2020.
[5] Armeanu, D.S., Gherghina, Ş.C., Pasmangiu, G. (2019). Exploring the causal nexus between energy consumption, environmental pollution and economic growth: Empirical evidence from central and Eastern Europe. Energies, 12(19): 3704. https://doi.org/10.3390/en12193704
[6] Franzén, I., Nedar, L., Andersson, M. (2019). Environmental comparison of energy solutions for heating and cooling. Sustainability, 11(24): 7051. https://doi.org/10.3390/su11247051
[7] Greco, A., Masselli, C. (2020). Reduction of the Greenhouse Gasses Emissions in Refrigeration. Tecnica Italiana: Italian Journal of Engineering Science, 64(1): 30-38. https://doi.org/10.18280/ti-ijes.640107
[8] Greco, A., Gundabattini, E., Gnanaraj, D.S., Masselli, C. (2020). A comparative study on the performances of flat plate and evacuated tube collectors deployable in domestic solar water heating systems in different climate areas. Climate, 8(6): 78. https://doi.org/10.3390/cli8060078
[9] Ghaderian, J., Sidik, N.A.C. (2017). An experimental investigation on the effect of Al2O3/distilled water nanofluid on the energy efficiency of evacuated tube solar collector. International Journal of Heat and Mass Transfer, 108: 972-987. https://doi.org/10.1016/j.ijheatmasstransfer.2016.12.101