Carlo Cravero | Davide De Domenico | Philippe Joe Leutcha*
OPEN ACCESS
The use of CFD has proven to be a very effective tool for the design of regenerative systems in glass production plants. Different CFD approaches have been set up by the authors to simulate the regenerative chambers to include heat transfer and pressure losses effects from the internal refractory structure. The above models have been used to conceive a gas recirculation strategy for the NOx containment from natural gas combustion and are currently used in industry to design such systems. On the other hand, it can be observed that the actual geometry found in a new regenerative chamber or after years of continuous operation is different from the CAD geometry used in the design process. In fact, the CAD geometry has sharp edges at the junction of solid surfaces while the actual geometry of a refractory block is with blunt edges and the above edges are rounded off by corrosion and erosion processes during operation. The effects of the above geometrical details on the flow structure inside the furnace components have been highlighted in a previous paper. The dramatic change that can occur in the flow topology with the introduction of those geometrical details can jeopardize the use of the standard CFD approaches for design purposes. In the present paper the attention is focused on the regenerative chamber with the gas recirculation systems. This NOx containment strategy is effective if the recirculated gases, in the regenerative chamber with combustion air, are correctly distributed above the flame structure in order to reduce the maximum temperature that will cause NOx formation. The effects of the geometrical details on the edges in the regenerative chamber are investigated in order to develop a more effective and consistent design approach based on CFD and to setup a proper simulation tool to predict the effects of erosion (rounded edges) on the gas recirculation strategy. The simulation approach is applied to actual regenerative chambers equipped with the gas recirculation strategy to understand the above effects on an existing glass production plant.
glass industry, CFD, gas recirculation system
Glass is a very ancient material, which, however, continues to be widely used nowadays, even in high-tech applications. For the production of this material, large quantities of heat are required and consequently high fossil fuel consumption. To limit the environmental impact of industrial plants, the presence of heat recovery systems (HRS) from exhaust gases and the containment of harmful emissions such as NOx and CO is essential.
A system almost 200 years old, but still valid, is the most used and efficient in the case of large plants. It involves the use of two or more regenerative towers, built with refractory materials, for the storage of heat from the fumes. The operation of this system requires that the air and the gasses flows through the two towers alternately, with cycles of about 20 minutes, thus activating the accumulation and release of thermal energy to the combustion air for preheating. The air reaches temperatures that exceed 1400°C, allowing a considerable fuel saving.
This heat recovery system has been extensively studied by various authors in various industrial applications [1-4]. The problem that arises, however, is that the high temperature reached inside the combustion chamber causes the formation of considerable quantities of polluting gases such as nitrogen oxides (NOx) [5]. To contain the emissions, various techniques and technologies have been studied [6]: They can act directly or indirectly on the combustion process. A commonly used system in regenerative furnaces is the waste gas recirculation (WGR): through a separate circuit a percentage of the fumes is introduced into the combustion air in order to dilute the comburent and limit the production of NOx during combustion. The introduction of gas takes place in the lower part of the regenerative towers and they flow with the air to the combustion chamber. In order to work properly and not to generate other types of pollutants, the introduction of exhaust gases must be limited and localized in the burner areas, in order to obtain maximum efficiency [6, 7].
The authors have developed several numerical models that demonstrate that CFD can be an effective tool for the study of these systems [7-10]. However, to improve the accuracy of the simulation process the geometry modelling is considered important in these flow structures where large flow separations can occur. The standard CFD approach uses the CAD model from design drawings where some technological features, which can affect the flow structure within the fluid domain, are not present. Moreover, the effect of erosion due to continuous operation modifies the geometry and the internal flow structures. As discussed in [11], the furnace has some geometric features that are not taken into account in the 3D basic design drawings. This is true for internal edges: in the original CAD they are all sharp edges. However, in the real built new furnace most of the edges are blunted (due to refractory manufacturing process), while after years of continuous operation they are rounded due to erosion [12].
As already verified, a small variation of these geometrical features can determine a significant change in the flow structure, strongly affecting the extent of flow recirculations.
In this paper, the impact of these technological details with the activation of flue gas recirculation system has been studied. The possible variations in the distribution of the fumes in the upper part of the regeneration tower, which can affect the effectiveness of the system, are discussed in some detail. The analyses are based on CFD calculations using the ANSYS Fluent software.
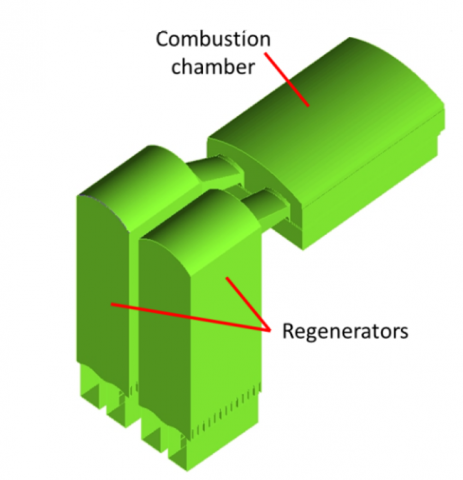
A typical regenerative furnace for the production of glass consists of two fundamental components (Figure 1):
Figure 1. Typical configuration of a regenerative glass furnace
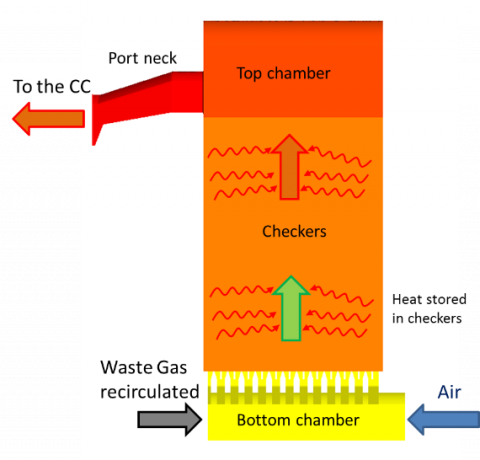
The latter in the case of a regenerative furnace consists of large towers, made of refractory material, which can be divided into four parts (Figure 2):
The WGR system operates a by-pass of part of the fumes towards the incoming air flow. This occurs thanks to the a separate circuit at the base of the regenerative towers. The flow of recirculated gas enters the lower chamber, together with the air, is dragged by the buoyancy effect towards the upper part of the regenerator and enters the furnace (Figure 2).
For the study, the geometry consisting of an entire regenerative tower and a portion of the combustion chamber is taken into account. The mesh generated for the numerical calculation consists of structured grids for the lower part and for the checkers zone, while the upper volume has been discretized with an unstructured mesh. Due to the introduction of detailed geometrical features, the choice of the unstructured mesh is more convenient. Fluent software was used for the simulations with the RANS approach and steady flow. The turbulence model chosen for closure is the k-epsilon realizable: it has been selected for these type of problems (presence of separations and recirculations) from previous analysis [11]. To take into account the different characteristics of gas and air the compositions of the fluids is considered and the multispecies fluid model is activated with transport equations for the different chemical species.
Figure 2. Regenerative tower
The checkers zone is modelled as a porous domain in order to consider the pressure loss inside the checkers ducts [9, 10]. In this case the thermal equilibrium model [10] has been used thanks to the availability of reference temperature data. The boundary conditions are summarized in Table 1.
Table 1. Boundary conditions
|
Inlet (air, gas) |
Mass flow, temperature, composition |
|
Outlet |
Outflow |
|
Wall |
No slip condition |
Figure 3. Modified zones
The simulations were carried out considering the different geometric details (chamfers and rounding) that will be present in the actual plants; the results are compared with the ideal case of CAD model with sharp edges. Three geometries were considered:
The changes were concentrated in the port neck areas shown in Figure 3; it is a fundamental component during both operating modes of the chamber (hot phase with exhaust gases and cold phase with combustion air) and it directly influences the flow structure of the fumes into the chamber (hot phase) and of the air into the furnace (cold phase).
The discussion of the results is divided into two parts. The first part deals with the impact of the flow of fumes in the process of mixing fluids; the second of the effect of the edges on the structure of the mixed air-gases flow.
3.1 Mass flow increase effect
This study was carried out on the CAD model of the furnace with sharp edges, varying the recirculated exhaust gas flow rate. The mass flow rates of the recirculated fumes considered are 15 % and 20 % of the incoming air flow.
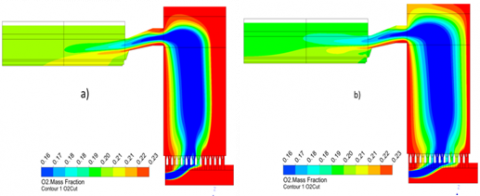
Figure 4 shows the distribution of oxygen (mass fraction) in a meridian section for both cases.
Figure 4. O2 mass fraction distribution at a WGR percentage of (a) 15 % and (b) 20 % of the incoming air
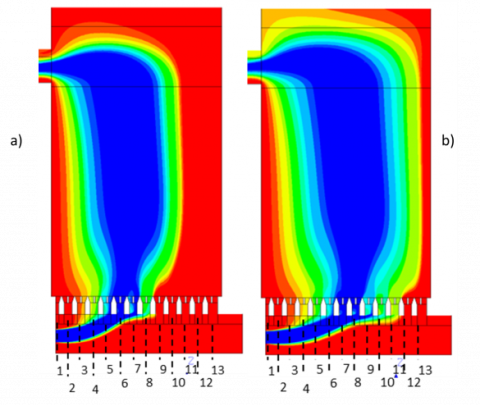
By observing the distribution in the regenerative chamber, it can be noted that the mixing zone of the fluids increases with the mass flow rate. This phenomenon is linked to the increase in the momentum of the fumes: the higher the flow rate, the more the fumes enter the lower chamber taking more space for mixing before flowing up to the top chamber. The above aspect is highlighted in Figure 5 where a detail of the O2 mass fraction in the chamber is reported. Note that for WGR=20 %, the fumes enter the checkers inlets between sections 6 and 9 (Figure 5b) while with WGR=15 %, the fumes enter the regenerator between sections 5 and 7 (Figure 5a). As a consequence, the wider mixing zone at the base of the structure introduces a flow with a lower concentration of oxygen at the port neck inlet section.
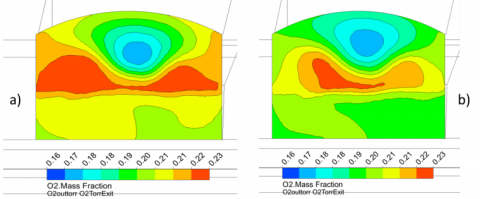
To analyse the impact on the entrance area of the combustion chamber, which represents the crucial section for testing the effectiveness of the WGR system, the percentage of oxygen at the exit of the port neck is plotted, as shown in Figure 6. Comparing the two cases, there is a zone with a high concentration of oxygen in the lower part of the port neck exit, which is much more evident when the recirculated mass flow rate is lower (Figure 6a).
Figure 5. Detail of the mixing zone in the bottom chamber for the case 15 % (a) and 20 % (b)
Figure 6. Oxygen distribution at Port neck exit section for 15 % (a) and 20 % (b)
From the above results it can be drawn that a good fumes stratification over the flame (to lower maximum flame temperatures to reduce NOx) can be obtained with a higher quantity of recirculating fumes, properly fed into the chamber.
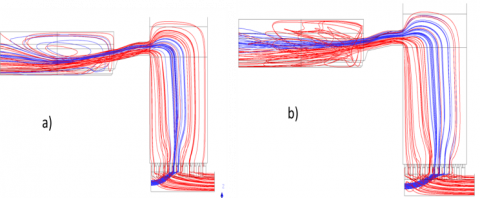
Figure 7 shows the flow structure inside the combustion chamber for the various mass flow rates. This structure is characterized by flow recirculation areas whose amplitude varies with the percentage of gas recirculated.
Figure 7. Great recirculation zone at the CC entrance for 15 % (a) and 20 % (b) of WGR
3.2 Edge shape impact on the flow structure and oxygen distribution
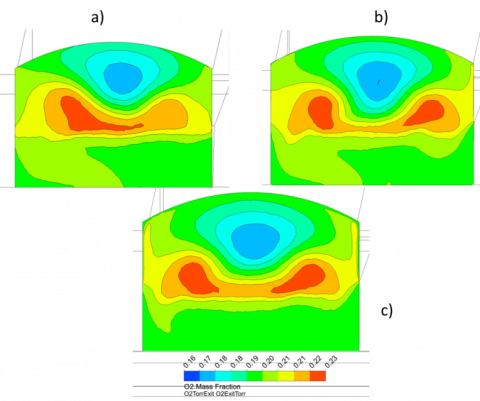
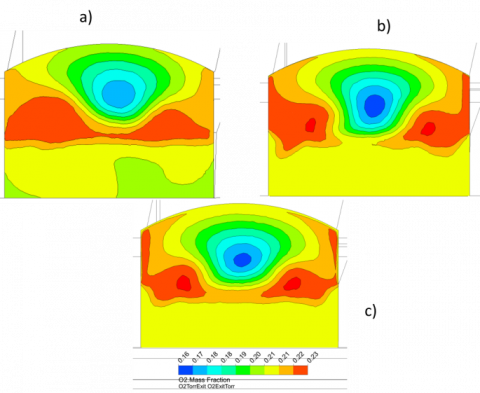
In this paragraph the influence of the geometrical detailed features on the flow structure, with respect to the previous results, is highlighted. With the same boundary conditions of the previous model including the flue gas flow rate (cases WGR=20% and 15%), the edges were modified as shown in Figure 3. Figure 8 illustrates the effect of edges on the flow mixing with WGR=20%. It can be noticed that the oxygen distributions for the model with blunt (Figure 8b) and curved (Figure 8c) edges are very different from the sharp edge case (Figure 8a). The area with lower oxygen concentration moves towards the central zone of the port neck exit both in the blunt and in the curved edges case.
Figure 8. O2 distribution at port neck exit with edge modifications WGR=20%: a) sharp, b) blunt, c) curved
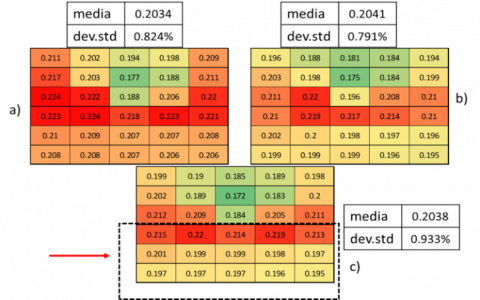
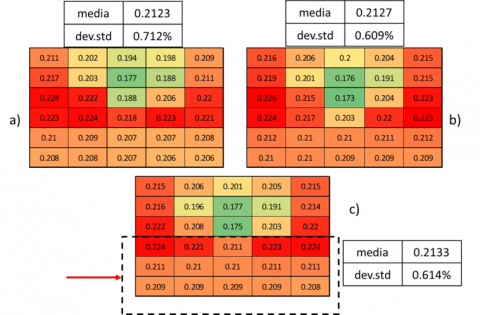
The CFD results can be processed to obtain a quantitative comparison of the flow distribution at the port neck exit section. Figure 9 shows the comparison of the oxygen distributions in the three cases considered. Each cell represents a small portion of the exit section of the port neck where the average composition (mass fraction) is computed. To evaluate the non-uniformity of the distribution, the standard deviation of the values with respect to the mean is calculated. As a rule, the larger the standard deviation, the more uneven the flow structure. The results of the analysis show that the blunt edge model has a better distribution of oxygen than the curved and sharp case. This confirms that the results obtained by the standard CAD model do not fully reflect the actual operating conditions of the furnace. Furthermore, the erosion tends to negatively impact on the mixing of air and recirculating fumes and therefore on the reduction of NOx.
Figure 9. Local distribution of the oxygen mass fraction at port neck exit: a) sharp edges, b) blunt edges, c) curved edges
The analysis can be further refined by considering only the lower area of the port neck outlet section as indicated in Figure 10. The composition in this portion is the one available to the burners when combustion occurs. Hence the oxygen distribution here is essential for the WGR performance evaluation. From the value of the standard deviation there is a higher dispersion in the configuration that simulates the eroded furnace (Figure 10c).
Figure 10. O2 distribution with mean and std. dev. values for the bottom part of the port neck in case WGR=20%: a) sharp edges, b) blunt edges, c) curved edges
Figure 11. O2 distribution with mean and std. dev. values for the bottom part of the port neck WGR=15%: a) sharp edges, b) blunt edges, c) curved edges
Figure 12. O2 distribution at port neck exit with edge modifications WGR=15%: a) sharp, b) blunt, c) curved
The model with blunt edges (Figure 10b) representative of the new furnace has a more uniform distribution. A non-uniformity in the concentration, despite a similar mean value, can cause a local increase in the production of NOx.
Similar results have been obtained for a lower mass flow recirculation rate (WGR=15%), as illustrated in Figures 11 and 12. In the numerical data of Figure 11, a more regular distribution is observed even in the case of rounded edges, with a standard deviation value very close to the case with blunt edges. It can be observed that the standard deviation for a given geometry increases with the flue gas flow rate.
The numerical study was performed on a waste gas recirculation system to examine the influence of edges on mixing in order to limit the production of NOx during combustion in a regenerative glass furnace.
Using the mass fraction of oxygen as a reference variable to detect the dilution of the air, the results showed that the higher the flow rate of recirculated gas, the stronger is the mixing of air and gases in the regenerator; this jeopardizes the stratified charge effect giving lower NOx abatement from the combustion process.
The impact of the geometrical features (edges sharp, blunt, rounded) on air-gas flow distribution at the port neck exit has been quantified using the standard deviation of the O2 mass fraction distributions. It has been demonstrated the strong effect of the above edges detail on the flow structures inside the system. The effectiveness of the waste gas recirculation strategies can be therefore very sensitive to the above flow structures. The mixing control is more effective for chamfered edge geometries (new furnace) than for curved edge geometries (corroded furnace). The introduction of the above geometrical details into the CFD model has a dramatic effect on the flow structure prediction in these applications as a more sophisticated gas model has on different cases [13].
The flow structures inside the furnace for the reference cases (design CAD, new actual furnace and corroded furnace) are different and the following considerations can be drawn:
It can be observed that the standard deviation (flow non-uniformity) increases with the recirculated gas percentage and it is always higher in the case of eroded furnace. A strategy to keep the efficiency of the WGR system when the furnace tends to deteriorate would be the reduction of the WGR rate to keep the stratified charge effect for NOx containment.
[1] Reboussin, Y., Fourmigue, J.F., Marty, P., Citti, O. (2005). A numerical approach for the study of glass furnace regenerators. Applied Thermal Engineering, 25(14-15): 2299-2320. https://doi.org/10.1016/j.applthermaleng.2004.12.012
[2] Sardeshpande, V., Anthony, R., Gaitonde, U.N., Banerjee, R. (2011). Performance analysis for glass furnace regenerator. Applied energy, 88(12): 4451-4458. https://doi.org/10.1016/j.apenergy.2011.05.028
[3] Yakinthos, K., Missirlis, D., Sideridis, A., Vlahostergios, Z., Seite, O., Goulas, A. (2012). Modelling operation of system of recuperative heat exchangers for aero engine with combined use of porosity model and thermo-mechanical model. Engineering Applications of Computational Fluid Mechanics, 6(4): 608-621. https://doi.org/10.1080/19942060.2012.11015446
[4] Zarrinehkafsh, M.T., Sadrameli, S.M. (2004). Simulation of fixed bed regenerative heat exchangers for flue gas heat recovery. Applied thermal engineering, 24(2-3): 373-382. https://doi.org/10.1016/j.applthermaleng.2003.08.005
[5] Skalska, K., Miller, J.S., Ledakowicz, S. (2010). Trends in NOx abatement: A review. Science of the total environment, 408(19): 3976-3989. https://doi.org/10.1016/j.scitotenv.2010.06.001
[6] Scalet, B.M., Garcia Muñoz, M., Sissa, A.Q., Roudier, S., Delgado Sancho, L. (2013). Best available techniques (BAT) reference document for the manufacture of glass. Sevilla: Joint Research Centre of the European Commission (JRC).
[7] Cogliandro, S., Cravero, C., Marini, M., Spoladore, A. (2017). Simulation strategies for regenerative chambers in glass production plants with strategic exhaust gas recirculation system. IIETA Int. J. Heat Technol, 35: S449-S455. https://doi.org/10.18280/ijht.35Sp0161.
[8] Cravero, C., De Domenico, D. (2019). The Use of CFD for the Design and Development of Innovative Configurations in Regenerative Glass Production Furnaces. Energies, 12(13): 2455. https://doi.org/10.3390/en12132455
[9] Basso, D., Cravero, C., Reverberi, A.P., Fabiano, B. (2015). CFD analysis of regenerative chambers for energy efficiency improvement in glass production plants. Energies, 8(8): 8945-8961. https://doi.org/10.3390/en8088945, ISSN 1996-1073.
[10] Cravero, C.A.R.L.O., Marsano, D.A.V.I.D.E. (2017). Numerical simulation of regenerative chambers for glass production plants with a non-equilibrium heat transfer model. WSEAS Trans. Heat Mass Transf, 12: 21-29.
[11] Cravero, C., De Domenico, D., Kenfack, F.D., Leutcha, P.J. (2020). Numerical prediction of the flow structure inside components of industrial glass furnace systems. WSEAS Transactions on Fluid Mechanics, 15: 111-120, https://doi.org/10.37394/232013.2020.15.11.
[12] Guzmán, A.M., Martínez, D.I., González, R. (2014). Corrosion–erosion wear of refractory bricks in glass furnaces. Engineering Failure Analysis, 46: 188-195. https://doi.org/10.1016/j.engfailanal.2014.09.003
[13] Cravero, C., Satta, A. (2000). A CFD model for real gas flows. In Turbo Expo: Power for Land, Sea, and Air. American Society of Mechanical Engineers, 78545: V001T03A083.