Energy Performance Certificates Analysis in Piedmont Region (IT).
A New Oil Field Never Exploited Has Been Discovered
OPEN ACCESS
In recent years, the high energy consumptions and the excessive use of fossil fuels has led the European Community to adopt new policies aimed at reducing greenhouse gas emissions. In particular, the Energy Performance Certificates (EPCs) were introduced in the first European EPBD Directive in order to improve the level of energy efficiency of buildings reducing energy consumptions and relative emissions.
In this work an analysis on the database of EPCs of residential buildings was performed. The objective of this work was to evaluate the type of retrofit action and the impact retrofit interventions for the Piedmont Region and for the city of Turin. The data used for this analysis were extracted from the EPC database of the Piedmont Region with 867,131 certificates in about 10 years. Geo-referencing of the EPCs it was also possible to correlate the energy performance of the buildings with other variables such as building and climate characteristics. The results of this work show that, through retrofit interventions 33-48% energy savings can be achieved. Moreover, there is still a high potential because the 33-48% of energy savings affects less than 6% of the total certified buildings, which are about 50% of the total buildings.
energy performance certificates, residential buildings, retrofit measures, energy savings, renewable energy sources, territorial scale
In recent years, the use of fossil fuels and the growth of greenhouse gas emissions, has led the European Community to the adoption of new policies aimed for the reduction of energy consumption through the improvement of the energy efficiency of residential buildings which are responsible for about 40% of total EU energy consumption.
The most important EU directive in the energy sector (2002/91/EC), also called the EPBD "Energy Performance of Buildings Directive" aims to encourage the use of smart technologies and alternative energy sources "renewable sources". Therefore, each Member State is required to develop its own national legislation that is in line with Community objectives and at the same time capable of interpreting the needs of its territory.
Italy started talking about energy certification in 2005 with Legislative Decree August 9, 2005, n. 192 "Implementation of Directive 2002/91/EC relating to energy performance in buildings" which implements the EU directive in order to adapt Italian legislation to European legislation on energy efficiency and consumption reduction.
In particular, art. 6 "Energy performance certificate, release and posting", provides for the provision of the certificate for new buildings, provisions aimed at improving its energy performance for existing buildings, but also as an information tool for the owner or buyer in the case of a sale or of the tenant in the case of leasing a property.
The energy performance certification (EPC) is a technical document that certifies the energy performance of a building, through the energy class, from A4 (more efficient) to G (less efficient); it is a useful tool for informing about energy consumption and consequently finding solutions for optimizing energy with improvements.
This document makes it easier and immediate to know the physical and environmental characteristics of your home, having the opportunity to benefit from tax incentives in the case of buildings with low environmental impact, or improvement measures.
In Piedmont the EPC scheme was adopted in 2009 with regional decree and formerly named ACE (“Attestato di Certificazione Energetica” in Italian). Its layout was simple with a classification from A+ to G and the main index of performances based on the total primary energy needs per square meter.
After the recast of the EPBD and the update of the national law (2014) Piedmont dismissed its own scheme and adopted in 2015 the national protocol. The ACE was renamed in APE (“Attestato di Prestazione Energetica” in Italian) and the contents increased: next to the class and energy performance index a lot of others parameters will be analyzed and wrote down on the document. For every APE released, moreover, a lot of geometrical and thermo-physical values are acquired via an XML file and stored in the DB hopefully opened to big data analysis like the study conducted here.
In Piedmont Region, the energy regional Plan [1] focused on the saving potential of the civil sector. The total energy consumption of the civil sector (space heating, space cooling and domestic hot water for residential and commercial buildings) is roughly about 4,599 kTOE over the total energy consumption of the entire Region in 2014 which was 9,899 kTOE. The residential sector alone represents a 2,513 kTOE of total energy consumption and the estimated saving officially planned at the 2030 - aligned to the EU path - is in the order of 15% (350/400 kTOE). The weight of space heating and others uses of energy for the residential sector is 28%, less than the average of the EU.
This evaluation of the savings potential on the EPC databases demonstrates that it is widely greater. A huge new oil field never exploited has been discovered.
The construction sector accounts for 40% of total EU energy consumption and faces major challenges with the aim of transforming existing buildings into nearly zero energy buildings (Nzeb) by 2050.
In particular, the residential sector is considered one of the most convenient options for saving GHG emissions. To address this potential, the EU has introduced energy performance certificates (EPC), which should provide clear information on the energy performance of buildings to buyers, owners and tenants of housing. The EPC databases can be used also to quantitatively predict the annual energy consumption of the building stock, thus creating a demand-driven market for energy-saving buildings. In the literature review, three topics were identified on EPC researches (in Table 1).
Table 1. Literature review on energy performance certificates (EPC) for buildings
|
Topic |
Sources |
Place |
Methodology |
Results |
|
Analysis of EPC databases |
[2-9] |
Sweden, South Korea, UK, Spain, Switzerland |
Statistical analysis, Excel |
Correction of data, algorithms to improve the accuracy of EPCs databases |
|
GIS spatial analyses |
[10-19] |
Korea, Italy, Sweden, Greece, Argentine |
ArcMap, Excel |
Mapping buildings’ energy performance, energy retrofit and RES scenarios |
|
EPCs impact on the real estate market |
[20-23] |
Spain, Sweden, UK, Italy |
Real estate market analysis |
Economic impact of EPCs on transaction prices and rents |
Many studies on the analysis of the energy certificate databases have highlighted that in order to describe the building stock, it is necessary to carry out assessments and correct the data quality and accuracy [2, 3]. This is also caused by the fact that the certifiers find some difficulties to evaluate some parameters, such as the net floor area, the layering of the envelope, and the shape of the building [4]. Furthermore, apartments and single family buildings seem to cause more problems than other types of properties, due to difficulties in assessing their position in the building and the characteristics of the surrounding space [5].
For the definition of the energy saving scenarios, López-González et al. in 2016 used a statistical analysis of the energy performance certificates. This analysis was useful to the public administration in order to identify and develop the most effective energy policies to reduce both the consumption of primary energy and GHG emissions [6].
In 2018 Las-Heras-Casas et al. [7] studied an algorithm to correct the errors in the energy certificates, starting from the data in the EPCs such as: the date of registration and validity, building type, climate zone, year of construction, net heated area, primary energy consumption and energy class; in this work, the climatic characteristics and heating degree days (HDD) were taken into account for each Municipality.
In 2018, Streicher et al. [8] highlights the importance to characterize the residential sector with an adequate degree of detail, distinguishing between various types of buildings (archetypes) and construction elements in order to identify the potential not used for energy retrofit. The statistical analysis of the certificates allowed to estimate a level of energy performance of the archetype buildings with the respective building elements and the heating systems.
Finally, in 2019, the study conducted by J. von Platten et al. [9] developed a new method for comparing the energy performance of old and new energy certificates, in order to map the development of energy performance and allow an assessment of the impact on the energy performance deriving from policies and measures that have been implemented between the two certificates.
2.2 The use of Geographic Information System (GIS) to monitor and map the spatial distribution of EPCs
Using GIS tools, it is possible to process information relating to the geometric characteristics of buildings [10] to assess energy consumptions of buildings [11], and to develop geo-statistical analyzes on buildings’ energy performance classification systems and their energy classes [12].
The spatial energetic characterization of a territory is the basis for carrying out short, medium and long-term scenario analyzes. The results of these analyses are useful for decision makers, to understand the current state of territorial energy consumption in order to identify energy-intensive critical areas, citizens to take responsibility and compare themselves with respect to their energy consumption and researchers to set the basis for an energy plan based on the real building stock and population [13].
In 2016, Johansson et al. [14] developed an urban energy model based on the requests and the need of energy consumption visualization by energy consultants, urban planners and companies. By geo-referencing building data, it is possible to make energy models to better understand the distribution of energy consumption and the availability of energy resources [15]. This methodology consents to implement the energy performance analysis from the building scale to a territorial scale [16]. In addition, the GIS cartographic projection and maps offers a tool to model to organize, manage and evaluate the energy indicators and build the energy characteristics related to the city, neighborhood [17, 18].
In 2016, Droutsa et al. analyzed the effectiveness of EPC mapping. This work allowed to identify the older buildings that have a high potential for significant energy savings, in particular for space heating and domestic hot water. The energy saving obtained by replacing the heat generation systems with more energy efficient units and switching to other energy carriers (e.g. replacing oil boilers and/or switching to natural gas or biomass) was evaluated [19].
2.3 Influence of EPCs on the real estate market
In order to strengthen the role of energy performance certificates in the property market, the European members continuously monitor the EPC databases in order to speed up the transformation of buildings into nZEB (nearly zero energy buildings).
The system of energy certification for existing buildings, for new buildings and the related energy label, does not impact directly on the price of housing [20], since the sales prices are linked to the information of the rather than energy certification [21]. All other things being equal, there must be a relationship between the sale price and the energy performance assessment of residential properties [22]. In 2010, an estimation procedure was proposed for the city of Turin (Italy) that allowed to quantify the difference in value between properties belonging to different energy classes, also taking into account the extrinsic and intrinsic characteristics of the buildings [23].
Starting from the study of literature review and the data of EPC, it was possible to outline a basic information framework in identifying and choosing methodologies relating to energy savings in the residential sector.
The procedure followed, with the use of Access and Excel software, was useful for processing a significant amount of information within 867,131 energy performance certificates, essential for achieving the energy saving results. This analysis is interesting because it is based on energy retrofit interventions actually carried out on buildings that have constraints on retrofit interventions. These constraints can be technical but also historical or environmental. So these assessments on energy saving are those that can actually be made on this built heritage.
The main six phases of the procedure have been the following:
1- Acquisition and analysis of EPCs. Starting from the regional database, the first operation carried out was the elimination of all those certificates having a different destination of residential use (i.e. E.1. category according to the Italian D.P.R. 412/93), therefore, taking into consideration only "the buildings used as residences and similar":
The EPCs of the Piedmont Region are 867,131 but, due to different Italian regulations, they can be divided into:
As shown in Figure 1, the yearly trend is quite constant with on average just over 10.6% of EPC released each year (excluding the partially years of 2009 and 2019). It can also be observed that the trend of the EPCs issued in the Piedmont Region is very similar to that of the city of Turin.
2- Classification of the data according to the climate sub-zones. For residential buildings in Piedmont Region, EPgl is the primary energy for space heating, for the production of domestic hot water and for ventilation; energy needs for space cooling, artificial lighting and transport of people and things were not present in the EPC database. Then, the Heating Degree Days (HDD) significantly influence the energy consumptions described by the index EPgl (global primary energy performance index).
Figure 1. Percentage trend of EPCs released from November 2009 to April 2019
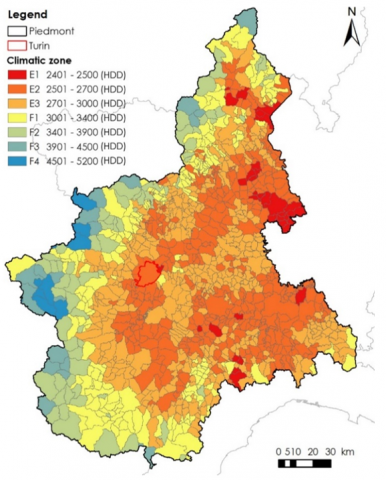
Figure 2. Climate zones and sub-zones in Piedmont Region
Because of the variety of the territory in Piedmont Region, with plain, hilly and mountain areas, the two Italian climatic zones E and F (according to the Italian D.P.R. 412/93, Annex A updated at October 31st 2009) have been further divided into the seven subzones shown in Figure 2: from plain zones E1 and E2, to the more hilly zone E3, to the mountain zones F1 and F2 and high mountains ones F3. The city of Turin, surrounded by a red line, belongs to the climatic zone E2 with 2617 HDD.
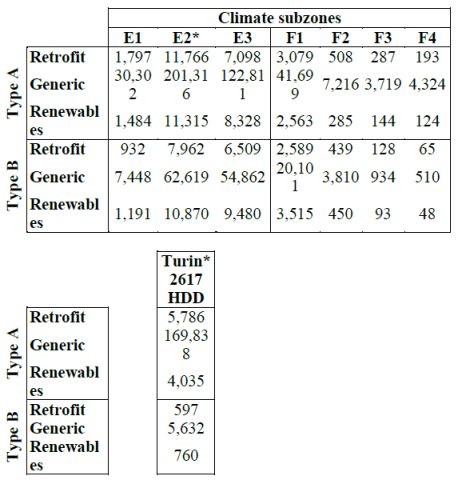
In Table 2 the number of EPCs were subdivided for the seven climate zones. In zone E2 more than the 84% of apartments with EPC belongs to the city of Turin.
Table 2. Number of EPCs divided by climate sub-zones and for the city of Turin
3- Classification on the type of buildings. To differentiate the building typology, it was decided to distinguish the apartments from the detached houses. Initially, the surface to volume ratio (S/V) was used to describe the type of building but the accuracy of this variable in the EPCs was quite low. Then the database was divided into two groups of buildings: apartments (type A) and detached houses (type B). As shown in Figure 3, most of the EPCs are related to apartments in condominiums, 78.7% in Piedmont Region and 96.8% in Turin. In Table 2 is possible to observe the distribution of EPCs for apartments (Type A) and detached houses (Type B) in the different climate zones.
Figure 3. Type of building
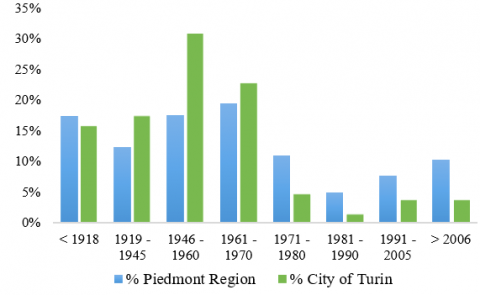
4- Classification on the period of construction of the buildings. Eight classes were identified for the construction period (<1918, 1919 - 1945, 1946 - 1960, 1961 - 1970, 1971 - 1980, 1981 - 1990, 1991 - 2005, > 2006). The main characteristics of the buildings that depend on the period of construction are: the level of thermal insulation of the opaque and transparent envelope, the type of envelope and the geometric characteristics of the envelope and the efficiency of the technological systems. Figure 4 shows that 66% or 87% of residential buildings, respectively in Piedmont Region and in Turin, were built before the Italian Law 373/76, the first law on energy savings for buildings. Then, buildings built before 1976 are generally buildings that consume a lot of energy and therefore can be retrofitted. These data are in line with what is indicated considering all residential buildings in the Piedmont Region and in Turin [24].
Figure 4. The percentage of EPCs by building period of construction
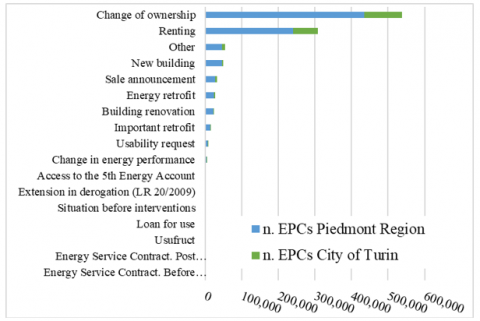
5- Classification on the motivation for the release of the EPCs. The reasons for the release of the EPCs (Figure 5) was very important for this analysis because it made it possible to make assessments on the energy performance of existing buildings (called “generic”) and those of retrofitted buildings (called “retrofit”) or after the installation of renewable energy sources technologies (called “res”). Then, the motivation for the release of the EPCs was grouped in: “generic” (for change of ownership 50-53%, renting 28-35%, new building 2-5%, …), “retrofit” (energy retrofit 2-3%, building renovation 1-3%, important energy retrofit 1-2%) and “res” (access to the 5th energy account 0.1% and installation of RES technologies). The EPCs with renewable energy technologies were identified also checking the type of technological systems and from the energy production data from renewable energy sources.
Figure 5. Motivations for the EPCs release
6- Analysis of consumption. For each group of EPCs, the annual energy performance EPgl (EPgl,generic, EPgl,retrofit, EPgl,res), the reachable energy performance EPgl,reach and the annual energy savings (kWh/m2/year) were evaluated taking into account the amount of net heated area of the buildings.
Figure 6 describes the procedure of this analysis. The energy performance certificates were subdivided in homogeneous groups considering the different: climate conditions, typology of building (i.e. apartment or detached house), periods of construction and motivations of the EPCs’ release.
Figure 6. Flow chart of the energy savings assessment
After the creation of homogeneous groups of EPCs, the energy performance was evaluated from the EPgl indexes considering the energy consumption for space heating and domestic hot water production. Subsequently, the current annual energy saving trends was evaluated for each climate zone and each period of construction:
Esavings,retrofit = EPgl,generic - EPgl,retrofit
Esavings,res = EPgl,generic - EPgl,res . (1)
Finally, for the evaluation of the individual retrofit intervention all the EPCs were grouped according to the type of intervention “int” and for the energy saving calculation the EPgl indicator reachable was used:
Esavings,int = EPgl,int - EPgl,reach,int . (2)
The EPgl reachable is a very interesting indicator because it was calculated by the certifiers indicating the feasible interventions from a technical, historical and environmental point of view but which were also economically convenient (on ACEs, only the interventions with a payback time lower than 10 years were indicated for the calculation of EPgl,reach).
This procedure is based on median values of energy performance intensity (kWh/m2/year) for each type of building and homogeneous group of EPCs, in order to better discard the anomalous data.
The application of the above procedure allowed the definition of energy saving amounts for the city of Turin and for the Piedmont Region.
The data refers to database of the EPCs registered from November 2009 until April 2019 for:
- the city of Turin with 119,634 ACE and 66,793APE, for a total database of 186,427 energy performance certificates;
- the Piedmont Region with 553,241 ACE and 288,099 APE for a total of 841,340 EPCs.
The correction of the databases was made by excluding the EPCs with anomalous data on the main energy-related variables of the apartments and detached houses, such as: the net heated surface, the gross heated volume and the dispersing surfaces. As an example, for the net heated surface, the Italian legislation defines the minimum dimension of housing with the Ministerial Decree 5/7/1975; for building accessibility, the minimum net floor area is 28 m2. The percentage quota of EPCs removed due to anomalous data amounts to 3% (25,791 for Piedmont Region and 9,069 for the city of Turin); for this analysis on anomalous data, the use of statistical frequency distribution curves was precious. As an example, through the use of the statistical frequency distribution curve, the amount of the net heated areas of Turin and of the whole Piedmont Region was compared. Figure 7 shows that in the Piedmont Region and in Turin about 80% of the residential apartments have a net heated surface less than 96 and 90 m2 respectively; about 50% of the apartments have a net heated area of 69 and 63 m2 respectively.
Figure 7. Net heated area of residential apartments
Figure 8 shows the cumulative sum of the net heated area of the apartments retrofitted for each year (with the whole year hypothesis for 2019), and the cumulative savings after the retrofit interventions. It is possible to observe how the energy savings data have the same trend as the surface area of the retrofitted apartments. Moreover, up to 2015 there has been a quite constant trend of retrofit interventions, after which, in the years 2016-2017 there is a stabilization; this different trend may be due to the change in legislation that leads to the replacement of ACE, according a regional law, with APE according to the current national Italian law on buildings energy certification.
Table 3 reports the data about the homogeneous groups of apartments with different periods of construction and the median values of energy performance index of “generic” EPC and “retrofit” EPC; the difference between these two indicators allows to calculate the energy savings by period of construction. It is possible to observe that the highest energy savings can be obtained from the older buildings, built before 1960. The accuracy of the energy savings also depends on the number of certifications with which it was calculated (reported in the second column of Table 3); the higher the EPCs, the more accurate the result.
The same type of assessment was processed with the installation of the main renewable energy technologies: PV (photovoltaic modules), STc (solar thermal collectors), HP (heat pump) and biomass boiler (in Figure 9). Due to the small number of EPCs, in this case it was not possible to distinguish the buildings by period of construction and therefore only the prevailing period of construction was considered for the energy savings analysis. In Table 4 it can be noted that the greater energy savings are obtained with two combined renewable technologies and in particular with the heat pump (HP) systems.
In Figures 10 and 11 and in Tables 5 and 6, the results about energy saving analysis of retrofitted and of new installation RES technologies in detached houses are reported. In Turin the number of detached houses is much lower than the apartments in condominiums but the cumulative energy savings and the retrofitted area of detached residential buildings is still an important contribution. In Table 5, it can be observed the high energy savings with retrofit intervention on old detached houses (built before 1960). Also, in this case, the quality of the data also depends on the number of certifications with which it was calculated (see the second column of Table 5).
Table 3. Characteristics of residential apartments by period of construction in Turin
|
Period of construction |
Number of EPCs retrofit |
retrofit (m2) |
EPgl,retrofit (kWh/m2/y) median |
EPgl,generic (kWh/m2/y) median |
Energy savings (kWh/m2/y) |
Energy savings (%) |
|
< 1918 |
1,286 |
333,269 |
136 |
192 |
57 |
30% |
|
1919-45 |
984 |
259,914 |
156 |
208 |
52 |
25% |
|
1946-60 |
1,727 |
791,504 |
153 |
203 |
49 |
24% |
|
1961-70 |
1,305 |
472,851 |
166 |
197 |
32 |
16% |
|
1971-80 |
249 |
111,144 |
161 |
188 |
27 |
14% |
|
1981-90 |
64 |
5,863 |
133 |
175 |
42 |
24% |
|
1991-05 |
97 |
9,431 |
130 |
155 |
25 |
16% |
|
> 2006 |
74 |
10,137 |
81 |
85 |
4 |
5% |
Table 4. Energy performance of residential apartments by renewable energy technology in Turin
|
RES technology (main period of construction) |
Number of EPCs retrofit |
m2/year |
EPgl,res (kWh/m2/y) median |
EPgl,generic (kWh/m2/y) median |
Energy savings (kWh/m2/y) |
Energy savings (%) |
|
Biomass boiler (1919-45) |
113 |
8,512 |
166 |
208 |
42 |
20% |
|
HP (1919-45) |
1,863 |
201,102 |
108 |
208 |
100 |
48% |
|
PV (> 2006) |
520 |
82,786 |
68 |
85 |
17 |
20% |
|
STc (> 2006) |
1,391 |
303,714 |
61 |
85 |
24 |
28% |
|
PV - HP (>2006) |
63 |
11,121 |
27 |
85 |
58 |
68% |
|
STc - PV (>2006) |
80 |
12,839 |
56 |
85 |
29 |
34% |
Table 5. Characteristics of detached houses by period of construction in Turin.
|
Period of construction |
Number of EPCs retrofit |
retrofit (m2) |
EPgl,retrofit (kWh/m2/y) median |
EPgl,generic (kWh/m2/y) median |
Energy savings (kWh/m2/y) |
Energy savings (%) |
|
< 1918 |
94 |
28,358 |
176 |
238 |
62 |
26% |
|
1919-45 |
120 |
35,652 |
145 |
267 |
122 |
46% |
|
1946-60 |
187 |
69,758 |
148 |
250 |
103 |
41% |
|
1961-70 |
248 |
406,388 |
211 |
257 |
46 |
18% |
|
1971-80 |
40 |
45,340 |
167 |
240 |
72 |
30% |
|
1981-90 |
29 |
7,122 |
148 |
188 |
40 |
21% |
|
1991-05 |
6 |
948 |
150 |
159 |
9 |
6% |
|
> 2006 |
36 |
3,458 |
90 |
97 |
7 |
7% |
In Figure 11 it can be observed that in isolated houses renewable technologies are much more used than in apartments; and in Table 6 it can also be observed that the energy saving obtained by using renewable energy sources is greater than for the apartments. For the evaluation of these results it is necessary to take into account not only the number of EPCs but also the prevalent period of construction of the buildings.
For the Piedmont Region, the energy savings were evaluated with the “retrofit” EPCs for homogeneous groups of apartments and detached houses are reported in Table 7 (using Eq. 1). In this case, in addition to the construction periods, the results were also grouped by climatic sub-zones.
Finally, in Table 8 the potential energy savings were evaluated using the generic Eq. 2 using the “generic” EPCs. It is possible to note how energy savings can still triple with respect to the energy retrofit interventions implemented in these 10 years.
Figure 8. Cumulative energy savings for apartments
Figure 9. Cumulative energy savings with renewable energy technologies for apartments in Turin
Figure 10. Cumulative energy savings for detached houses in Turin
Figure 11. Cumulative energy savings with renewable energy technologies for detached houses in Turin
Table 6. Characteristics of detached houses by type of renewable energy technology in Turin
|
RES technology (main period of construction) |
Number of EPCs retrofit |
m2/year |
EPgl,res (kWh/m2/y) median |
EPgl,generic (kWh/m2/y) median |
Energy savings (kWh/m2/y) |
Energy savings (%) |
|
Biomass boiler (< 1918) |
38 |
5,968 |
144 |
238 |
94 |
39% |
|
HP (1946-60) |
72 |
10,801 |
104 |
250 |
146 |
58% |
|
PV (1946-60) |
41 |
5,449 |
115 |
250 |
135 |
54% |
|
STs (1919-45) |
209 |
34,083 |
82 |
267 |
185 |
69% |
|
STc - biomass (1946-60) |
3 |
482 |
67 |
250 |
183 |
73% |
|
STc - HP (>2006) |
3 |
1,092 |
36 |
97 |
61 |
63% |
|
STc - PV (1981-90) |
8 |
5,548 |
86 |
188 |
102 |
54% |
4.1 Type of retrofit interventions
The building heritage that characterizes the city of Turin is mainly composed of buildings built before the 1976, before the first Italian Law 373/1976 on energy savings in buildings. In the absence of specific legislation, the buildings were built without energy efficiency standards: no thermal insulation, inefficient systems and non-compact forms.
The energy saving assessment also concerned the types of retrofit interventions carried out on the envelope and/or on the technological systems. Form the analysis on the EPCs, the following main retrofit interventions have been identified:
1) thermal insulation of slabs;
2) thermal insulation of roofs;
3) thermal insulation of vertical walls;
4) the replacement of the windows;
5) the installation of the new condensing boiler or new heat exchanger for buildings connected to the district heating network;
6) the installation of thermostatic valves to improve the regulation of the heat in the different spaces of a building;
7) the installation of renewable energy sources technologies (heat pumps, photovoltaic modules, solar thermal collectors, …).
In Figures 12 and 13 the different distribution of the typology of retrofit is represented for the different districts of the city of Turin. It is possible to observe that the main interventions are the thermal insulation of the walls and the windows substitutions. For the detached houses also the thermal insulation of the roof and the installation of solar collectors are quite diffuse.
In Tables 9 and 10 are reported the main results of the energy savings analysis for apartments and detached houses by type of retrofit intervention using Eq. 2. In the last column of tables 9 and 10, the energy savings obtained in the medium term were reported; this analysis considers the EPgl,reach achievable after retrofit measures feasible from a technical, historical, environmental and economic point of view.
Figure 12. Typologies of retrofit interventions for the apartments in the different districts of Turin
Figure 13. Typologies of retrofit interventions for the detached houses in the different districts of Turin
Table 7. Characteristics for type of building by period of construction and energy savings (in Piedmont Region)
|
Apartments |
Detached houses |
|||||
|
Period of construction |
m2 (retrofit) |
Energy savings (kWh/y) |
Energy savings (%) |
m2 (retrofit) |
Energy savings (kWh/y) |
Energy savings (%) |
|
< 1918 |
608,246 |
86,277,787 |
48% |
626,495 |
131,650,704 |
56% |
|
1919 - 1945 |
338,403 |
45,264,802 |
46% |
400,168 |
78,716,842 |
56% |
|
1946 - 1960 |
940,849 |
84,247,618 |
36% |
535,775 |
91,165,282 |
54% |
|
1961 - 1970 |
1,762,890 |
115,650,824 |
29% |
590,127 |
83,661,612 |
48% |
|
1971 - 1980 |
1,016,606 |
63,210,995 |
28% |
1,134,923 |
128,209,376 |
43% |
|
1981 - 1990 |
263,567 |
14,199,342 |
27% |
210,539 |
15,212,089 |
31% |
|
1991 - 2005 |
119,154 |
2,960,092 |
16% |
223,577 |
8,527,523 |
22% |
|
> 2006 |
143,479 |
7,744 |
0% |
207,279 |
936,890 |
5% |
|
Apartments |
Detached houses |
|||||
|
Climate zone |
m2 (retrofit) |
Energy savings (kWh/y) |
Energy savings (%) |
m2 (retrofit) |
Energy savings (kWh/y) |
Energy savings (%) |
|
E1 |
381,228 |
29,817,619 |
34% |
157,343 |
18,963,473 |
45% |
|
E2 |
2,604,326 |
191,746,767 |
33% |
2,206,466 |
276,097,377 |
46% |
|
E3 |
1,266,777 |
103,646,752 |
34% |
1,065,981 |
146,817,391 |
48% |
|
F1 |
777,966 |
68,539,592 |
33% |
397,162 |
72,520,789 |
53% |
|
F2 |
72,800 |
9,432,323 |
39% |
64,784 |
15,492,963 |
50% |
|
F3&F4 |
90,097 |
8,636,151 |
31% |
37,147 |
8,188,325 |
50% |
|
tot |
5,193,194 |
411,819,204 |
|
3,928,883 |
538,080,318 |
|
Table 8. Characteristics for type of building by period of construction and energy savings potential (in Piedmont Region)
|
Apartments |
Detached houses |
|||||
|
Period of construction |
m2 (generic) |
Reachable energy savings (kWh/y) |
Reach. energy savings (%) |
m2 (generic) |
Reachable energy savings (kWh/y) |
Reach. energy savings (%) |
|
< 1918 |
5,408,295 |
343,978,774 |
38% |
2,633,386 |
226,812,228 |
28% |
|
1919 - 1945 |
3,152,268 |
200,126,141 |
38% |
1,428,825 |
125,407,887 |
25% |
|
1946 - 1960 |
5,557,259 |
255,450,589 |
30% |
6,497,051 |
507,156,545 |
36% |
|
1961 - 1970 |
8,397,558 |
319,981,825 |
26% |
1,436,484 |
101,399,800 |
21% |
|
1971 - 1980 |
6,853,501 |
243,172,533 |
24% |
1,289,453 |
83,126,959 |
22% |
|
1981 - 1990 |
2,350,529 |
79,791,646 |
25% |
766,319 |
36,117,680 |
18% |
|
1991 - 2005 |
4,400,132 |
60,065,753 |
12% |
1,208,734 |
29,230,648 |
10% |
|
> 2006 |
3,104,527 |
0 |
0% |
4,339,596 |
36,102,427 |
8% |
|
Apartments |
Detached houses |
|||||
|
Climate zone |
m2 (generic) |
Reachable energy savings (kWh/y) |
Reach. Energy savings (%) |
m2 (generic) |
Reachable energy savings (kWh/y) |
Reach. energy savings (%) |
|
E1 |
2,726,292 |
103,667,303 |
27% |
1,015,378 |
60,338,267 |
38% |
|
E2 |
20,555,502 |
727,689,312 |
26% |
8,761,952 |
503,579,011 |
36% |
|
E3 |
11,413,275 |
459,522,441 |
28% |
15,547,960 |
870,061,201 |
36% |
|
F1 |
3,337,014 |
152,338,031 |
29% |
2,460,902 |
172,907,087 |
39% |
|
F2 |
515,641 |
30,815,161 |
31% |
378,518 |
28,952,650 |
34% |
|
F3&F4 |
676,346 |
28,535,013 |
24% |
196,279 |
13,051,111 |
32% |
|
tot |
39,224,070 |
1,502,567,261 |
|
28,360,989 |
1,648,889,327 |
|
|
Period of construction |
n. EPCs retrofit |
EPgl median (kWh/m2/y) |
Thermal insulation vertical walls |
Thermal insulation slab/floor |
Thermal insulation roof |
Windows replacement |
|||||
|
< 1918 |
647 |
135 |
38% |
6% |
5% |
30% |
|||||
|
1919 - 1945 |
611 |
358 |
28% |
6% |
9% |
45% |
|||||
|
1946 - 1960 |
1,023 |
207 |
61% |
11% |
13% |
64% |
|||||
|
1961 - 1970 |
775 |
173 |
66% |
7% |
9% |
40% |
|||||
|
1971 - 1980 |
144 |
177 |
8% |
1% |
2% |
14% |
|||||
|
1981 - 1990 |
15 |
134 |
1% |
0% |
0% |
1% |
|||||
|
1991 - 2005 |
67 |
131 |
2% |
1% |
0% |
3% |
|||||
|
> 2006 |
20 |
124 |
1% |
0% |
0% |
1% |
|||||
|
Heat pump |
Solar photovoltaic |
Solar collectors |
Boiler replacement |
EPgl,reach median (kWh/m2/y) |
Medium term energy savings |
||||||
|
0% |
1% |
8% |
8% |
96 |
29% |
||||||
|
1% |
2% |
15% |
6% |
130 |
64% |
||||||
|
1% |
3% |
11% |
17% |
128 |
38% |
||||||
|
1% |
2% |
3% |
3% |
126 |
27% |
||||||
|
0% |
0% |
1% |
0% |
125 |
29% |
||||||
|
0% |
0% |
0% |
0% |
108 |
19% |
||||||
|
0% |
0% |
1% |
5% |
110 |
16% |
||||||
|
0% |
0% |
0% |
0% |
69 |
44% |
||||||
|
Period of construction |
n.EPCs retrofit |
EPgl median (kWh/m2/y) |
Thermal insulation vertical walls |
Thermal insulation slab/floor |
Thermal insulation roof |
Windows replacement |
|||
|
< 1918 |
53 |
184 |
50% |
17% |
2% |
30% |
|||
|
1919 - 1945 |
69 |
173 |
44% |
8% |
21% |
38% |
|||
|
1946 - 1960 |
127 |
186 |
65% |
6% |
11% |
22% |
|||
|
1961 - 1970 |
70 |
198 |
32% |
6% |
32% |
40% |
|||
|
1971 - 1980 |
15 |
172 |
54% |
0% |
27% |
18% |
|||
|
1981 - 1990 |
6 |
129 |
15% |
0% |
0% |
15% |
|||
|
1991 - 2005 |
6 |
163 |
36% |
0% |
0% |
18% |
|||
|
> 2006 |
11 |
96 |
12% |
0% |
0% |
0% |
|||
|
Heat pump |
Solar photovoltaic |
Solar collectors |
Boiler replacement |
EPgl,reach median (kWh/m2/y) |
Medium term energy savings |
||||
|
2% |
2% |
15% |
10% |
131 |
29% |
||||
|
2% |
2% |
17% |
6% |
144 |
17% |
||||
|
4% |
3% |
18% |
9% |
142 |
24% |
||||
|
2% |
10% |
10% |
8% |
141 |
29% |
||||
|
0% |
9% |
18% |
0% |
134 |
22% |
||||
|
0% |
0% |
46% |
15% |
93 |
28% |
||||
|
0% |
18% |
0% |
18% |
107 |
34% |
||||
|
0% |
18% |
37% |
0% |
67 |
30% |
||||
Depending on the type of building (apartment or detached house) and on the period of construction, also the medium term energy saving was estimated utilizing the reachable EPgl. Neglecting the newer buildings with few EPCs, it can be observed that 30% savings can be obtained on all buildings (apartments and isolated houses) and for all periods of construction. This result is obtained taking into account also the economic feasibility of the interventions, therefore considering only the economically convenient interventions.
In Italy, the energy retrofit of buildings is mainly incentivized through tax deductions. So in order to access the incentives, people need to have economic resources to invest.
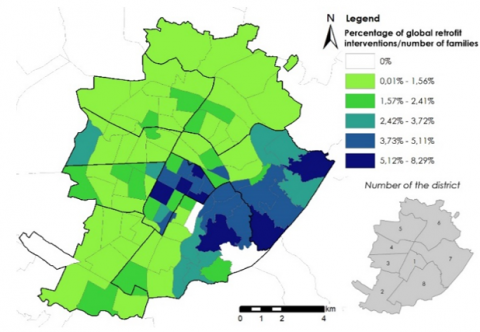
Then, the spatial distribution of the percentage of retrofit interventions in the different statistical areas of Turin (in Figure 14), was compared with the average per capita income (in Figure 15) and with the average net heated areas of the apartment and detached houses (in Figure 16). A clear correspondence can be observed between high percentage values of retrofit interventions and high values of both income and net heated area. In particular, high values of retrofit percentage, per capita income and net heated areas can be observed in the center of the city (district 1) and in the hilly area South-East over the river Po (districts 7 and 8).
Figure 14. Percentage of retrofit interventions on residential buildings (n. retrofit interventions/n. families)
Figure 15. Average per capita income in 2009 (€/inhabitant/year) [25]
Figure 16. Net heated area of residential apartments and detached houses (m2/apartment)
The assessment used in this work is mainly based on statistical analyses to correct the EPCs database of residential buildings in the Piedmont Region; and on the geo-referencing of the EPCs with a GIS tool in order to support both the spatial characterization of buildings and their consumptions of energy. This methodology therefore made it possible to compare the consumption of buildings with their features and with some socio-economic characteristics of the population, as well as the creation of urban energy maps.
Then, through the localization of the data, it was possible to identify the areas where more interventions were carried out than others. It turned out that the most common interventions implemented for the apartments are replacement of windows and the thermal insulation vertical walls. For the detached houses, in addition to the aforementioned interventions, it is necessary to add: roofs thermal insulation and installation of solar collectors and photovoltaic modules.
The results show also that the average energy savings after retrofit interventions is more convenient for the detached houses compared to the apartments. For the city of Turin, through a socio-economic analysis, it was possible to define factors that influence the retrofit rate: the per capita income or the net heated area of residential dwellings.
For the analysis on EPC database in the whole Piedmont Region, also the Heating Day Degrees were considered to verify whether there is a correlation with the amount of retrofit measures. From the data processing, it emerged that the HDD cannot be considered as a significant variable enough to affect the energy savings of retrofit interventions; on the contrary, the buildings’ period of construction and the type of dwelling have a significant impact on energy savings, in favor of older buildings and detached houses.
The civil sector is a major energy consumer and is also a major contributor to GHG emissions, also for this reason the buildings have been certified energetically. In this work an analysis was made on the results of the energy performance certificates database using 867,131 certificates of residential buildings from 2009 to 2019 in Piedmont Region.
The procedure, used for evaluating the data of the EPCs, was very useful in order to outline the trend of energy savings and implement retrofit interventions to improve energy savings and buildings’ efficiency level. Besides, this methodology based on statistical analyses and the use of a GIS tool to geo-reference buildings’ data, can be used to evaluate the actual energy saving objective that can also be reached in function of the technical, historical, environmental and economic constraints that occur on a building heritage at urban or territorial scale.
The main results of this work show that the type of retrofit interventions and the energy savings varies with the period of construction of buildings and with the type of buildings. To calculate di energy savings, the energy performance index EPgl was used for “generic” and” retrofit” motivation of the EPCs. To evaluate the energy savings potential, the reachable EPgl can be used.
If in the Piedmont Region there are 215 Mm2 of residential buildings [1, 26], in 10 years 47% of these buildings have been certified energetically; moreover, considering that all residential buildings will consume 27,796 GWh in 2020 [1], the certified share corresponds to 36%. Considering the EPC database, not even 6% corresponds to retrofitted buildings and only 6.5% to buildings with renewable energy sources technologies. These data seem few but their potential is very high and therefore should be further encouraged.
The authors gratefully acknowledge the cooperation of CSI-Piemonte in accessing the database on buildings’ Energy Performance Certificate of Piedmont Region.
[1] Regional Environmental Energy Plan. https://www.planning.nsw.gov.au/~/media/Files/DPE/Plans-and-policies/regional-environmental-plan-georges-river-catchment-1999.ashx, accessed on Feb. 2, 2020 (in Italian).
[2] Mangold, M., Österbring, M., Wallbaum, H. (2015). Handling data uncertainties when using Swedish energy performance certificate data to describe energy usage in the building stock. Energy and Buildings, 102: 328-336. https://doi.org/10.1016/j.enbuild.2015.05.045
[3] Hjortling, C., Björk, F., Berg, M., af Klintberg, T. (2017). Energy mapping of existing building stock in Sweden - Analysis of data from Energy Performance Certificates. Energy and Buildings, 153: 341-355. https://doi.org/10.1016/j.enbuild.2017.06.073.
[4] Jeong, J., Hong, T., Ji, C., Kim, J., Lee, M., Jeong, K., Koo, C. (2017). Development of a prediction model for the cost saving potentials in implementing the building energy efficiency rating certification. Appl. Energy, 189: 257-270. https://doi.org/10.1016/j.apenergy.2016.12.024
[5] Hardy, A., Glew, D. (2019). An analysis of errors in the energy performance certificate database. Energy Policy, 129: 1168-1178. https://doi.org/10.1016/j.enpol.2019.03.022.
[6] López González, L.M., López Ochoa, L.M., Las Heras Casas J., García-Lozano, C. (2016). Energy performance certificates as tools for energy planning in the residential sector. The case of La Rioja. Journal of Cleaner Production, 137: 1280-1292. https://doi.org/10.1016/j.jclepro.2016.08.007
[7] Las Heras Casas, J., López González, L.M., López Ochoa, L.M., Paredes-Sánchez, J.P. (2018). A tool for verifying energy performance certificates and improving the knowledge of the residential sector: A case study of the Autonomous Community of Aragón (Spain). Sustainable Cities and Society, 41: 62-72. https://doi.org/10.1016/j.scs.2018.05.016
[8] Streicher, K.N., Padey, P., Parra, D., Bürer, M.C., Patel, M.K. (2018). Assessment of the current thermal performance level of the Swiss residential building stock: Statistical analysis of energy performance certificates. Energy and Building, 178: 360-378. https://doi.org/10.1016/j.enbuild.2018.08.032
[9] von Platten, J., Holmberg, C., Mangold, M., Johansson, T., Mjörnell, K. (2019). The renewing of energy performance certificates - reaching comparability
between decade-apart energy records. Applied Energy, 255: 113902. https://doi.org/10.1016/j.apenergy.2019.113902
[10] Mutani, G., Todeschi, V., Grisolia, G., Lucia, U. (2019). Introduction to constructal law analysis for a simplified hourly energy balance model of residential buildings at district scale. TI-Italian Journal of Engineering Science, 63(1): 13-20. https://doi.org/10.18280/ti-ijes.630102
[11] Delmastro, C., Mutani, G., Corgnati, S.P. (2016). A supporting method for selecting cost-optimal energy retrofit policies for residential buildings at the urban scale. Energy Policy, 99: 42-56. https://doi.org/10.1016/j.enpol.2016.09.051
[12] Koo, C., Hong, T. (2015). Development of a dynamic operational rating system in energy performance certificates for existing buildings: Geostatistical approach and data-mining technique. Appl. Energy, 154: 254-270. https://doi.org/10.1016/j.apenergy.2015.05.003
[13] Mutani, G., Delmastro, C., Gargiulo, M., Corgnati, S.P. (2016). Characterization of building thermal energy consumption at the urban scale. Energy Procedia, 101: 384-391. https://doi.org/10.1016/j.egypro.2016.11.049
[14] Johansson, T., Vesterlund, M., Olofsson, T., Dahl, J. (2016). Energy performance certificates and 3-dimensional city models as a means to reach national targets - A case study of the city of Kiruna. Energy Conversion and Management, 116: 42-57. https://doi.org/10.1016/j.enconman.2016.02.057
[15] Mutani, G., Fontanive, M., Arboit, M.E. (2018). Energy-use modelling for residential buildings in the metropolitan area of Gran Mendoza (AR). TI-Italian Journal of Engineering Science, 61+1(2): 74-82. https://doi.org/10.18280/ti-ijes.620204
[16] Mutani, G., Todeschi, V. (2019). An urban energy atlas and engineering model for resilient cities. TI-Italian Journal of Engineering Science, 37(4): 936-947. https://doi.org/10.18280/ijht.370402
[17] Fabbri, K., Zuppiroli, M., Keoma, A. (2012). Heritage buildings and energy performance: Mapping with GIS tools. Energy and Buildings, 48: 137-145. https://doi.org/10.1016/j.enbuild.2012.01.018
[18] Barrile, V., Fotia, A., Bilotta, G. (2018). Geodatabase for the assessment of energetic potential of territory. Ingénierie des Systèmes d’Information, 23(6): 7-17. https://doi.org/10.3166/ISI.23.6.7-17
[19] Droutsa, K.G., Kontoyiannidis, S., Dascalaki, E.G., Balaras, C.A. (2016). Mapping the energy performance of hellenic residential buildings from EPC (energy performance certificate) data. Energy, 98: 284-295. https://doi.org/10.1016/j.energy.2015.12.137
[20] de Ayala, A., Galarraga, I., Spadaro, J.V. (2016). The price of energy efficiency in the Spanish housing market. Energy Policy, 94: 16-24. https://doi.org/10.1016/j.enpol.2016.03.032
[21] Hårsman, B., Daghbashyan, Z., Chaudhary, P. (2016). On the quality and impact of residential energy performance certificates. Energy and Buildings, 133: 711-723. https://doi.org/10.1016/j.enbuild.2016.10.033
[22] Fuerst, F., McAllister, P. (2015). Does energy efficiency matter to home-buyers? An investigation of EPC ratings and transaction prices in England. Energy Economics, 48: 145-156. https://doi.org/10.1016/j.eneco.20
[23] Mutani, G., Zanforlin, A. (2010). Prestazioni energetiche degli edifici e valutazioni economiche. La Termotecnica, 61-64. ISSN: 0040-3725 (in Italian).
[24] Mutani, G., Todeschi, V. (2017). Space heating models at urban scale for buildings in the city of Turin (Italy). CISBAT, Elsevier, 841-846. https://doi.org/10.1016/j.egypro.2017.07.445
[25] Mutani, G., Todeschi, V. (2018). Energy resilience, vulnerability and risk in urban spaces. JSDEWES, 6(4): 694-709. https://doi.org/10.13044/j.sdewes.d6.0203
[26] ISTAT Population and Households Census Database. https://www.istat.it/it/archivio/104317, accessed on Feb. 20, 2020.