OPEN ACCESS
The production of greenhouse plants is one of the most intensive components in agricultural production. One of the biggest issues is winter production, due to the important energy demands for both services. The heating service is often used for the control and management of relative humidity in addition to maintaining a pre-established temperature value. Excessive values of relative humidity in indoor environments can lead to condensation phenomena with a reduction in the quality of cultivation and significant losses in terms of yield. Dehumidification is generally obtained, in the current state of the art, by exchanging volumes of internal humid air with drier external air. The reduction of relative humidity is therefore associated with significant sensible heat losses. This heat must then be reintegrated, determining a considerable additional load for the system generator. In this study the energy savings achievable by means of the proper design and operation of a heat recovery unit are evaluated. A transient simulation was performed by a numerical code implementing the energy and mass balance of the indoor space. The calculation of the heat recovered allowed for determination of the annual thermal energy requirement reduction for the maintenance of proper temperature and relative humidity levels in the greenhouse.
energy saving, closed greenhouse, heat recovery
In the last few decades, increasing attention has been paid to environmental concerns, with the aim of mitigating the pressure of human activities on the environment. A consistent number of directives has been promulgated in the field of building energy efficiency and research has investigated several solutions [1] with the purpose of reducing greenhouse gas emission and limiting energy consumptions from fossil fuels [2]. In the agricultural field, the production of greenhouse plants is one of the most intensive components; it is intensive in terms of yield and annual production, but also in terms of energy consumption, investment costs and operating costs [3]. The annual production of flowers and plants in greenhouses therefore requires services such as heating, lighting, dehumidification and often even cooling. Attention has to be paid to properly exploit the natural illuminance [4] avoiding excessive use of artificial lighting. Another issue is related to excessive values of relative humidity in indoor environments, that can lead to condensation phenomena when the dew point on the vegetation surface is reached. These conditions lead to a reduction in the quality of cultivation and to significant losses in terms of yield. Dehumidification is generally obtained, in the current state of the art, by exchanging volumes of internal humid air with drier external air, that is to say with a lower specific humidity. This process is very energy-demanding with important heat loss towards the external environment. The mixing of the two masses of air inside the conditioned volume determines the reduction of the humidity level but a consequent significant loss of sensible heat linked to the entrance of a lower temperature air flow. This heat must then be reintegrated, determining a considerable additional load on the system's generator. In this context, it is clear how the optimization of energy processes in companies with high energy requirements, with the aim above all of reducing the environmental impact of the various production activities, presents itself as an important challenge [5-6]. The majority of current greenhouses utilize conventional materials on the facade, and traditional technologies for heating, cooling, ventilation, air-conditioning, lighting, energy generation and storing. This situation causes the constructional and operational costs of green houses to be considerably high. Recent works clearly indicate that the heating demand represents 70 % to 80 % of a conventional greenhouse [7]. The remarkable role of heating demand in total energy consumption can be explained by the poor constructional features and insufficient thermal resistance of facade materials utilized in current greenhouse systems [7]. The improvement in energy saving is believed to be a challenging task, requiring the design of energy friendly greenhouse systems. Currently, solutions to increase energy efficiency involve the application of thermal screens, improved construction, the application of cogeneration and energy oriented climate control methods [8]. The study in [9] focused on closed greenhouse concept highlighting that temperature and humidity control are the two main challenges and that, although many studies have been done with regards to heating and cooling systems in the greenhouse, further work is needed on the efficient heating and cooling system adapted to the closed greenhouse concept. In [10] different energy management strategies for a greenhouse, with special emphasis on Nordic climates, were assessed. Given the rigidity of the climate, the results showed that the use of a double thermal screen and double glazing with an energy demand reduction of 60 % are the most effective opportunity for energy conservation. The highest improvement of 80% was, however, found using the closed greenhouse concept, with a potential payback of 5–6 years under favourable conditions. The total solar radiation availability and energy consumption of the six most commonly used shapes of greenhouses were analysed in [11]. The effect of a north wall on solar radiation availability and energy demand in these greenhouses was also investigated. The results obtained led the authors to conclude that an east-west oriented single span greenhouse with north brick wall was the optimum greenhouse for minimum use of additional energy and that the use of brick wall on the northern side of the east-west oriented, single-span greenhouse can reduce additional energy requirement by an average of 31.7%. In order to reduce the heating costs in a greenhouse located in Tunisia, in [12] the efficiency of a greenhouse solar heating system in the winter period (December–April) was analysed. A numerical study was conducted concluding that for a 1000 m3 greenhouse, the heating cost can be reduced up to 51.08 % in the month of April. The closed greenhouse concept was studied in [13] based on the simulation using the TRNSYS environment. A theoretical model was derived to evaluate the performance of different design scenarios and a parameter was defined to compare the performance of the closed greenhouse in different configurations, the Surplus Energy Ratio, calculated for a semi-closed greenhouse and a partly-closed greenhouse and these values have been compared with an ideal fully-closed greenhouse and a conventional case study greenhouse. The energy input and output for different greenhouse constructions in winter lettuce production was analysed in [14]. The results showed that the highest share of energy was for heating, being up to 50 %. The specific energy consumption showed different values for different greenhouse constructions, obtaining the lowest values for the multi-span greenhouse and the highest for the tunnel configuration. Several cost-effective and energy-efficient solutions for utilization in greenhouses were analysed in [2] with the aim of reducing energy consumption and emission levels. The technologies considered were Photovoltaic modules, solar thermal collectors, hybrid PV/T collectors and systems, phase change material and underground based heat storage techniques, energy-efficient heat pumps, alternative facade materials for better thermal insulation and power generation, innovative ventilation technologies using pre-heating and cooling and efficient lighting systems. The results revealed that up to 80 % energy saving can be achieved through appropriate retrofit of conventional greenhouses with a payback period of 4–8 years depending on climatic conditions and crop type.
In this study the energy savings achievable in a greenhouse structure by means the proper design and operation of a heat recovery system are evaluated. The use of experimental data has allowed to identify the best solution in terms of heat recovery to maximize energy savings. Simulation were performed by means of a numerical transient code implementing the energy and mass balance of the indoor space of the investigated greenhouse and contemplating the air mass exchange with the outdoor environment. The calculation of the heat recovered by means of the enthalpy heat recuperators allowed to determine the annual reduction of the thermal energy requirements for the maintenance of proper level of temperature and relative humidity of the greenhouse environment.
2.1 Case study description
The greenhouse considered in the study is divided into two climatic sectors, which are remotely controlled. It has a height of 5.00 m at the base of the ridge. The central pillars are placed with an interaxis of 5.00 m, the lateral ones at 2.50 m. Each arch is made up of three suitably curved elements to create the cusp shape that facilitates the evacuation of condensation and a more rational positioning of the ridge doors.
The average global heat exchange coefficient is 5 W/m2K. The plan surface of the structure is 15 000 m2, with a total conditioned volume of 60 000 m3.
The central channels are equipped with a special anchor for the arcs and the intermediate tie rods. The side channels are 190 mm wide, 240 mm central ones and can be used for any operations to be carried out on the roof.
The cover is made of tempered glass.
The greenhouse is equipped with all the accessories necessary for the cultivation: the darkening system, the lighting system for photoperiodism, the assimilation lighting system, the basal and air ambient heating system, the network handling system, the soil sterilization system and a cooling system for the summer conditioning of the greenhouse. The greenhouse was considered to be located in Cosenza (Italy).
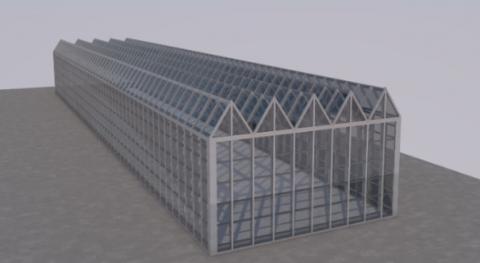
The set-point temperature is around 18 °C with a relative humidity of 80 % ± 5. Figure 1 shows the three-dimensional representation of the simulated greenhouse.
Figure 1. Schematic representation of the analysed greenhouse
2.2 Current methodology for humidity control
The annual production of flowers and plants in greenhouses requires services such as heating, lighting, dehumidification and often even cooling. Heating is often used, for the control and management of relative humidity as well as to maintain a pre-established temperature value. Excessive values of relative humidity in indoor environments can lead to condensation phenomena when the dew point on the vegetation surface is reached. These conditions lead to a reduction in the quality of the cultivation and to significant losses in terms of yield. Dehumidification is generally obtained, in the current state of the art, by exchanging volumes of internal humid air with drier external air, that is to say with a lower specific humidity. This process, moreover, is very energetic with important energy levels dispersed towards the external environment. In particular, humidity control occurs through the opening of the ridges of the structures generating the expulsion of humid air and consequent introduction of an external air flow rate, characterized, in the winter conditions, by lower temperatures and higher values with respect to the indoor air. The mixing of the two masses of air inside the conditioned volume determines the reduction of the humidity level but a consequent significant loss of sensible heat linked to the entrance of air flow at a lower temperature. This heat must then be reintegrated, determining a considerable additional load on the system's generator.
In the present work, a dynamic simulation code has been implemented in the Matlab environment that considers the use of heat recovery systems in winter conditions for the intake of external air into the indoor environment. The transient algorithm implemented evaluates the moist air psychometric equations through the dynamic behaviour of the volume of treated air allowing the variation of the thermo-hygrometrical parameters such as specific humidity, relative humidity to be determined, starting from the hourly profiles of experimental climatic data.
2.3 Basic assumptions
The analysis of the experimental data of indoor temperature and relative humidity in the greenhouse allowed determination of the rate with which the water vapour is added to the environment due to vegetation evapotranspiration. The difference in the humidity ratio in a time interval when there is no ventilation flow rate from the outside environment allowed the estimation of a vapour production of 4.6 gv/kgda. Considering the greenhouse volume V, and the dry air density $ρ_da$ , the final rate was calculated as $\dot{m}_v$ 50.5 kgv/h.
2.4 Heat recovery unit
The heat recovery unit considered in the study refers to a commercial available system equipped with high efficiency rotating heat recovery devices. The exchange surface of the heat recovery device, which is very large in proportion to its volume, enables one to achieve very high performances reaching efficiencies of 85%, with the advantage of low pressure loss and modest dimensions even for units with considerable flow rates. Several nominal air capacities, ranging from 1500 to 15000 m³/h with an external static pressure capacity of 300 Pa, are available. In particular, in the following analysis three different flow rates, most suitable for the particular application, were considered: 6000 m³/h, 8000 m³/h and 10000 m³/h. The rotary heat recovery units are of the air-to-air type consisting of a cylindrical rotor containing thousands of channels and with an extremely large surface, a casing and a drive system powered by an electric motor.
The electric three-phase 400/3/50 motor, which drives the heat exchanger is designed in accordance with the size of the rotor. All motors are provided with heat protection Energy recovery of up to 75 % of efficiency. The ventilating sections are equipped with single aspiration centrifugal fans of the plug-fan type with directly-coupled EC motor. The electronic motor ensures optimum flow rate regulation, high efficiency and limited noise emissions. The specific characteristics of the three considered models are reported in Table 1.
Table 1. Heat recovery models specifics
|
Flow rate m³/h |
Motors Power [kW] |
Average efficiency |
|
6 000 |
2 × 2.7 |
72.7× % |
|
8 000 |
2 × 2.8 |
76.0 % |
|
10 000 |
2 × 4.7 |
74.9 % |
In order to avoid excessive air velocity in the greenhouse environment that would arise from the employment of a variable flow rate in fixed ducts, a constant flow rate for each unit was assumed which activates and deactivates according to the logic described in the following section.
2.5 Hygrothermal calculations
Simulations were implemented with a 1-minute time step, setting an internal relative humidity threshold value of 85 % for the activation of the heat recovery system. Climatic external conditions were provided with the same time-step, starting from data monitored in an experimental site located at the University of Calabria. The external values of air temperature and relative humidity permit the calculation of the humidity ratio and enthalpy of external air, as follows:
${{x}_{ea}}=0.622\frac{{{\varphi }_{ea}}\centerdot {{p}_{s}}({{t}_{ea}})}{pt-{{\varphi }_{ea}}\centerdot {{p}_{s}}({{t}_{ea}})}$ (1)
${{h}_{ea}}={{c}_{p}}_{d.a.}\centerdot {{t}_{ea}}+{{x}_{ea}}(\lambda +{{c}_{pv}}\centerdot {{t}_{ea}})$ (2)
where $φ_ea$ is the relative humidity, pt is the total pressure and ps(tea) is the saturation pressure at external air temperature.
The heat recovery unit works providing an inlet air flow rate with a temperature dependent on the external air temperature. In particular, the following ranges were considered:
Table 2. Heat recovery inlet temperatures in function of external conditions
|
External air |
-5 °C ÷ 0 °C |
0 °C ÷ 5 °C |
5 °C ÷ 10 °C |
≥ 10 °C |
|
Inlet temperature |
13.7 °C |
15 °C |
16.2 °C |
17.5 °C |
When the external air temperature exceeds the value of 17.5 °C the heat recovery unit is supposed not to be operational because it does not provide beneficial effects, so the humidity control is carried out with the greenhouse ridges opening.
The water (vapour) balance of the greenhouse volume V is expressed as follows:
When $φ_{i-1}<85%$ and $T_{ea}<17.5 °C$ , the greenhouse humidity ratio change in time is determined only by plant vapour production:
$\frac{{{{\dot{m}}}_{v}}}{v\cdot {{\rho }_{da}}}=\Delta x$ (3)
where $\dot{m}_{HR}$
is the heat recovery unit flow rate. When $φ_{i-1}>85 %$ and $T_{ea}<17.5 °C$ , the heat recovery unit starts to operate determining an outlet air flow with humidity ratio equal to the internal one and at the same time an inlet airflow with humidity ratio equal to that of external air:$\frac{{{{\dot{m}}}_{HR}}{{x}_{ea}}}{V\centerdot {{\rho }_{da}}}+\frac{{{{\dot{m}}}_{v}}}{V{{\rho }_{da}}}=\frac{{{{\dot{m}}}_{HR}}{{x}_{i}}}{V\centerdot {{\rho }_{da}}}+\Delta x$ (4)
In the last scenario, if $φ_{i-1}>85 %$ and $T_{ea}>17.5 °C$
the activation of the greenhouse ridges determines an expulsion of internal air while generating an airflow inlet with humidity equal to xea:$\frac{{{{\dot{m}}}_{REN}}{{x}_{ea}}}{V\centerdot {{\rho }_{da}}}+\frac{{{{\dot{m}}}_{v}}}{V{{\rho }_{da}}}=\frac{{{{\dot{m}}}_{REN}}{{x}_{i}}}{V\centerdot {{\rho }_{da}}}+\Delta x$ (5)
where $\dot{m}_{REN}$ is the renewal airflow determined considering an air change rate, due to the ridges opening, of 0.3 h-1.
The internal relative humidity is then calculated from the humidity ratio:
${{\varphi }_{i}}=\frac{xi\cdot {{p}_{t}}}{{{p}_{s}}({{t}_{i}})\cdot (0.622+{{x}_{i}})}$ (6)
The enthalpy of the flow rate introduced in the environment through the recovery unit can be evaluated as:
${{h}_{imm}}={{c}_{pd.a.}}\cdot t+{{x}_{ea}}(\lambda +{{c}_{pv}}\cdot t)$ (7)
The thermal power requested for the post-heating treating of the air can be obtained by:
${{\dot{Q}}_{post\text{ heating}}}=({{h}_{sp}}-{{h}_{imm}})\cdot {{\dot{m}}_{hr}}$ (8)
where hsp
is the enthalpy at the set point conditions, equal to 51.59 kJ/kg obtained imposing the air conditions of 20 °C and 85 % of relative humidity.In the absence of the heat recovery unit, the humidity control is actuated by imposing the opening of the greenhouse ridges when relative humidity exceeds 85 %, allowing the intake of an external airflow that determines a thermal power loss equal to:
${{\dot{Q}}_{lost}}={{\dot{m}}_{hr}}\cdot ({{h}_{ind}}-{{h}_{ea}})$ (9)
The integration over time of $Q ̇_(post heating)$
and $Q ̇_lost$ allows calculation of the thermal energy saving obtainable thanks to the use of the heat recovery unit.3.1 Relative humidity control with heat recovery unit
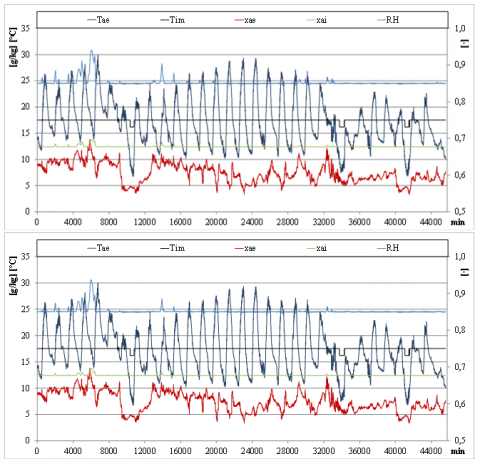
Figure 2 and Figure 3 report the trend of external air temperature (Tae), external humidity ratio (xae), inlet temperature from recovery unit (Timm), internal humidity ratio (xai) on the left y axis and relative humidity (RH) on the right y axis for the months of October and January considering heat recovery unit flow rates of 6 000 m³/h and 10 000 m³/h.
The analysis revealed that the most critical periods appear to be at the beginning of the winter season, in the months of October and November. In particular, in October from Figure 2 it is possible to observe that the relatively high values of air temperature and humidity ratio determine critical conditions for the heat recovery unit operation. The high humidity ratio, that especially in the first day of the month often exceeds the value of 10 gv/kgd.a. renders the stabilization of the internal relative humidity difficult which, on several occasions, rose to values greater than 85 % situation, reaching the worst scenario when the external humidity ratio overcame the internal one. The situation can be improved using a greater heat recovery unit flow rate as visible in Figure 2. The employment of a flow rate of 10 000 m³/h better stabilizes the internal relative humidity trend even though similar effects appear in days with elevated external humidity ratios.
Figure 2. External temperature and humidity ratio, internal relative humidity and humidity ratio and inlet temperature from heat recovery unit trends for a nominal flow rate of 6000 m³/h (on the right) and 10 000 m³/h (on the left) in the month of October
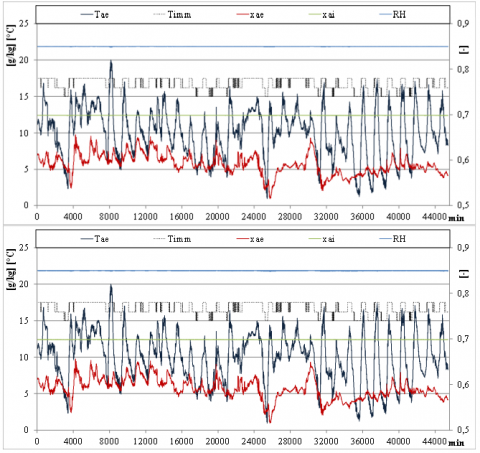
Figure 3. External temperature and humidity ratio, internal relative humidity and humidity ratio and inlet temperature from heat recovery unit trends for a nominal flow rate of 6000 m³/h (on the right) and 10 000 m³/h (on the left) in the month of January
Considering that the heat recovery unit operates introducing an air flow that has a temperature set according to the external value but a humidity ratio that is equal to the external one in the greenhouse environment, it can be appreciated that the closer the difference between internal and external humidity ratios, the higher the requested flow rate would be to maintain the desired value of relative humidity. Indeed, from simulations it was possible to observe that in October the complete stabilization of relative humidity (excluding the aforementioned cases of xae>xai) would require a nominal flow rate of at least 16 000 m³/h, a value out of the range of technical feasibility. Similar results are found in November where again the high presence of water vapour in external air determines excessive air flow rates (14 000 m³/h) for the heat recovery unit in order to level the internal relative humidity. In December, due to the low xae, recorded a flow rate of 6 000 m³/h is sufficient to maintain the chosen set point; a value lower than this would generate instabilities in the relative humidity trend. The same goes for the months of January, February and March. In the latter, the low values of external humidity ratio still allow for a complete control of the greenhouse indoor conditions.
3.2 Post-heating thermal power
The conspicuous effect of the employment of the heat recovery can be observed from the trend of the thermal power requested for the post heating of the air flow rate introduced in the greenhouse environment either from the heat recovery unity or from the ridges opening, due to the humidity control needs.
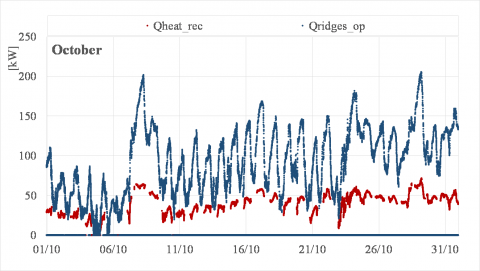
Figure 4. Thermal power requested for post heating of the introduced air flow in October in the case of heat recovery unit (Qheat_rec) and of ridges opening (Qridges_op)
For the month of October, Figure 4 reports the thermal power requested at each time step for the heating of the air flow introduced in the greenhouse to reach the indoor set point conditions of 20 °C. The following analysis refers to the RRU80 heat recovery unit.
It clearly appears how the traditional methodology of humidity control, opening the greenhouse ridges, generates a dramatic request of thermal power, evidently related to the introduction of large volumes of external air with a low temperature. The relative curve shows an extreme variable trend with values ranging from 0 to 205 kW. When the heat recovery unit is employed, the trend becomes less alternating and the thermal powers requested are conspicuously lower in the range of 0 to 72 kW. The strange inversion that occurs in the first days of the month is due to the presence of some days where the external air showed a very high humidity ratio and temperature determining enthalpy values higher than the indoor air. In this case, the post-heating thermal power becomes null.
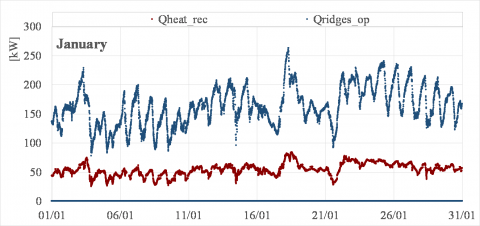
Figure 5. Thermal power requested for post heating of the introduced air flow in January in the case of heat recovery unit (Qheat_rec) and of ridges opening (Qridges_op)
Similar trends can be observed in a colder month, such as January (Figure 5). The curve of Qridges_op is extremely variable in the range 79 ÷ 263 kW. Again, the use of a heat recovery unit allows the curve to be flattened and shifted towards considerably lower thermal power. The curve oscillates in the range of 25 ÷ 84 kW.
Overall, considering the whole winter period, it was possible to observe that applying the traditional methodology for the humidity control of the greenhouse environment, the thermal power for air post heating, in 21.5 % of the time greater than 50 kW, for 16.7 % of the time greater than 100 kW and for 8.2 % of time greater than 150 kW, implying a very high energy consumption for the sustainment of the temperature set point values adequate for crop development. The heat recovery strategy, instead, allows to move to significantly minor powers for air post-heating: powers greater than 20 kW were detected for 34.5 % of the time, greater than 40 kW for 26 % of the time and only 2 % of the whole winter period, the thermal power requested was greater than 70 kW.
3.3 Optimization of the heat recovery size
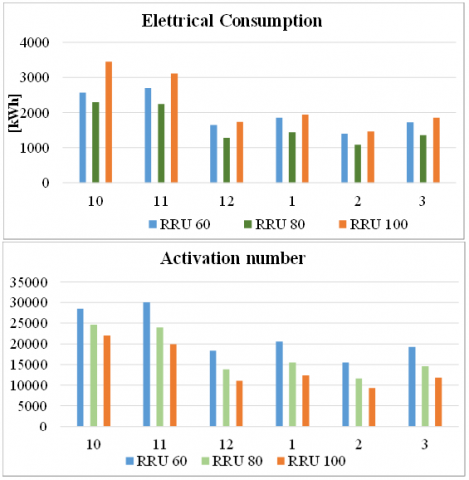
Figure 6. Ventilating section electrical consumptions (on the top) and activations number (on the bottom) for the three heat recovery units considered in the winter months
According to the results reported in the previous paragraph only three sizes of the heat recovery unit have been considered since they are able to maintain a fairly stable trend of relative humidity inside the greenhouse. Sizes lower than RRU 60 would not be able to guarantee a maximum relative humidity of 85 %; while sizes greater than RRU100 would generate unnecessary great air flow rates with associated electrical consumption and costs related to the distribution ducts. In order to define the appropriate size of the heat recovery unit, different aspects must be taken into account. First of all, to obtain elevated efficiency of the whole system the electrical consumptions of the ventilating sections with aspiration centrifugal fans should be minimized while, at the same time, in order to guarantee a long life of the machine the number of activations (one-minute time step) should be as low as possible to avoid intermittent operation with continuous on/off cycles. In light of these considerations, the last part of the analysis sought to optimize the heat recovery unit size.
As can be appreciated in Figure 6, in different months the fan electrical consumption of the three heat recovery units considered showed a similar pattern where the highest consumptions are connected with the highest air flow rate and thus the RRU100 machine. Conversely, the lowest airflow rate is not related to the lowest consumptions, that occurred instead for the RRU80 unit. This can be explained considering the specific data of the machines provided in Table 1, where it can be seen that moving from an airflow rate of 6000 to 8 000 m³/h does not imply a significant increment of the electrical power of the unit, whereas moving from 8000 to 10 000 m³/h determines a considerably higher motor power. The number of activations, instead, showed a linear trend where higher air flow rates correspond to a lower operation of the unit. The reduction in the activation number between RRU60 and RRU100 varied from a minimum of 6 190 cycles in February to a maximum of 10 169 in March.
The highest consumptions were found in October and November where they overcame 3 000 kWhel for RRU100 while being slightly over 2 000 kWhel for RRU80. This is evidently due in these months to the high time of operation of the units to maintain the indoor relative humidity level. Colder months of December, January, February and March showed reduced fan consumptions that were always less than 2 000 kWel for all the unit sizes.
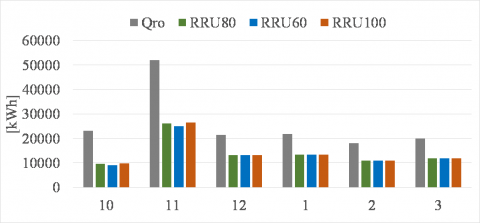
The annual results are summarized in Table 3. Furthermore Figure 7 reports the monthly energy requested for the post-heating of the air flow introduced in the greenhouse environment for the traditional management of ridges opening and with the use of the three considered heat recovery units.
Table 3. Annual fan electrical consumptions and number of activations for the three analyzed heat recovery units
|
Type |
Electrical consumption [kWhel] |
Number of activations |
|
RRU60 |
11 897 |
132 191 |
|
RRU80 |
9 724 |
104 199 |
|
RRU100 |
13 554 |
86 518 |
From the result in Table 3, it can be concluded that the best choice is the employment of a heat recovery unit with a nominal flow rate of 8 000 m³/h. Such a choice allows minimization of the fan electrical consumptions whilst still permitting a consistent reduction of the unit number of activations.
Considering the seasonal energy demand for the post-heating process, the traditional strategy implies a consumption of 155942,0 kWh whereas the use of RRU80 unit implies a consumption of 84834,2 kWh with a reduction of 45.6 %.
The reduction of energy consumption in greenhouse systems is a topic of great importance because production in greenhouses is a very intensive component in agricultural sector. The yearly production of flowers and plants requires different services, among which the most important are heating, dehumidification and often even cooling.
From an operational point of view, it is of extreme importance that the relative humidity does not exceed threshold values that could lead to condensation phenomena when the dew point on the vegetation surface is reached.
At the current state of the art, in most of the existing greenhouses, the control of relative humidity in winter is exercised with the management of the structure ridges opening, thus exchanging volumes of internal humid air with external air with a lower humidity ratio.
This process generates important heat losses because of the entrance of an external air flow at a lower temperature. To reach the set point level of temperature, heat must be reintegrated, determining a considerable request of thermal energy for the operation and conduction of the greenhouse activities.
In order to overcome these limitations, the employment of heat recovery units is proposed and investigated. The flow rates of 6000 m³/h, 8000 m³/h and 10000 m³/h were considered with reference to systems available on the market.
The proposed hygrothermal model is based on the water vapour balance of the greenhouse indoor environment and the calculation of the energy requested for the airflow post heating. Simulations were implemented with a 1-minute time step, setting an internal relative humidity threshold value of 85% for the activation of the heat recovery system. Climatic external conditions were provided with the same time-step, starting from data monitored in an experimental site located at the University of Calabria.
Results showed how the traditional methodology of humidity control, opening the greenhouse ridges, generates a conspicuous thermal power request because of the introduction of large volumes of low temperature external air in the environment. In a cold month the heat recovery unit is able to reduce the peak thermal power from 263 kW to 84 kW.
The optimum size of the heat recovery unit was chosen considering the electrical consumption of the ventilating section and the number of activations leading to the choice of the RRU80 type.
Finally, by the use of the selected unit, it is possible to maintain the desired humidity level in the greenhouse, yet producing relevant energy savings that amounted to 45.6 % for the whole winter season.
[1] Piro P, Carbone M, De Simone M, Maiolo M, Bevilacqua P, Arcuri N. (2018). Energy and hydraulic performance of a vegetated roof in sub-mediterranean climate. Sustainbility 10(10): 3473. https://doi.org/10.3390/su10103473
[2] Bruno R, Bevilacqua P, Cuconati T, Arcuri N. (2019). Energy evaluations of an innovative multi-storey wooden near zero energy building designed for mediterranean areas. Applied Energy 238: 929-941. https://doi.org/10.1016/j.apenergy.2018.12.035
[3] Canakci M, Akinci I. (2006). Energy use pattern analyses of greenhouse vegetable production. Energy 31(8-9): 1243-1256. https://doi.org/10.1016/j.energy.2005.05.021
[4] Cucumo M, De Rosa A, Ferraro V, Kaliakatsos D, Marinelli V. (2010). Correlations of direct solar luminous efficacy for all sky, clear sky and intermediate sky conditions and comparisons with experimental data of five localities. Renewable Energy 35(10): 2143-2156. https://doi.org/10.1016/j.renene.2010.04.004
[5] Bruno R. (2017). Optimization of glazing systems in Non-residential buildings: The role of the optical properties of air-conditioned environments. Building and Environment. https://doi.org/10.1016/j.buildenv.2017.09.011
[6] Bruno R, Oliveti G, Arcuri N. (2015). An analytical model for the evaluation of the correction factor FWof solar gains through glazed surfaces defined in en ISO 13790. Energy & Buildings 96: 1-19. https://doi.org/10.1016/j.enbuild.2015.03.016
[7] Cuce E, Harjunowibowo D, Cuce PM. (2016). Renewable and sustainable energy saving strategies for greenhouse systems: A comprehensive review. Renewable and Sustainable Energy Reviews 64: 34-59. https://doi.org/10.1016/j.rser.2016.05.077
[8] Bot GPA. (2001). Developments in indoor sustainable plant production with emphasis on energy saving. Computers and Electronics in Agriculture 30(1-3): 151-165. https://doi.org/10.1016/S0168-1699(00)00162-9
[9] Vadiee A, Martin V. (2012). Energy management in horticultural applications through the closed greenhouse concept, state of the art. Renewable and Sustainable Energy Reviews 16(7): 5087-5100. https://doi.org/10.1016/j.rser.2012.04.022
[10] Vadiee A, Martin V. (2014). Energy management strategies for commercial greenhouses. Applied Energy 114(C): 880-888. https://doi.org/10.1016/j.apenergy.2013.08.089
[11] Ajabshirchi Y, Ranjbar SF, Matloobi M. (2016). Solar energy conservation in greenhouse: Thermal analysis and experimental validation. Renewable Energy 96: 509-519. https://doi.org/10.1016/j.renene.2016.04.079
[12] Attar I, Farhat A. (2015). Efficiency evaluation of a solar water heating system applied to the greenhouse climate. Solar Energy 119: 212-224. https://doi.org/10.1016/j.solener.2015.06.04
[13] Vadiee A, Martin V. (2013). Energy analysis and thermoeconomic assessment of the closed greenhouse - The largest commercial solar building. Applied Energy 102(2): 1256-1266. https://doi.org/10.1016/j.apenergy.2012.06.051
[14] Djevic M, Dimitrijevic A. (2008). Energy consumption for different greenhouse constructions. Energy 34(9): 1325-1331. https://doi.org/10.17660/ActaHortic.2008.801.91