OPEN ACCESS
One of the greatest strategies in order to reach European energy goals can be considered the reduction of the primary energy consumption caused by the existing building.
In order to reach a sustainable approach, the refurbishment of historical and traditional buildings in a holistic view must be taken into account.
Between the various design processes, lighting aspects are fundamental, considering all the possible ways the building is used by the final user and also according to the climate context parameters.
In the present study, a numerical simulation was performed by DIALux software on an existing Coastal Tower placed in Apulia Region, supposing to design the existing building as an exhibition hall. Using bibliographic data, a comparison between LED lamps and halogen and compact fluorescent lamps was carried out.
Moreover, an economic and energy analysis was carried out by EcoCALC software demonstrating the potential energy and economic savings when using innovative solutions.
DIALux, EcoCALC, fluorescent lamps, halogen lamps, LED, lighting system
Energy saving has recently assumed a fundamental role both in terms of the environmental protection, reducing the existing pollution by the introduction of new sustainable technologies, and for the protection of human health. Lighting constitutes a large part of the energy demand and greenhouse gas emissions [1].
Currently, more than 33 billion lamps operate worldwide, consuming more than 2650 TWh of energy annually, which is 19% of the global electricity consumption [2].
In this sense the optimization of energy balance of the existing buildings by an innovative lighting design can represent a very important issue to reach global energy saving.
In Italy about 4 million of buildings were built before 1920 [3]. Many of these buildings have been considered having a significant historical-artistic value, thus they were protected as Cultural Heritage. Italian standards [4-5] exclude historical and architectural heritage from energy retrofitting in order to safeguard their integrity. Thus, when considering the restoration and the conservation of historical buildings is necessary to obtain good energy performances respecting the original value.
One of the best and non-intrusive practice is to replace low efficiency lighting source with high efficiency ones, i.e. the LED systems. Santamouris et al. [6] affirmed that when considering lighting, the energy saving can be achieved either by using more efficient lighting devices or by considering the natural lighting aspects.
The European Union has developed several standards for the energy saving taking into account a great number of numerical parameters for the building energy evaluation [7-9].
According to Trifunovic et al [10] when using LEDs lamps the consequent saving can reach up to 30% of traditional consumption in comparison with traditional systems as halogen lamps. LEDs have numerous advantages not only in terms of energy saving, but also in terms of useful life, economic profile (low maintenance costs) and final design (small size and flexibility of the application).
Bellia et al [11] have compared lighting’s results for a museum (LED lamps versus CFL and halogen lamps). The researchers show the analysis of the performances offered by different lighting sources used for the illumination in a museum center, with specific lighting necessities.
The case study analyzed consists of a project for the functional refurbishment of three indoor environments of a Coastal Tower placed in Apulia region, used as exhibition hall.
Lighting plays a leading role especially when it has the task of enhancing and making visible the works of art of a museum center.
In the following case study, two lighting solutions are compared in terms of lighting performances, efficiency, durability and economic advantages. The first solution, named type A, includes the use of halogen lamps and compact florescent lamps; the second solution, named type B, involves the use of light emitted diode lamps.
The case study was a coastal tower placed in the municipality of Racale (Lecce). It belongs to the system of watchtowers built in 16th century along the entire length of the Apulian seashore to protect citizens from constant invasions. Each tower is placed in a strategic positions along the coast, in order to allow a communication with the towers on either side of it. The layout of the tower is shown in figure 1. There are reported the examined environments and the lighting system apparatus taken into account.
Figure 1. Layout of the distribution of the tower with the indication of the three interior spaces studied and the lighting system arrangement
Three main indoor environments at the first floor are taken into account: a main room with an octagonal shape (named X) and two other adjacent rooms. The ceiling of each room is vaulted; the span was 4,70 meter.
On two walls of the main room (X) there are two internal openings, currently walled up, and used in the past for the storage of vases and furnishings. Three gunboats are located on three walls. They represent the unique source of natural light. The rooms Y, Z, adjacent to the octagonal one, have windows placed at a depth of 30 cm from the outer side. The superficial finishing of the materials used influences how sunlight can be reflected in the room.
The reflected light caused by the indoor building elements (furniture, walls, pavement, ceiling), known as indirect light component, together with the direct light coming from the windows, determines the Illuminance level in each room. To calculate the reflection coefficients of the existing element, the DIALux software database was used. The windows are characterized by a single glass with a transmission coefficient of 0.9 and a refractive index of 1. The stone walls and ceiling are covered with light colored gypsum plaster, that has a reflection coefficient of 0.86. The pavement is made of porcelain stoneware with a reflection coefficient of 0.23.
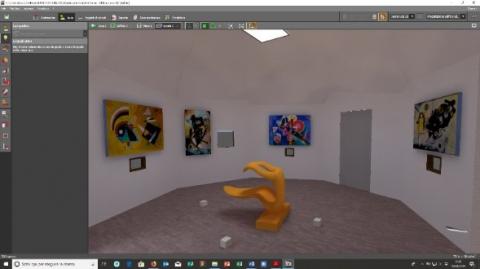
The intended use of the main room X is a temporary exhibition hall focusing on the theme of abstract art. On the walls, some oil paintings have been placed; while on the floor, a sculpture recalling the abstract idea of a chair has been placed at the center of the room. The functions of the other adjacent rooms are to hold permanent exhibitions of different types of artworks.
DIALux software [12] was used for the design and the numerical simulation of lighting system comparing two different solutions. For the first one, named A, there were used CFL lamps (Compact Fluorescent Lamps) and HL lamps (Halogen Lamps); for the second solution LED lamps (Light Emitted Diode) were used.
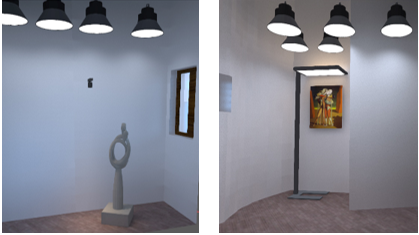
A 3-D model of the simulated rooms were reproduced, by the DIALux software in Figures 2-3.
Figure 2. Room X
Figure 3. Rooms Z (left) and Y (right)
Finally, the software ecoCALC [13] was used in order to simulate and compare the energy consumptions and the economic costs of the two solutions, allowing to define the best solution.
HL lamps are characterized by a low luminous efficiency. This type of lamps has the advantage of being able to guarantee an optimal Color Rendering Index (CRI). HL lamps are currently used more rarely also due to their high sensitivity to voltage variations and the average lifespan of approximately 1000 hours [14]. CFL lamps have a significantly lower energy consumption and a higher luminous efficiency in comparison with the HL lamps; furthermore, their design allows the light to be concentrated in a small volume [15].
Shailesh et al. [16] express the MTTF (Mean Time to Failure) as the time, in hours, to failure for non-repairable components like an integrated circuit soldered on a circuit board). Salata et al. [17] reports for HL lamps an MTTF of 4000 hours whereas for CFL lamps an MTTF of 12.000 hours.
LED lamps represent the innovation in terms of lighting have excellent luminous efficiency and good chromatic performances [18]. Their MTTF depends on operating temperature of the junction. These light sources have a long useful life, a high luminous efficiency, a good CRI and small dimensions. The only disadvantage is related to the high initial cost compared to that of traditional lamps. Salata et al. [19] affirmed that the most energivorous phase for the light sources is during their usage, followed by the phases of production. The average amount of energy consumed during the useful life of HL lamps is about four times more than the one used by LED and CFL lamps.
Several simulations were performed with the software to define the best arrangement of the lighting system (Figure 1).
In the X room, the lamps were arranged as follows: a hanging light panel, suspended from the ceiling 0.90 m was placed in a central position to ensure the correct visibility of the paintings on the walls, four cube lamps were placed on the floor to illuminate the central sculpture by an indirect lighting and another cube lamp was placed on the floor near the entrance to allow a correct Illuminance of the user’s path.
In the adjacent room, Y, there were settled an upright lamp and five hanging lamps suspended from the ceiling for 1.60 meters.
In the room Z four hanging lamps illuminate the room and a spotlight lamp was chosen to emphasize the historical sculpture.
Table 1 shows the characteristics relating to the light sources used in both the solutions.
Table 1. Data of light sources
|
Model |
Type of source |
N. Lamps |
Power (W) |
Luminous flux (lm) |
|
Panel 600
|
Led |
1 |
33 |
2500 |
|
Wall light cube |
Led |
6 |
15.8 |
200 |
|
High bay basic |
Led |
9 |
95 |
1000 |
|
Capa s-lr |
Led |
1 |
13.2 |
1000 |
|
Supersystem |
Led |
1 |
8.8 |
633 |
|
Lamp 1 |
HL lamps |
1 |
100 |
2500 |
|
Lamp 2 |
CFL lamps |
6 |
21.12 |
200 |
|
Philips 1 |
HL lamps |
9 |
288 |
1000 |
|
Philips 2 |
CFL lamps |
1 |
17.6 |
1000 |
|
Philips 3 |
CFL lamps |
1 |
11 |
633 |
The artworks should be classified in 4 categories [20] named Sensibility Classes according to the susceptibility to light damages of the materials composing the object. It was supposed that the artworks placed in the Y and Z rooms belong to the second class (Low Susceptible to light damage).
Thus, the limit value of the Illuminance recommended by the standard is 200 lux on the artworks. In the room X it was assumed that the artworks belong to the third class (Medium Susceptibility to damage) and the limit value of the Illuminance is 50 lux. According to the UNI EN 12464 [9], the Illuminance limit on the surfaces of the visual task area depends on the specific requirements of the exhibition. Therefore, in the present case, there were taken into account the following general limits for the room Y and Z: on the horizontal surfaces average Illuminance (Eaverage) was fixed as Eaverage>350 lx, for the vertical surfaces near the artwork Eaverage>400 lx. For the room X, instead, considering the presence of Medium Susceptible artworks, a limit value of Eaverage both on horizontal and vertical surface of 200 lux was supposed. The Illuminance Uniformity was also taken into account as the ratio between minimum Illuminance and average Illuminance (Emin/Eaverage) [9]. Bonomo et al. [21] for a best visual performance of the artwork, recommended an Illuminance Uniformity Emin/Eaverage>0,5.
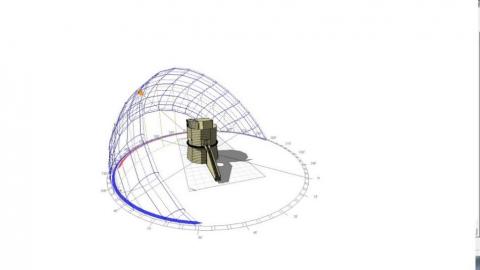
Figure 4. Autumnal equinox 10.00
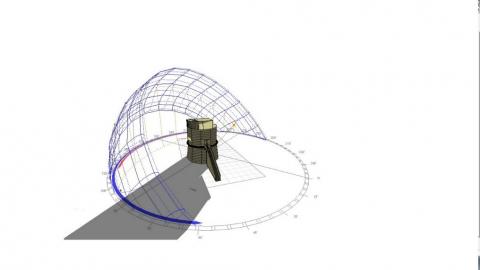
Figure 5. Summer solstice 18.00
A first phase of the analysis was performed by Ecotect software [22] analyzing the seasonal and daily sun paths in the specific climatic context studying the natural light contribution and the shadows changeability (figure 4-5).
The lighting analysis was then implemented by DIALux software. Two scenarios were chosen: clear sky and overcast sky, evaluated at 12.00 and 18.00 during the autumnal equinox (September 21) and at the summer solstice (June 21). Two main parameters were considered to support the analysis: the DF (Daylight Factor) and the average Illuminance of the visual task areas. The Daylight Factor is the ratio of interior Illuminance at a given point on a given plane, usually the work plane, to the exterior Illuminance under known overcast sky conditions. According to the Italian standard [23] in order to assure an adequate level of natural lighting the DF must be greater than 2 %.
The first simulations were carried out considering only the interaction between the natural light and the internal environments. During the summer solstice, when the artificial lighting system does not work, at 12.00, in the X room and in the Y and Z rooms, a DF value lower than 0.003 % and the Eaverage lower than 10 lux demonstrate an insufficient contribution of natural lighting.
During the summer solstice, at 18.00, in overcast conditions, the worst situation is achieved; Eaverage is ranging from 3 to 5 lux.
Instead, during the autumnal equinox, the results demonstrate that the worst situation is reached at 18.00 with Eaverage values ranging from 1 to 2 lux.
The second phase of the analysis involve the use of the artificial lighting system. The following boundary conditions were taken into account: 3650 hours of lighting during the year, divided into 10 operating hours/day from Monday to Friday, 3 operating hours/day on Saturday morning and 8 operating hours/day on Sunday.
Using the software, it was possible to study the way in which light is distributed in the rooms according to the particular type of lighting solution adopted and above mentioned.
The results of the simulation, reported in table 2, demonstrate the equivalence of the two solutions in terms of lighting performances.
Table 2. Comparison of the two lighting system solutions
|
Room
|
Eaverage (lx) Type A |
Eaverage (lx) Type B |
Eaverage (lx) |Δ|% |
|
|
Horizontal surfaces |
||
|
Room X |
139 |
123 |
11,5 |
|
Room Y |
591 |
595 |
0,70 |
|
Room Z |
759 |
980 |
29,1 |
|
|
Vertical surfaces |
||
|
Room X |
97,3 |
93,1 |
4,30 |
|
Room Y |
442 |
595 |
4,30 |
|
Room Z |
759 |
980 |
17,5 |
In the Z room, Eaverage between 759 and 980 lx was reached on the horizontal and vertical surfaces using the two different solutions. In the Y room, an average Illuminance lower than 600 lx was achieved.
In the X room Eaverage lower than 200 lx was kept on the surfaces near the artwork.
Illuminance Uniformity Emin/Eaverage>0.50 was generally kept when using both the solutions.
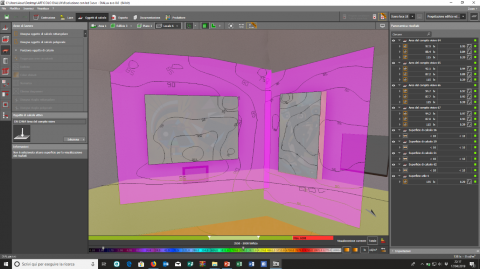
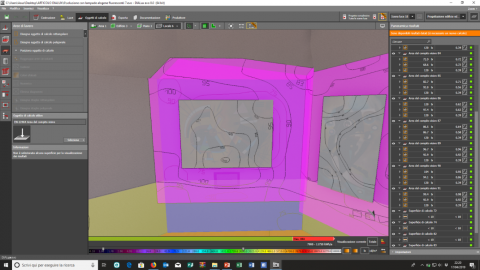
Furthermore, in order to confirm the equivalence of the two lighting systems there were reported the Isolux curves (curves having the same numerical value of Illuminance) distribution for the same calculation surface in the X room (Figures 6-7). By the two lighting systems solutions similar Illuminance values on the artworks and on the vertical surface can be achieved.
Figure 6. System type A: An example of Isolux curves on a vertical surface
Figure 7. System type B: Isolux curves on the same surface of Figure 6
Table 3 reports the average Illuminance Eaverage (lx) and Illuminance uniformity Emin/Emedia for the same surface in the room Y. It is demonstrated that the average Illuminance Eaverage is similar; instead, considering the minimum value of the Illuminance Emin for the two solutions, there is a considerable difference of the Illuminance Uniformity.
Table 3. Lighting results on the same calculation surface for the two lighting system solutions in the Y room
|
Illuminance E |
Eaverage (lx) |
Emin (lx) |
Emin/Eaverage |
|
System Type A |
442 |
15 |
0,034 |
|
System Type B |
540 |
303 |
0,561 |
A comparison of the two solutions was made also in terms of energy and economic saving by ecoCALC software [13], based on the fundamental concepts of the economic analysis of project financing [24]. An energetic comparison was performed; there were considered the power installed (W) and the Light Energy Numeric Indicator (LENI) (kWh/(m²a)). This latter one is an index of the efficiency for a specific building of an entire lighting installation, including controls, expressed in terms of total annual energy per square meter [7].
For the economic analysis, there were considered the operating costs including the costs of the maintenance.
Tables 4 and 5 show the costs of the solutions applying the HI and CFL lamps (Type A) and the LED lamps (Type B) separating the cost of the source and the cost of light fixture.
Table 4. System type A: Costs of fixture and source
|
Type of lamp |
Cost of light fixture (€) |
Cost of source (€) |
|
Panel 600 |
116,60 |
18,30 |
|
Wall light cube |
22,90 |
10,10 |
|
High bay basic |
300 |
24,00 |
|
Capa s-lr |
200 |
15,00 |
|
Supersystem |
100 |
12,00 |
|
Type of lamp |
Cost of light fixture (€) |
Cost of source (€) |
|
Lamp 1 |
116,60 |
3,54 |
|
Lamp 2 |
22,90 |
10,03 |
|
Philips 1 |
300 |
7,78 |
|
Philips 2 |
200 |
10,03 |
|
Philips 3 |
100 |
10,57 |
Table 6 shows the parameters taken into account for the simulation and valid for Italian Electricity and Gas Authority [25].
The lighting system with LED lamps does not require extraordinary maintenance during its life, as their duration is around 50000 hours. Instead, the solution using HL and CFL lamps will require constant replacement, based on their scarce lifespan.
The use of both systems is shown in Table 7, in which general, energy and operating costs of the two solutions are estimated yearly and over a service life period of 30 years.
The total cost of the lighting system with LED lamps allows to reach a general economic saving of about 68% over the entire service life period. Considering the initial cost of the investment, the solution with LED is more expensive than the HL and CFL lamps; however the ratio between the initial cost of the investment and total cost demonstrate the economic convenience of the LED system over a long period.
Table 6. Economic and financial parameters
|
Parameters |
Numeric values |
|
Price of the electric energy |
0,20 €/kWh |
|
Yearly evolution of the energy costs |
7,6 % |
|
Maintenance cost per hour |
21,40 €/h |
|
Maintenance costs for the painting of the room |
5,00 €/m2 |
|
Maintenance cycle for the rooms painting |
6 years |
|
Yearly inflation rate |
2,50% |
|
Yearly capital interest |
2% |
|
General |
HI and CFL lamps |
LED lamps |
|
Total costs of the solution (€) |
457.706 |
146.334 |
|
Cost saving during the service life (%) |
- |
68% |
|
Total costs saved over 30 years (€) |
- |
311.372 |
|
Average of the total costs per year (€/y) |
15.257 |
4.878 |
|
Initial investment cost (€) |
4.516 |
5.853 |
|
Initial Investment costs/ Total costs (-) |
0,009 |
0,039 |
|
Energetic parameters |
|
|
|
Total installed power (W) |
2.847 |
1.005 |
|
Power installed (W/m2) |
126 |
44,37 |
|
Energy consumption (kWh/y) |
10.393 |
3.670 |
|
Energy saving per year (kWh/y) |
- |
6.723 |
|
LENI [kWh/(m²a)] |
69,79 |
24,29 |
|
Operating costs |
|
|
|
Average costs of the energy (€/y) |
1.387 |
448 |
|
Energy saving (€/y) |
- |
939 |
|
Average costs of the energy during the service life of the system (€) |
41.610 |
13.440 |
|
Energy costs saving during the service life of the system (€) |
- |
28.170 |
|
Average operating costs (€/y) |
2.623 |
1.643 |
|
Operating costs saving (€/y) |
- |
980 |
|
Operating costs during the service life of the system (€) |
78.683 |
49.281 |
|
Operating costs saving during the service life of the system (€) |
- |
29.402 |
In terms of energy consumption, it can be appreciated a significant amount of energy power requested by the solution A in comparison with the solution B. The use of LED allows to achieve an annual energy saving of about 65 %.
Moreover, the LENI assessment, reduced of about 35% when using LED lamps, confirms the convenience in terms of energy for the second lighting system.
The operating costs hold both the energy cost and functional costs. It can be note that a great saving of about 38% is achieved when using the second solution over a period of 30 years of life service.
The necessity to reduce energy requirements of lighting systems always assuring the best lighting performances has become a priority also for the cultural heritage buildings. In Italy does not exists a specific standard for museum and exhibition halls; the lighting performances of a plant depend on the specific features of the environment.
For a better evaluation of the visual comfort conditions it is fundamental to examine the interaction between the natural light and the artificial light, considering that any action of building restoration cannot change the original position and configuration of the existing windows.
In the present case study, an ancient coastal tower in south Italy was assessed, presuming to convert it in an exhibition hall for temporary and permanent exhibition.
There were examined two different lighting systems for the indoor environments: a first one applying traditional halogen and compacted fluorescent lamps and the second one with the use of LED lamps.
A numerical analysis was carried out by DIALux software. It was demonstrated that the two planned solutions satisfy the demands in terms of Illuminance range both on the vertical and horizontal surfaces, including the Illuminance limit considered for the artworks. Furthermore, in some cases the Illuminance Uniformity is not respected when using the first solution.
From the point of view of the energy and economic aspects it was demonstrated that, although an initial more expansive investment cost for the lighting system with LED, a significant overall energy and cost saving is achieved. The simulation, performed by EcoCALC software, shows that the system with LED lamps is financially more sustainable if considering a life service of 30 years.
This research received no specific grant from any funding agency involved in the public, commercial, or not profit organizations. A special thanks must be addressed to Cristina Giannico and Chiara Visceglia for the help provided to the technical metric survey.
[1] Lowry G. (2016). Energy saving claims for lighting controls in commercial buildings. Energy Buildings 133: 489-497. https://doi.org/10.1016/j.enbuild.2016.10.003
[2] Halonen L, Tetri E, Bhusal P. (2010). Energy efficient electric lighting for buildings. International Energy Agency Energy Conservation in Buildings and Community Systems (ECBCS).
[3] De Rossi F, Scuto V, Tino SGP. (2006). Vanoli. Risparmio energetico come elemento qualificante nel recupero di palazzine anni ’30. In proceedings of The 61th ATI National Conference. Perugia, Italy. Available: https://www.cti2000.it/index.php?controller=pubblicazioni&action=show&id=28116
[4] Legislative Decree. n.192, 2005. Italian Government. Technical standards for implementation of Directive 2002/91/EC of the European Parliament on the energy performance of buildings.
[5] Legislative Decree n. 311, 2005. Italian Government. Corrective and supplementary provisions to the Legislative Decree n. 192 for implementation of Directive 2002/91/EC of the European Parliament on the energy performance of buildings.
[6] Santamouris M, Argiriou A, Dascalaki E, Balaras C, Gaglia A. (1994). Energy characteristics and savings potential in office buildings. Sol Energy 52: 59-66. https://doi.org/10.1016/0038-092X(94)90081-C
[7] EN 15193, 2017: Energy performance of buildings – energy requirements for lighting.
[8] EN 15603, 2008: Energy performance of buildings – overall energy use and definition of energy ratings.
[9] EN 12464-1, 2011: Light and lighting –Lighting of work places – Part 1: Indoor work places.
[10] Trifunovic J, Mikulovic J, Djurisic Z, Djuric M, Kostic M. (2009). Reductions in electricity consumption and power demand in case of the mass use of compact fluorescent lamps. Energy 34: 1355-1363. https://doi.org/ 10.1016/j.energy.2009.05.014
[11] Bellia L, D’Ambrosio Alfano FR, Giordano J, Ianniello E, Riccio G. (2015). Energy requalification of a historical building: A case study. Energy and Buildings 95: 184-189. https://doi.org/10.1016/j.enbuild.2014.10.060
[12] DIAL GmbH. Light Building Software. http://www.dial.de/DIAL/it/home.html.
[13] EcoCALC.https://www.zumtobel.com/eco/it/ecoCALC_egistration.asp
[14] Iliadis IG. (1998). Archaeological museum showcase lighting. Light Res Technol 30: 75-83. https://doi.org/10.1177/096032719803000204
[15] Aman MM, Jasmona GB, Mokhlis H, Bakarb AHA. (2013). Analysis of the performance of domestic lighting lamps. Energy Policy (52): 482-500. https://doi.org/10.1016/j.enpol.2012.09.068
[16] Shailesh KR, Ciji PK, Savitha GK. (2012). LED Lighting reliability from a failure perspective. ICETEEEM-2012 468-472.
[17] Salata F, De Lieto Vollaro A, De Lieto Vollaro R, Davoli M. (2014). Plant reliability in hospital facilities. Energy Procedia 45: 1195-1204. https://doi.org/10.1016/j.egypro.2014.01.125
[18] Chang MH, Das D, Varde PV, Pecht M. (2012). Light emitting diodes reliability review. Microelectron Reliability 52: 762-82. https://doi.org/10.1016/j.microrel.2011.07.063
[19] Salata F, De Lieto Vollaro A, Ferraro A. (2014). An economic perspective on the reliability of lighting systems. Energy Conversion and Management 84: 623-632. https://doi.org/ 10.1016/j.enconman.2014.04.063
[20] CEN/TS 17165 en, 2018: Light and lighting - Lighting system design process.
[21] Bonomo M, Bertolaja C. (2013). L’illuminazione delle opere d’arte negli interni. Guida alla progettazione. Ediplan Editrice. AIDI, Milano. www.autodesk.it
[22] Italian Ministerial Decree 5 July 1975. Modificazioni alle istruzioni ministeriali 20 giugno 1896, relativamente all'altezza minima ed ai requisiti igienico-sanitari principali dei locali di abitazione.
[23] Newnan DG, Eschenbach TG, Lavelle JP. (2004). Engineering economic analysis. Oxford: Oxford University Press.
[24] Italian Electricity and Gas Authority (Autorità italiana per l’energia elettrica e il gas). http://www.autorita.energia.it/it/index.htm.