OPEN ACCESS
The theory of Panergy states that, within a homogeneous socio-economic environment, for example a nation, there is a complete correspondence between the energy spent to make a product/service and its market price. Panergy allows, in a simple way, to measure the energy incorporated in any product/system and expresses it in units of energy or currency alternately. In this document, the concept of Panergy has been exploited and extended to examine its applicability to economy in general and to monetary economy in particular. We demonstrate that the economic value of any object produced by the humankind or any human activity can be considered as a form of energy and obeys the laws of energy systems. Many similarities between thermodynamics and economic/monetary dynamics have been found out. The consequences are that not only energy can be considered a currency unit, but also that the economic value of objects behaves like a thermodynamic gas and that, like in a gas, thermodynamic transformations can describe the variations and monetary spreads between and within the different human communities.
The document contains some references on the theory of Panergy previous published, the theoretical explanation of its generalization towards economy and the first discussion on the application of Thermodynamic approaches to monetary and economic processes.
Panergy, emergy, energy economy, monetary strategy, energetic currency
The Theory of Panergy was promoted by author at the 2nd AIGE Conference in Pisa in 2008, then brought back to the 3rd AIGE conference in Parma in 2009 and again at the 33rd IAEE International Conference in Rio de Janeiro in 2010 [2-4]. A detailed discussion of it is reported in reference [5].
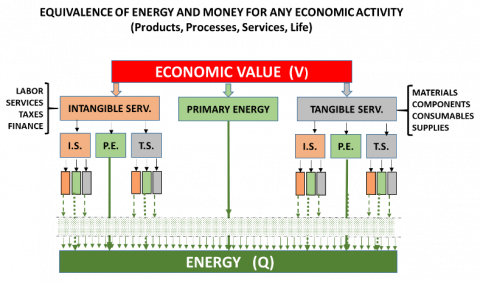
To understand the basics of the theory, refer to Figure 1. It is noted that the economic value of any human activity (production, processes, service or simply living the life) within a defined socio-economic community, at a given time and an actualized monetary value, consists of three main components: Energy directly used (P.E. Primary or usable energy), Intangible Services (I.S. Manpower, Services, Taxes) and Tangible Services (T.S. such as materials and all tangible purchases). As an example, if the object is a simple handicraft product, the three components are Energy, Manpower and Materials.
A second level of analysis shows that both intangible and tangible contributions consist of three attributions: Direct energy (P.E.). Intangible Services (I.S.) and Tangible Services (T.S.). Bringing the reasoning to the extreme consequences (→ ∞) we get a complete equivalence between the economic value and the energy employed in the activity. The energy corresponding to the monetary value is encompassing of all forms of direct and indirect energy involved in the process. We call it Panergy.
The energy/money conversion factor β (we call it Specific Panergy) is given by Eq. (1) where Q (expressed in energy units) is the expenditure of Primary Energy and V (expressed in monetary units) is the monetary expenditure in a defined socio-economic context. These two factors correspond to the primary energy consumption and the overall money expenditure in the context in the same period.
Figure 1. Explication of the theory of Panergy
$\beta=\frac{Q}{V}$ (1)
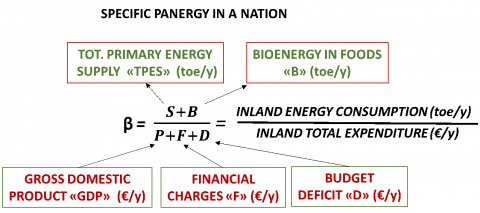
$\beta=\frac{S+B}{P+F+D}=\frac{ENERGY EXPENDITURE (kWh or toe)}{MONETARY EXPENDITURE (€)}$ (2)
S is the Primary Energy consumed (in any form), B is the biologic energy contained in foods, P is the total cost for living, F are the financial costs and D is the budget negative result; all the above parameters are referred to the community under review.
If the community is a Nation, in a period of a year, the expression for β is explained in Figure 2.
Figure 2. Structure of the specific panergy β
In previous works [2, 5] β was defined as the energy intensity (or the inverse of the price of primary energy charged to end users in the socio-economic environment in which the product is marketed). The new definition (Eq. (2) and Figure 2) is more extensive: in its dimensioning, contributions are introduced not taken into account in the classical statement of energy intensity. However, as we shall see in the following, the two definitions substantially coincide or differ in negligible quantities.
In official national statistics, TPES is expressed in energy units including import (payed in money, then in currency units). This circumstance facilitates the evaluation of the Specific Panergy β.
Immediate consequence from the considerations above is that knowing the amount of Panergy (in currency units) allows to determine, quickly, the overall embodied energy (not only the direct one) in a product/process/service once its market price is known.
A second relevant consequence is that (national) currency can be expressed in energy units (for example kWh) instead of monetary units (for example €). A currency of this kind is not subject to inflation.
The third very relevant consequence is that money is a form of potential energy (or a form of energy storage), not different from the thermal, mechanical or electrical one and its properties obey to the laws of thermodynamics.
In this work, we use kWh (or somewhere toe) as energy unit because it is more familiar to energy economists and € as currency unit because it is more familiar to the author.
2.1 Conversion of energy into money
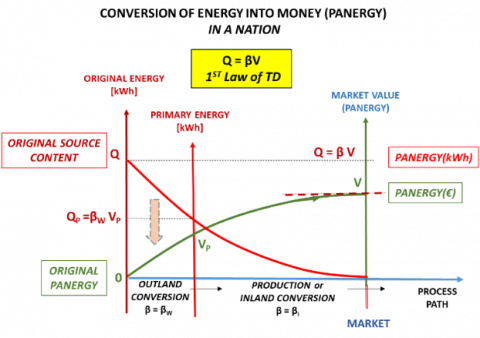
The considerations reported above state that money is a form of energy and that the monetary value of a product/process/activity derives from the Panergy embodied during its deployment (see Figure 3).
Figure 3 is referred to a conversion process at constant β (in general, β is time dependent). Its value depends on the context where the process is exploited; it can be a Nation or a smaller community. In a Nation, the conversion at constant β makes sense because the parameters composing the Specific Panergy are updated every year. Figure 3 explains how Original Energy (that associated to fossil sources stored in geological wells or to a radiant solar source) initially, has zero economic value because it is available but not usable; becomes usable when energy is spent to convert it into Primary Energy. That is made, for example, by mining organizations, refining companies or solar plant suppliers.
Figure 3. Conversion of energy into Panergy in products or services
In a second stage Primary Panergy (the economic value of the beginning activity) is furtherly increased during the production, or in general the development of the activity, achieving a definitive market value (final Panergy). At the end of this process, the original energy is transformed into money completely. The corresponding Panergy (in monetary units) is usable integrally. In that, the process respects the 1st law of Thermodynamics
Referring to conversions actuated in a national community, often, for certain sources, the phase of transformation from Original to Primary Energy is made abroad and the related βw is different from the domestic βi.
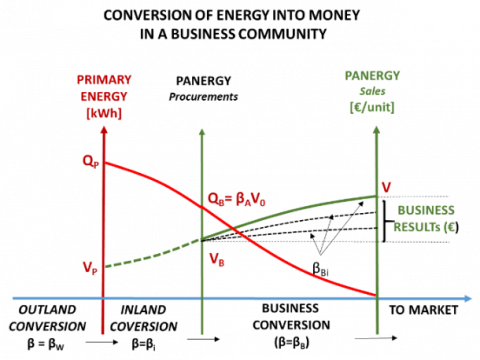
If is a business company to actuate the conversion, the process is almost the same. In that case β is the ratio between the Panergy consumption of the Business Unit (in kWh) and the sales revenues (in €) of the Unit itself and coincides with the Company productivity. The differences in market price of the products are justified by the different amounts of Panergy spent by any business unit in completing the product.
Figure 4. Conversion of energy to Panergy in business organizations
As a result, the business Specific Panergy βBi, as shown in Figure 4, is different from the context factor βi. The difference between the two values produces the business result.
It appears clear that conversions of Energy into Money make sense also for pure financial activities.
2.2 Conversion of money into energy
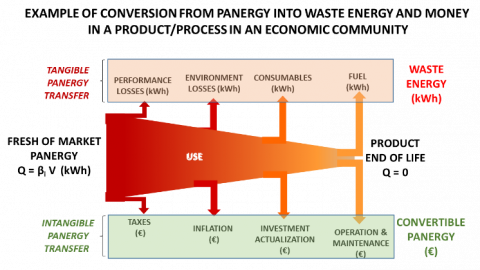
Figure 5 shows, with an example, how Panergy embodied in a product can be picked out and transferred to the agents who use it. Use makes Panergy to degrade and its economic value to decrease. This mechanism of Panergy exchange is a very important property of the energy embodied in a product, otherwise considered not convertible.
Figure 5. Panergy exchanges in the use of consumer goods
Part of the original Panergy is transferred, to environment along the life cycle and becomes directly waste energy. This is the tangible Panergy (losses, degrade, direct energy…), generally it is expressed in energy units. Another part, the intangible one, that can only be expressed in monetary units (taxes, interests, services and so on), is a transfer of money made available to users for further consumption.
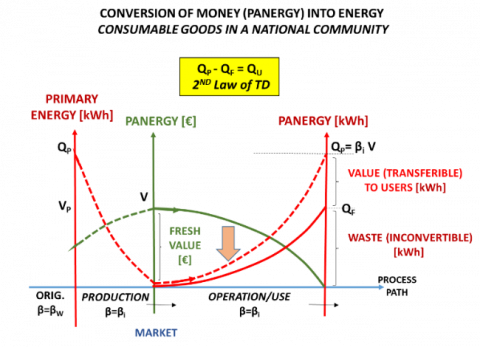
This kind of process, reported on a diagram, is shown in Figure 6. It is an evident confirmation that the conversion of money into energy obeys to the 2nd law of thermodynamics since only a portion of the initial monetary Panergy can be reconverted into convertible new energy (other money).
Figure 6. 2nd law of thermodynamics in conversion of money to energy in a nation
Once the initial economic value V, in subsequent conversions, is spent and the product/service completely used, all the amount of Panergy is released to the environment, in the form of waste, and further transformations of it are not allowed.
That means that the conversion capacity associated to money (as energy) has achieved the maximum allowable value. We call this property Pantropy since it is the equivalent of entropy in conventional thermodynamics.
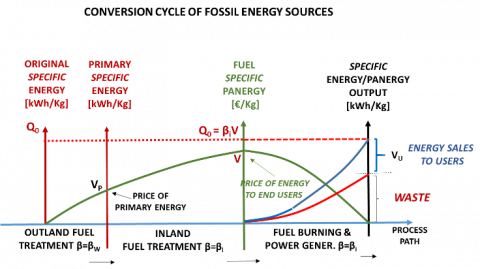
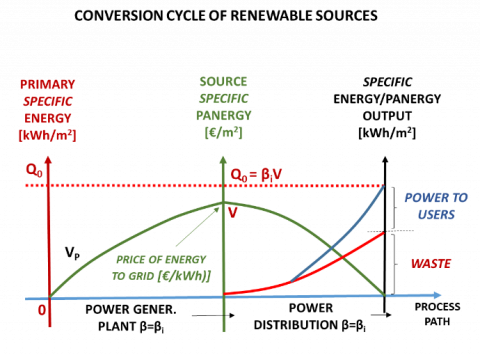
In order to understand how Panergy processes behave, another typical example is that of an energy source devoted to the production of usable power (Energy Vector). The diagrams of Figure 7 and 8, referred respectively to a fossil and to a renewable energy source describe the Panergy exchanges along the transformation, from origin to consumption.
All the above considerations lead to conclude, definitely, that monetary processes obey to the Laws of Thermodynamics. It could not be otherwise since we have demonstrated that money is a form of energy.
Figure 7. Panergy exchanges in a fossil energy source
Figure 8. Panergy exchanges in a renewable energy source
2.3 Panergy thermodynamics
Looking deeper is possible to draw out a comparison between the quantities and relationships employed in conventional thermodynamics and those referred to Panergy thermodynamics.
Table 1. Classical and Panergy thermodynamics
|
Feature |
Classical Thermodynamics |
Panergy Thermodynamics |
|
Medium |
Perfect Gas (per unit mass) |
Money (per community) |
|
Intensity index |
Abs. Temperature T[K] |
Market Price V[€] |
|
Energy content |
Internal Energy U[kWh] |
Embodied Panergy Q[kWh] |
|
Conversion factor |
Specific heat cp [kWh/K] |
Specific Panergy β [kWh/€] |
|
Decay rate |
Heat losses rate dU/U |
Degradation rate dQ/Q |
|
Irreversibility index |
Entropy $S=\int{\left( d({{c}_{p}}T)/T \right)\left[ kWh/K \right]}$ |
Pantropy $\sum =\int{\left( d(\beta V)/V \right)\left[ kWh/ €\right]}$ |
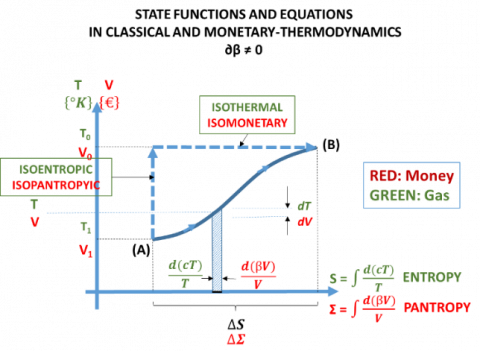
In a confined system, the monetary value behaves like a thermodynamic gas. The currency value V is equivalent to the absolute temperature T; Embodied Panergy Q is equivalent to the Internal Energy U; the conversion factor β corresponds to the Specific Heat at constant pressure. Even Entropy has an equivalent in Pantropy.
Figure 9. Equivalence of gas and currency thermodynamics
Figure 9. Gives an idea on how a monetary transformation could be represented in a typical functional thermodynamic diagram and how functions can be compared.
3.1 Evaluation of energy embodied in power systems
A frequent dilemma, for energy engineers, is to decide whether a power system will be capable to produce, in its active life, more energy than that occurred to build it up.
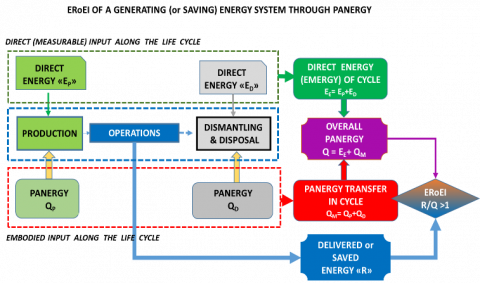
ERoEI (Energy Return on Energy Investment) is a significant index for energy and economy engineering. It is the ratio between the energy produced (or spared) all over the system life and that invested in its realization. Engineers, to face the problem, often evaluate the direct energy spent in every phase of the life cycle from fabrication to dismantling (Life Cycle Analysis). In this way, with difficult (and in many case impossible) evaluations they obtain the so-called Emergy [1] as measurement of the Embodied Energy. Emergy takes into account only the direct amount of energy embodied. Panergy is a more comprehensive tool and is easier to handle. The example of Figure 10 explains the difference of the two definitions.
Figure 10. Emergy and Panergy
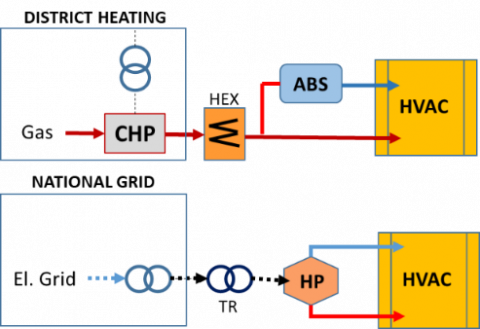
Figure 11, reports an example of application of the Panergy methodology in comparing two proposals of Air Conditioning systems for a large commercial building.
The example refers to a real case. The building needs an installed power of 2000 and 1800 kW, respectively for heating and cooling, to feed a centralized air conditioning system (HVAC).
The two alternatives are:
(1) Connection to an existing district heating grid, powered by a natural gas fired co-generator (CHP), and consisting of the use of district heat both for direct heating (through heat exchangers HEX) and LiBr Absorber Chillers (ABS) for cooling.
(2) Connection to the existing electric grid by Transformers (TR) and supply heating and cooling through Electric Heat Pumps (HP).
Results show that, under the operating conditions imposed by the available primary sources (district heating or Electric Supply), ERoEI values are very close, but environmental effects are quite different in terms of both non-renewable consumptions and CO2 emissions.
Figure 11. Comparison of two alternatives
Table 2. Parameters and results of the analysis
|
|
1 D.H.+ABS |
2 EL. HEAT PUMP |
|
SYSTEM PRICE including HVAC (€/kw) |
1400 |
1200 |
|
SYSTEM PANERGY _{toe/kW} [β=0.078*10-3toe/€] |
0.109 |
0.094 |
|
Season heating demand (toe/kW/y) |
0.039 |
0.039 |
|
Season cooling demand (toe/kW/y) |
0.037 |
0.037 |
|
Lifetime (y) |
25 |
25 |
|
(Non renewable Prim.Ener.)/ (Heating Supply) |
1.23 |
0.38 |
|
(Non renewable Prim.Ener.)/ (Cooling Supply) |
1.76 |
0.38 |
|
n.r. Prim. Panergy consum. Heating(toe/kW/y) |
0.048 |
0.014 |
|
n.r. Prim. Panergy consum. Cooling(toe/kW/y) |
0.065 |
0.014 |
|
RESULTS |
1 D.H.+ABS |
2 EL. HEAT PUMP |
|
ERoEL |
17.4 |
20.2 |
|
NON-REN.ENERGY USE (n.r.P.E./demand) |
1.487 |
0.381 |
|
SPECIFIC EMISSION (tCO2/kW/y) |
0.24 |
0.06 |
3.2 National economy and monetary policy
Is interesting to observe that inside a non-homogeneous socio-economic community where partners use a common currency, the real (energetic) monetary value, is different among the various subjects, especially if they have different economy trends. Single real values are often quite different from the community official currency unit assumed as common exchange tool. That is true, in particular, for the Countries of the European Monetary Union (EMU) which use EURO (€) as common currency unit. Table 3 shows the differences among four EMU countries calculated according to the Panergy method, based on official data and referred to the year 2016. The real exchange value (in kWh) is reported in the last column.
Table 3 puts in evidence the differences developed in 16 years (since the Maastrich deal) in the different communities despite the efforts of the EU Commission to maintain stable the monetary system.
To have monetary stability, real values must not differ too much from the official one (last line of the table). In fact, the UE monetary policy imposes Countries to comply some vital parameters in their annual budgets and to plan appropriate actions in their multi-annual economic forecasts (Fiscal Compact and Maastricht parameters).
Table 3. Real currency value among several EMU countries
|
|
Popul N {10b} |
GDP {109 €2016} |
B {109 kWh} |
F+D {109 €2016} |
TPSE {109 kWh} |
TOTAO CONSUM. (Panergy) Q [TPES+B] {109kWh} |
GROS DOMESTIC EXPENDIT V [GDP+F+D] 109 €2016 |
INLAND SPECIFIC PANERGY β[Q/C] {kWh/€2016} |
RELATIVE CURREN VALUE [β1/β0] |
Th.Dy. CURRENCY VALUE V€ [β1E] (kWh) |
|
Italy |
60.7 |
1671.6 |
56.40 |
39.28 |
1756.1 |
1812.40 |
1710.86 |
1.059 |
0.839 |
0.888 |
|
France |
66.9 |
2243.0 |
62.22 |
73.05 |
2841.2 |
2903.43 |
2316.03 |
1.253 |
0.993 |
1.244 |
|
Germany |
82.3 |
3130.1 |
76.65 |
3.65 |
3606.5 |
3682.51 |
3133.16 |
1.175 |
0.931 |
1.094 |
|
Spain |
46.5 |
1124.0 |
42.10 |
31.49 |
1393.3 |
1435.37 |
1155.49 |
1.242 |
0.984 |
1.222 |
|
UEM |
341 |
10728 |
317.3 |
193.5 |
13467 |
13784.8 |
10921.9 |
1.262* |
1 |
1.262 |
(*) EURO Panergy (energy currency) in 2016: 1€2016=1.262kwh (**) Data from: EUROSTAT and IEA-WEO 2018
Energetic currency values lower than the official one (last row) mean less purchasing power compared to the average (you can buy and embody less primary energy per currency unit).
Employing Thermodynamic methodologies can help to evaluate the critical economic parameters year-by-year and nation by nation in order to set up appropriate corrections to the economy trend. Just to have an idea on how that could be done, Figure 12 suggests, for a Country where β is less than average, a possible economic and monetary strategy based on Thermodynamic Panergy.
The title of this chapter probably will be considered as utopia or science fiction and that could be true, but let us leave our fantasy free.
Imagine a global currency based on its energy content. It will not suffer inflation, no devaluation, no exchanges based speculation,
“You will say I’m a dreamer but (hope) I am not the only one” [J. Lennon – Imagine].
The Theory of Panergy states that, to objects that have undergone human manipulation, and to each human activity, completed or in progress, correspond an incorporated energy content (Panergy). Part of it (Emergy) can be measured directly during production processes; another part is conferred indirectly through interactions with activities related to the processes themselves. This remaining part can be measured only through the economic value (expressed in energy units) of these interactions. The expansion of the Theory, reported in this work, explains that Panergy can be transformed into money and money is a form of energy storage. When money is spent, Panergy is transferred to the actors of human activities and generate new (less) fresh money and waste energy that can no longer be transformed. That is a classical Thermodynamic behaviour. Therefore, we can conclude that the deployment of the theory of Panergy demonstrates the behavioural equivalence of money and energy. Consequences are:
Money is a form of energy then currency can be measured in energy units.
Monetary processes can be described by thermodynamics like equations.
Thermodynamic equations, transposed on money, are suitable to be used to describe many economic processes.
|
B D ERoEI F GDP P Q S t V |
Agri-food supply/consumption, kWh Budget Deficit, € Ener. Return on Ener.Invest., fraction Financial charge, € Gross Domestic Product, € Product/expenditure of a community, € Total Energy supply/consumption, kWh Primary Energy Supply, kWh Time, y Economic Value/Panergy, € |
|
Greek symbols |
|
|
b |
Specific Panergy, kWh/€ |
|
Σ |
Pantropy or Monetary entropy, kWh/€ |
|
Subscripts |
|
|
isoΣ |
Constant Pantropy |
|
isoV n B T 0 I w |
Constant Economic Value Number of years Business Target Initial Value Inland value Outland value |
[1] Odum HT. (1996). Environmental accounting: Emergy and environmental decision making. John Whiley, New York 370. https://doi.org/10.2307/1127803
[2] Avanzini P. (2008). Assessment of Power Generation Systems through a Novel Tool: Panergy. II Congr. Naz. AIGE - Pisa 4, 5 settembre.
[3] Avanzini P. (2009). Valutazione comparativa delle tecnologie di generazione elettrica oggi ed in prospettiva con il metodo della Panergia. III Congr. Naz. AIGE - Parma 4, 5 giugno.
[4] Avanzini P. (2010). Power generation technologies assessment with an economic empirical approach: Panergy. 33rd IAEE int. l Conference – paper 22 – Rio de Janeiro – Brazil 6: 6-9.
[5] Avanzini P. (2009). Assessment of power generation systems through a novel tool: Panergy. Int. Journal of Heath and Tecn 27(1): 157-161. https://doi.org/10.18280/ijht.270122
[6] Claudio Bertoli Editor. (2010). CNR DET – Current Status and Future Trends of Scientific Research 2nd Edition 4: 3-30.
[7] Avanzini P. (2011). Aggiornamento degli scenari energetici e della valutazione delle tecnologie a fine 2010. – V Congr. Naz. AIGE Modena 8, 9 Giugno.
[8] ENEA. (2017). Efficienza Energetica. Rapporto Annuale – RAEE.
[9] IEA. (2018). – Key World Energy Statistics.
[10] EUROSTAT. (2018). databasehttps://ec.europa.eu/eurostat/data/database.