OPEN ACCESS
The paper studies crude oil fouling in a heat exchanger. A new procedure based on the computational fluid dynamics technique (CFD) is used. In particular, tubes with inserts are compared with plain tubes in order to investigate fouling generation in these specific devices. The inserts considered are static mixers called twisted tape, used as a heat transfer enhancement passive technique. The kind of fouling studied is that promoted by the chemical reactions of asphaltene and salt, essential components of crude oil. To describe the chemical reaction fouling phenomena, and appreciate the dependence on time, a species transport model and a multicomponent approach for a binary diffusion coefficient are used in order to simulate the mixing and transport of chemical species.
The main aim of this work is to simulate the crude oil flow inside tubes in which chemical reactions occur and determine important parameters such as rate and resistance to fouling, and so to appreciate the reduction of fouling when twisted tape inserts are used.
CFD analysis, crude oil, fouling, heat exchanger, twisted tape
A heat exchanger is a device used to transfer thermal energy between two fluids with different temperatures. Shell, tube and air coolers are each provided with tubes in which fluids flow. In air coolers, a fluid flows inside tubes that are cooled externally by air introduced by fans. A simple and cheap way to enhance the heat exchange and the performance of the heat exchangers is to use passive techniques, such as mechanical inserts inside tubes. There are different kinds of inserts, each one is suited to specific flow conditions. In deep laminar flow, the most suitable device is the twisted tape: a metal tape, with helical form, creating a secondary swirl motion and enhancing the heat transfer coefficient value [1]. Its role in terms of heat transfer is known but it is not clear whether by using twisted tape and crude oil as a process fluid, fouling increases or decreases, compared with the case where it is absent.
Fouling is an accumulation of undesirable material on the heat exchanger surfaces and this phenomenon is determined by a set of complex events so there are different kinds of fouling to consider: precipitation, crystallization fouling, particulate fouling, chemical reaction fouling, corrosion fouling, biological fouling and freezing fouling. The presence of these deposits represents a resistance to the heat transfer and, therefore, it involves a reduction in the efficiency of the specific heat exchanger [2, 3].
The role of some crude oil components such as asphaltene and salt deposition is ambiguous. Ebert and Panchal introduced the ‘‘threshold fouling’’ concept, which provides a semi-empirical basis for the interpretation of fouling data in terms of deposition and suppression mechanisms. Threshold condition is the boundary between fouling and no-fouling zones, expressed in terms of temperature [4].
A number of threshold fouling models have been developed based on the Ebert and Panchal model, but studies with the CFD approach suffer from a lack of systematic strategy for modelling crude oil fouling in industrial shell-and-tube heat exchangers.
The Research Institute of Petroleum Industry (RIPI) and Department of Chemical Engineering of Iran University of Science and Technology proposed a work that includes lumped-reactions for asphaltene and salt components through the species transport model and the use of appropriate molecular diffusion coefficients to predict fouling behaviour in crude pre-heaters using the CFD technique [5]. This model has been used adapting to a geometry that also includes the insert in a 3D mesh.
The importance of investigating fouling is tied also to the possibility of reduction of costs. There are many cost factors tied to the presence of undesired particles on the heat transfer surface and it arises considering the additional fuel required for the furnaces, production loss during unpredictable shutdowns, off-line and on-line cleaning devices and also environmental penalties [2]. Another important cost is due to the need for excess surface area: on average around 35 %.
No attention was paid to the heat exchangers fouling and the associated inefficiencies of heat exchangers operation till the so-called “oil crisis” of the 1970s, when it became necessary to make the use of available energy efficient. Heat exchangers fouling, of course, reduces the possibility of heat recovery so that means higher primary energy demands. Since the oil crisis there has been a modest interest in obtaining knowledge regarding all aspects of heat exchangers fouling, but the investment is nowhere near as large as in the field of heat transfer as a whole [2].
The fouling problem inside heat exchangers tubes is dealt with the CFD technique. In particular, simple tubes are compared with tubes provided with twisted tape inserts.
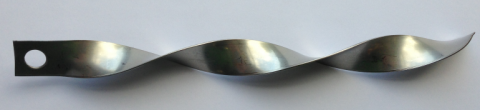
Numerical simulations with 2D computational domain permits reduction in the CPU time, but it could be adopted for axialsymmetric geometry only: this is the case of plain tubes (Figure 1). On the other hand, for tubes provided with twisted tape it is necessary to use 3D grids to represent the insert complex shape. Twisted tapes are static mixers produced from a length of metal tape that is twisted to obtain a regular helical profile using a suitable machine tool. At the beginning of the tape a hole is drilled, which is used to block the insert to the turbulator, in order to prevent it from being dragged away from the tube by the fluid.
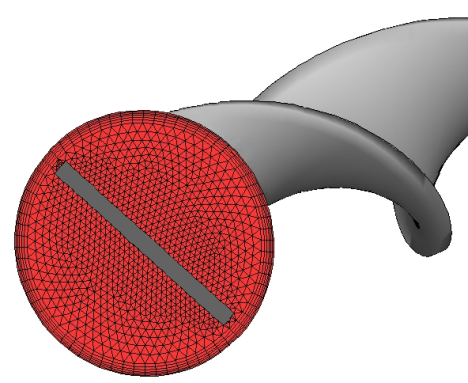
Their configuration permits removal from the tubes during the cleaning of tube bundles, then twisted tape inserts can be cleaned and reinserted. Figure 2 shows a typical twisted tape used inside heat exchangers tubes to promote heat transfer by increasing the value of the heat transfer coefficient. Figure 3 shows the 3D mesh used to discretize the computational domain. The mesh shown refers to a section of the tube, but it is repeated in the same way also in all the other sections. It is a hybrid unstructured mesh: at the wall it is quadrangular, while inside it is triangular.
Figure 1. 2D mesh
Figure 2. Example of twisted tape [1]
Figure 3. 3D mesh
Table 1 shows the geometrical characteristics of the pipe and twisted tape used for the simulations.
The short length compared with the total length of the tubes is justified for a simple fouling study because this could be a limit only to prediction of the pressure profile along the exchanger.
Table 1. Pipe and twisted tape geometrical characteristics
|
Tube |
Twisted Tape |
|
|
Diameter [mm] |
19.05 |
13.5 |
|
Thickness[mm] |
1.651 |
1 |
|
Length [mm] |
500 |
500 |
|
Twist ratio |
- |
8 |
In a computational fluid dynamics study it is important to define the method of solving the differential equations that govern the flow. The solver uses the finite volume method with a pressure based approach, since the working fluid is crude oil and it is, therefore, incompressible.
The spatial discretization is represented by a second order upwind scheme and the magnitude gradients are calculated using Green-Gauss Cell-Based scheme.
In the development of a fouling study, the greatest importance is given to the fluid flowing inside the tubes. In this case, crude oil is assumed to be composed of three pseudo-components: petroleum, asphaltene and bulk salt (saltb).
It is known that the thermo-physical properties of different crude oils vary widely. In addition, their temperature dependencies and reactivity, strongly determined by their composition, can differ noticeably. Table 2 shows the thermo-physical properties of petroleum and other pseudo-components at the initial temperature of 319 K, calculated thanks to correlations provided in previous works [5], based on the laboratory data available in the Tehran oil refinery [5]. Other components are neglected because of their minor role in crude oil fouling behaviour in terms mainly of density, thermal conductivity and heat capacity. Properties are provided not only for the principal components of crude oil but also for reactions products that cause fouling on the heat transfer surfaces.
Table 2. Thermo-physical properties of petroleum and other pseudo-components [5]
|
Density [kg m-3] |
Viscosity [kg m-1 s-1] |
Thermal conductivity [W m-1 K-1] |
Heat capacity [J kg-1 K-1] |
|
|
Petroleum |
752.11 |
0.005 |
0.115185 |
2999.65 |
|
Asphaltene |
850 |
0.006 |
0.123 |
1500 |
|
Coke |
900 |
150 |
1.5 |
1500 |
|
Saltb |
850 |
0.006 |
0.123 |
1500 |
|
Saltw |
900 |
180 |
1.5 |
1500 |
To initialize the problem, a value of mass flow rate of crude oil, at the inlet, of 0.041 kg/s and a constant temperature of 319 K were assigned. The mass fraction of the different species, in particular for fouling precursors, are:
- 0.02 for asphaltene;
- 0.97 for petroleum;
- 0.01 for saltb.
The outlet fluid temperature for the half-meter long pipe is 320.6 K.
It is important to evaluate the Reynolds number in order to characterize the flow field. It is about 100, which means the fluid flow is deep laminar. The boundary condition at the outlet section is outflow because information about pressure and velocity at the outlet section are unknown.
3.1 Governing equations
The governing equations of fluid flow represent mathematical statements of the conservation laws of physics:
The mass of a fluid is conserved.
The rate of change of momentum equals the sum of the forces on a fluid particle (Newton’s second law).
The rate of energy is equal to the sum of the rate of heat addition to and the rate of work done on a fluid particle (first law of thermodynamics).
For incompressible flows the Navier-Stokes system can be implemented using the following equation:
$\frac{\partial \rho \,\Phi }{\partial \,t}+\nabla \cdot \left( \rho \,\Phi \,\vec{v} \right)=\nabla \cdot {{\Gamma }_{\Phi }}\nabla \Phi +{{S}_{\Phi }}$ (1)
It represents the general transport equation for property Φ. By substituting Φ with 1, u, v, w, and the total energy E, it can be obtained mass, momentum and energy conservation respectively. Φ represents a generic scalar quantity, ΓΦ represents the general thermo-physic characteristics of the fluid; in particular, it is the viscosity μ for the continuity and momentum equations and the conductivity k for the energy equation. SΦ represents the source terms such as surface forces (pressure) on the control volume.
In addition to the equations described above, it is necessary to consider other phenomena to complete the problem resolution. In fact, even chemical reactions must be resolved to predict fouling in the heat exchanger, so species transport model is also implemented. The mixing and transport of chemical species are modeled using the CFD software, by the resolution of conservation equations relating to convection, diffusion, and reaction sources for each component species. In this case, the local mass fraction of each species Yi is obtained from the solution of a convection-diffusion equation for all the i-th species. In laminar flows, using Fick’s law for diffusion, the equation is [5]:
$\frac{\partial \left( \rho \,{{Y}_{i}} \right)}{\partial \,t}+\nabla \cdot \left( \rho \,\vec{v}\,{{Y}_{i}} \right)=\nabla \cdot \rho \,{{D}_{i}}\nabla {{Y}_{i}}-{{r}_{i}}$ (2)
where Di is the mass diffusion coefficient and ri is the net reaction rate of species i. Taking into account this new equation, it is necessary to specify that in the energy equation, in the source term, the heat of chemical reaction is included; it is computed as follows [5]:
${{S}_{h}}=\sum\limits_{i}{\frac{h_{i}^{0}}{{{M}_{w,i}}}{{r}_{i}}}$ (3)
For this case of multicomponent mixing flow, the transport of enthalpy due to species diffusion that appears on the energy equation is another significant effect on the enthalpy field:
$\nabla \cdot \sum\limits_{i}{\rho \cdot {{h}_{i}}\,{{D}_{i}}}\,\nabla {{Y}_{i}}$ (4)
This term is important mainly if the number of Lewis, that represents the ratio of thermal diffusivity to mass diffusivity, for any species is far from unity.
3.2 CFD modeling of chemical fouling
The most important part of this study on fouling is based on previous works (carried on by Research Institute of Petroleum Industry and Department of Chemical Engineering, Iran University of Science and Technology), aiming to achieve fouling results in terms of mole fraction of species that create the undesired layer on the heat transfer surfaces.
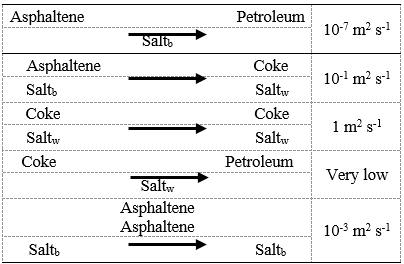
The strategy assumed for species molecular diffusion and their deposition on the wall is to consider different molecular diffusion coefficients and thermo-physical properties for different components in different situations. Generally, the asphaltene diffusion coefficient is in the range of 10-10 - 10-11 m2s-1, in this case it has been set to 10-7 m2 s-1. This assumption is due to particular conditions inside the pre-heater (such as high temperature, low viscosity flow of petroleum) that make asphaltene diffuse easier into petroleum.
Table 3 shows the molecular diffusion coefficient for other pairs of species [5] that combined describe the whole fouling mechanism with all its aspects.
Table 3. Molecular diffusion coefficients [5]
In addition, it is necessary to take into account fouling formation on the tube surface produced by the chemical reactions. The chemical reactions considered are:
2 asphaltene → coke
2 saltb → saltw
To determine the rate of species formation on the tube surface, Arrhenius rate equation was used. The reaction rates are [5]:
${{r}_{asph}}=8\times {{10}^{20}}{{e}^{-{2\,e\,8}/{RT}\;}}{{\left[ asph \right]}^{0.5}}$ (5)
${{r}_{saltb}}=1.2\times {{10}^{21}}{{e}^{-{2\,e\,8}/{RT}\;}}{{\left[ saltb \right]}^{0.5}}$ (6)
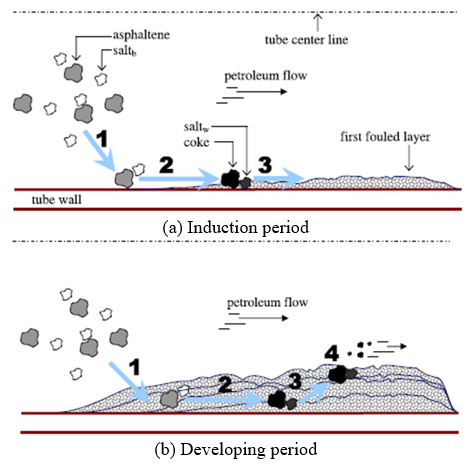
Hence, the first layer of fouling in the induction period is created by diffusion of crude oil species as asphaltene and saltb through petroleum, reactions of bulk species on the tube surface, adhesion of the reaction products to the tube wall.
(1). Then the continuation of fouling formation and thickening of the fouled layer in the developing period is equally described using other molecular diffusion coefficients (Table 3) and repeating what happens in the first stages [5]. In fact, it could be observed:
(2). Diffusion of bulk species through the fouled layer previously formed.
(3). New reactions of bulk species (asphaltene and saltb) on the tube surface.
(4). Fast diffusions of the reaction products (fouled species such as coke and saltw) through the fouled layer to leave the wall rapidly and make reactants reach it easily.
(5). Very low diffusion of fouled species (saltw and coke) through the petroleum so that they can increase the thickness of the fouled layer being unable to stay in the petroleum flow.
In Figure 4 all phenomena mentioned are described [5].
Figure 4. Conceptual procedure of fouling formation [5]
3.3 Calculation procedure for the fouling rate
Ebert and Panchal [4] proposed an important theory used to predict the fouling rate using an exponential expression with constant parameters that follows the experimental results with a high rate of accuracy:
$\frac{d{{R}_{f}}}{d\,t}=\alpha \,\,{{\operatorname{Re}}^{\beta }}\exp \left( \frac{-E}{R\,{{T}_{film}}} \right)-\gamma \,{{\tau }_{w}}$ (7)
The above equation was implemented on the software as a custom field function so that it could be used to provide simple results of temperature and shear stress, resulting by solving the default conservation laws, to plot its trend on the wall. In particular, the same constants indicated in the Ebert and Panchal theory were used, described in Table 4, except for the activation energy E. In fact, the Ebert and Panchal correlation uses a value of 69 kJ/kmol, but the reported activation energy for crudes, in the literature, are in the range of 20 and 55 kJ/mol and they include chemical reactions and physical processes. Ebert and Panchal paid more attention to physical processes that are less dependent on temperature, so they believe it is better to use a higher value. This work uses a medium value of 40 kJ/mol.
Table 4. Ebert & Panchal correlation’s constants [4]
|
α [m2K/kWh] |
30.2 ∙ 106 |
|
β |
-0.88 |
|
E [kJ/mol] |
68 |
|
γ [m2/N∙(m2K/kWh)] |
1.45∙10-4 |
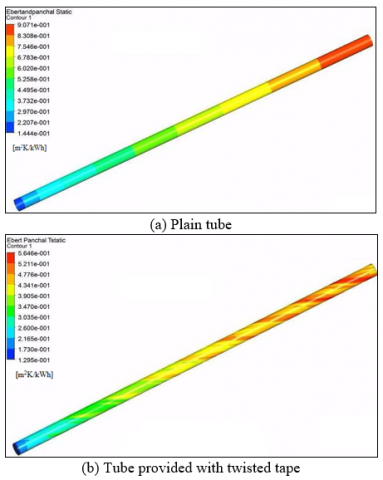
First considerations for fouling study are obtained by Ebert and Panchal correlation, it calculates fouling rate expressed in m2K/kWh. Figure 5 shows the contours of the fouling rate expressed with the Ebert and Panchal theory for a plain tube and tube provided with insert.
Figure 5. Contours of fouling rate expressed with the Ebert and Panchal theory
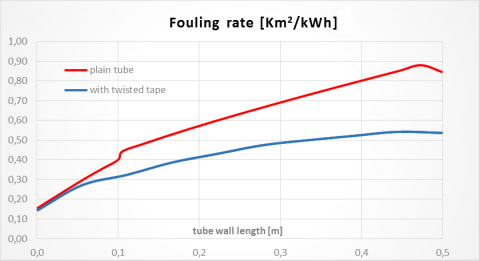
Figure 6 shows the fouling rate values along the tube wall for both cases examined.
Fouling rate increases along the tube wall, it can be observed that there is an increase in the fouling rate changing from a tube with inserts to one without inserts.
Other important results are gained by means of the chemical fouling model: after all equations were set and the phenomena largely described previously, attention was paid to time parameters to make the transient simulations start.
A time step of 0.1 seconds was used and the residuals of velocity components were considered to be 10-7 in order to obtain convergence.
The converged non-reactive case was used as a starting point for the solution of the species balance equations in the reactive case.
Resolution of species transport equations permits the computation and knowledge of the concentration of reaction products, mainly responsible of fouling in the heat exchangers.
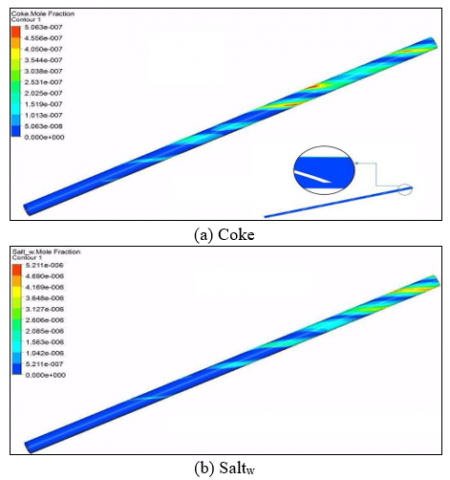
Figure 7 shows the coke and saltw mole fraction, at a fixed time of 60 seconds, in the tube provided with insert.
Figure 6. Fouling rate along the tube wall for both cases examined
Figure 7. Contours of mole fraction
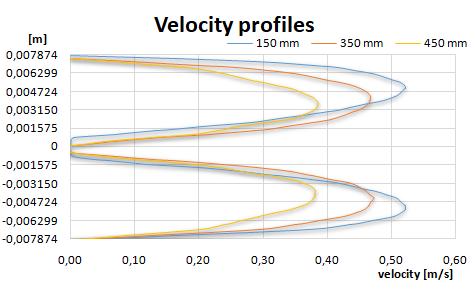
Figure 8. Velocity profiles at different sections of the tube
The coke and saltw mole fractions follow the same trend, in both cases fouling increases along the tube wall reaching the outlet section, and along the cross-section starting from the wall up to the axis.
While velocity is lower near the wall, fouling increases. Velocity and fouling influence each other because higher velocities reduce fouling formation permitting the flow to transport particles, but on the other hand, fouling thickness reduces the cross-section and the velocity grows.
Figure 8 shows the velocity profiles for different sections of the tube, the velocity reduction in the outlet section can be appreciated.
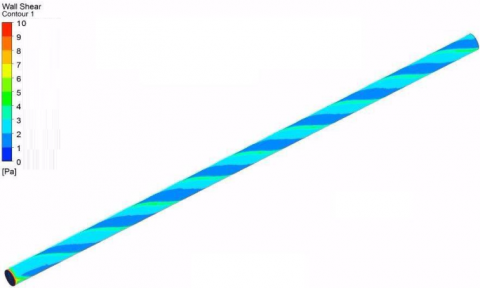
Another important parameter, already found in the Ebert and Panchal theory, is shear stress (Figure 9); it influences the fouling and it is higher in the inlet section and lower in outlet, this is the reason why fouling increases near the end of the tube.
Figure 9. Contour of shear stress along the tube
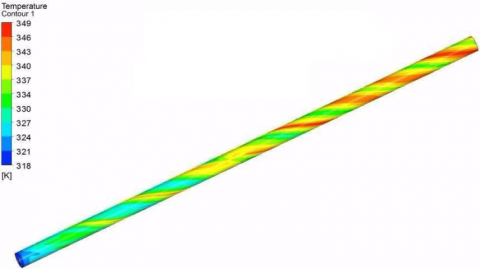
Higher temperature promotes fouling formation so this is another cause of the presence of major deposits through the outlet section (Figure 10).
Figure 10. Contour of temperature along the tube
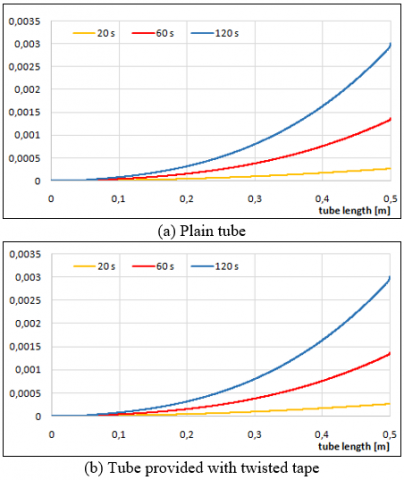
Figure 11. Saltw mole fraction for different time steps
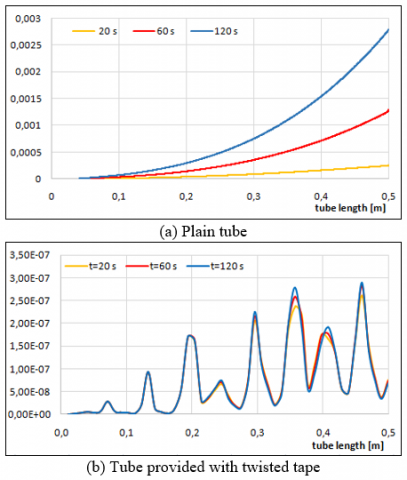
Figure 12. Coke mole fraction for different time steps
The aim of this work is to investigate fouling in two different cases and find out what is the best situation. Using a chemical reactions model to plot the mole fraction of reaction products as saltw (Figure 11) and coke (Figure 12) is a simple way to show fouling formation and to compare a plain tube and a tube provided with twisted tape.
The mole fraction is higher in both cases in the absence of twisted tape and it grows with time and along the tube wall. There are other ways to test the reduction of fouling in the presence of twisted tape according to the mechanisms of deposition of flocculated asphaltene particles studied by M. Jamialahmadi et al. [3].
When a clean fluid flows over a hot surface at constant flow rate, bulk temperature and heat flux fixed on 319 K and 5000 W/m2 respectively, there will be a temperature drop which develops between the hot surface and the bulk of the flowing fluid. In this case, the thermal resistance against heat transfer is due to the laminar sublayer adjacent to the surface, and the heat transfer coefficient between surface and fluid is defined as:
${{\alpha}_{0}}=\frac{{\dot{q}}}{T_{s}^{0}-{{T}_{b}}}$ (8)
From Eq. (8) it can be understood that as long as flow rate, bulk temperature and heat flux are kept constant and no deposit is formed on the surface, the heat transfer coefficient
will also remain constant. However, asphaltene and reactions products particles depositing on the surface act as an additional thermal resistance to heat transfer. If the heat flux is maintained constant, the heat transfer coefficient decreases with time and, as a consequence, the surface temperature Ts rises. Thus for a surface with deposits the heat transfer coefficient between the surface and the fluid becomes [3]:${{\alpha}_{t}}=\frac{{\dot{q}}}{T_{s}^{t}-{{T}_{b}}}$(9)
The thermal resistance of the fouling layer formed on the surface is equal to:
$R_{f}^{t}=\frac{1}{{{\alpha }_{t}}}-\frac{1}{{{\alpha }_{0}}}$ (10)
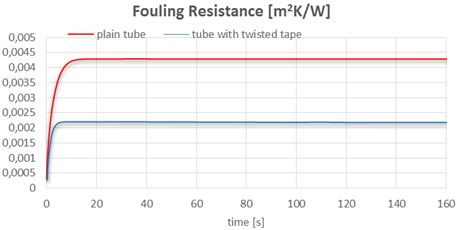
The software calculates the surface heat transfer coefficient in this way so it is easy to plot the fouling resistance expressed in m2K/W, for both cases examined and evaluate where fouling causes major problems (Figure 13).
Figure 13. Fouling resistances for plain tube and tube with twisted tape
Fouling resistance increases with time because the conditions make deposits and particles thickness grow on the tube wall, and it will continue to increase reaching higher values for longer periods.
The choice to use these inserts allows higher thermal performances to be gained coupled with fouling reduction and they are important advantages to consider in heat exchangers applications.
The paper analyses the formation and growth of crude oil fouling inside heat exchangers tubes by means of computational fluid dynamics. The aim was to demonstrate, by calculating specific parameters, whether fouling development was helped or stopped by the use of twisted tapes. Twisted tapes are mechanical inserts plugged into shell-and–tube and air cooled heat exchangers (tube side), in order to improve thermal performances by the enhancement of the heat transfer coefficient and generation of a secondary swirl flow. Owing to their specific construction a 3D mesh was used, while the plain tube was studied easily with a 2D mesh. Despite this difference, the comparison of results was satisfactory.
There are different kinds of fouling and therefore, before applying a specific model, the results of a simple thermo-hydraulic analysis were used to plot the Ebert and Panchal correlation, one of the most important theories to predict fouling threshold using crude oil as a processing fluid. This first comparison already shows the higher fouling rate in the absence of twisted tapes but other models were used to verify this concept.
Crude oil components are responsible for chemical reactions, whose products create fouling. They happen on the tube wall, so the fouling layer begins to appear near the wall and its thickness grows with time.
Previous works experimented these aspects of fouling using species transport model, which allows results in terms of products concentration and their distribution on the wall to be obtained. It is important to note the higher values of coke and saltw concentration for the plain tube rather than the tube with twisted tape, and, looking at their trend, fouling deposits can be observed along tube wall and in a greater amount near the outlet section.
Another important parameter was determined to compare fouling in different situations: fouling resistance. It was determined using the total heat transfer coefficient and subtracting from it the value obtained in the absence of fouling, which corresponds to the initial value measured. In this case, for the brief time analyzed, the fouling resistance in the plain tube is twice that compared with the situation in the presence of twisted tapes.
Considering all the parameters employed, it can be stated that fouling phenomena are reduced using twisted tapes in tubular heat exchangers with crude oil in laminar regime and it is another advantage provided by this cheap and useful insert, widely used in industrial applications.
|
D |
mass diffusion coefficient, m2. s-1 |
|
h |
enthalpy, J. kg-1 |
|
h0 |
enthalpy formation, J. mol-1 |
|
k |
fluid thermal conductivity, W. m-1. K-1 |
|
$\dot{m}$ |
mass flow rate, kg. s-1 |
|
Mw |
molecular weight, kg. mol-1 |
|
$\dot{q}$ |
heat flux, W. m-2 |
|
R |
gas constant, J. mol-1. K-1 |
|
r |
net reaction rate, kg. m-3. s-1 |
|
Re |
Reynolds number |
|
Rf |
fouling resistance, m2. K. W-1 |
|
Sh |
heat of chemical reaction, W. m-3 |
|
T |
temperature, K |
|
Tfilm |
film temperature, K |
|
t |
time instant, s |
|
u |
velocity in the x direction, m. s-1 |
|
v |
velocity in the y direction, m. s-1 |
|
$\vec{v}$ |
velocity vector, m. s-1 |
|
w |
velocity in the z direction, m. s-1 |
|
Y |
local mass fraction |
|
Greek symbols |
|
|
α, β, γ α |
Ebert-Panchal constants heat transfer coefficient, W. m-2. K-1 |
|
µ |
dynamic viscosity, kg. m-1.s-1 |
|
ρ |
fluid density, kg. m-3 |
|
τ |
shear stress, N. m-2 |
|
Subscripts |
|
|
asph |
asphaltene |
|
b |
bulk |
|
i |
chemical species |
|
s |
surface |
|
saltb |
saltb |
|
t |
time instant, with fouling |
|
w |
wall |
|
0 |
initial time instant, without fouling |
|
Apexes |
|
|
t |
time instant, with fouling |
|
0 |
initial time instant, without fouling |
[1] Kaliakatsos D, Cucumo M, Ferraro V, Mele M, Galloro A, Accorinti F. (2016). CFD analysis of a pipe equipped with twisted tape. International Journal of Heat and Technology 34(2): 172-180. https://doi.org/10.18280/ijht.340203
[2] Bott TR. (1995). Fouling of heat exchangers.
[3] Jamialahmadi M, Soltani B, Muller-Steinhagen H, Rashtchian D. (2009). Measurement and prediction of the rate of deposition of flocculated asphaltene particles from oil. International Journal of Heat and Mass Transfer 52(119): 4624-4634. https://doi.org/10.1016/j.ijheatmasstransfer.2009.01.049
[4] Ebert W, Panchal CB. (1995). Analysis of Exxon crude-oil-slip stream coking data. Fouling mitigation of industrial heat exchangers. San Luis Ebispo, CA (United States).
[5] Bayat M, Aminian J, Bazmi M, Shahhosseini S, Sharifi K. (2012). CFD modeling of fouling in crude oil pre-heaters. Energy Conversion and Management 64: 344-350. https://doi.org/10.1016/j.enconman.2012.05.003