OPEN ACCESS
To mitigate the impact of climate change, building designers have to mature novel strategies to mitigate the well-known urban heat island (UHI) effect. Built surfaces, often characterized by low albedo coefficients, absorb and store solar energy during the daytime, then they discharge such stored thermal energy to the surrounding during both day and night. Cooling the urbanized areas and so protecting them from the more and more frequent heat waves is one of the challenges that policy and governments have to tackle.
This paper aims to identify the effectiveness of cool and green surfaces as strategies for diminishing the outdoor air temperature and enhancing the urban well-being conditions. To this purpose, a micro-scale analysis, based on a simulation study, was carried out in a neighborhood of Catania city.
Several mitigation solutions were modeled and simulated though a holistic three-dimensional non hydrostatic model with the aim of assessing their effectiveness. Moreover, surveys and measurements in situ are used to calibrate and validate the model results.
The outcomes display that the cool materials (roofs and pavements) allow to reduce by about 1.0°C the environmental temperatures during a reference hot summer’s day.
cool surfaces, green roof, outdoor comfort, PMV, ENVI-met
Recent studies have shown that heat waves become more frequent and last longer due to warming the climate with extremely high heat stresses for urban residents [1].
The number and intensity of heat episodes show an increasing trend that, in extreme cases, can lead to heat-related illness and even death [2-3]. Future projections expect that the number of heat stress days to double across most parts of southern Europe by the 21st century. The most severe increases are projected in low‑altitude river basins and along the Mediterranean coasts where many densely populated urban centers are located [4]. Cities are particularly vulnerable to climate change. They accommodate the weakest sections of the population [5] and around three-quarters of the world population, a share which is expected to increase further [6]. The specific composition of urban areas in terms of people and activities as well as the urban design alters climate change impacts and exacerbates heat waves in cities due to the UHI effect [7-8]. The environmental temperature in urban areas is usually several degrees higher than that of their surrounding suburban and rural areas [9]. The increasing of temperatures in the urban
spaces compared to the surrounding rural or suburban areas is known as Urban Heat Island (UHI) [10].
The combination of global warming with the so-called UHI effects contribute to raising the cooling energy consumption even more in South Europe context makes the energy issue particularly concerning in Mediterranean area [11-13].
The high-density cities, the use of inappropriate construction materials, the elevated energy emission related to human activity, the lack of green areas contribute altogether to an increase of environmental temperature, leading to significant environmental impacts and to increment of energy consumptions [14]. In particular, the construction materials play a key role because they are good at modulating the air temperature in the lowest layers of the urban canopy layer [15]. The materials of road pavements, the claddings of facades and roofs of the buildings influence the absorption of solar radiation, the thermal radiation emission, the heat storage, and the evaporation processes [16]. Indeed, the construction materials are characterized by low albedo and thermal emittance [17-18].
Several mitigation strategies aimed at reducing urban warming such as reflective materials, green materials, actions on urban fabric are available. Specifically, the increase of albedo and plant cover allow significantly reducing the outdoor air temperature contributing to an improvement of air quality and reduction of energy consumptions [19].
The employment of computational fluid dynamics has contributed to the understanding of what interventions should be made in the Greek city of Florina in order to meet defined thermal related targets during the warmest day of the year. It was discovered that the replacement of conventional materials by “cool” ones can result in the reduction of the mean surface temperature by 3.52 °C while the mean maximum air temperature can be reduced by 1.39 °C during noon of the warmest day [20].
A study carried on passive cooling techniques (cool materials, green spaces, etc.) in a densely built and populated area have demonstrated that the proposed measures contribute to a decrease in local temperatures of up to 2.0 °C in summer days [21]. CFD simulations by means ENVI-met software carried on in the city of Teramo (Italy), have shown that all the roofs covered with reflectance paint (albedo of 0.9) and extensive greenery averagely reduce the outdoor air temperature of 0.5 °C and 1.2 °C than baseline scenario [22]. The analysis of several mitigation strategies such as green roofs, green park, cool roofs and cool pavements in an old densely populated neighborhood of Avola (Italy), have highlighted that cool pavements allow reducing the environmental air temperature of over 2.0 °C [23].
This study aims to evaluate the effectiveness of cool and green surfaces as strategies for enhancing the urban well-being conditions through a simulation carried out in a neighborhood of Catania city.
The selected area for this research is the area of the University Campus of Catania city. The choice was based on the importance of this neighborhood and as well as it is characterized by high population density and also urban density.
A computational thermo-fluid dynamics (CFD) analysis was carried out during a typical warm summer day.
Several mitigation solutions were modeled and simulated though ENVI-met software [24] with the aim of assessing their effectiveness. Moreover, surveys and measurement campaigns in situ carried out in order to calibrate and validate results. The measurements were conducted using an LSI-Lastem weather station (equipped with the air temperature sensor, black globe thermometric sensor, thermo-hygrometric sensor, and anemometer) which is installed on the roof of building n. 13 of the Department at the University of Catania of the University campus. To simulate the cooling potential of cool and green materials in the urban setting, a series of simulations were performed with the use of ENVI-met software by taking into account the existing situation of the urban compound.
After that, the simulations were implemented with the data of new proposed scenarios: I) cool surfaces and II) green surfaces.
In this study, outdoor air temperature (To) and Fanger Index (PMV) were considered as parameters for comparing the effectiveness of different proposal scenarios.
2.1 Experimental measurements
The weather station “LSI Lastem” is not only able to measure dry bulb temperature and relative humidity but also direct and diffuse solar radiation, wind speed and direction Indeed, it is equipped by the following sensors:
(1) wind speed and wind direction: measurement range = 0÷50 m s−1; threshold = 0.36 m s−1; uncertainty = 1 % below 3 m s−1 and 1.5 % above 3 m s−1; resolution = 0.06 m s−1;
(2) radiometer for solar irradiance: spectral response = 300-3000 nm; operative temperature = -40 °C / +80 °C; uncertainty = ± 4 W m-2 (according to ISO 9060).
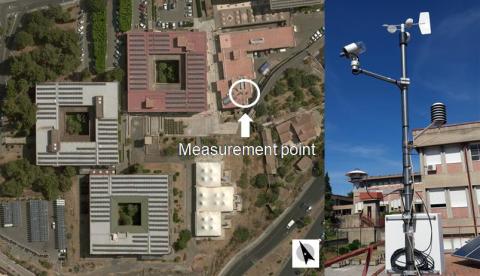
Figure 1 displays the investigated area of the University Campus and the site of Babuc – LSI Lastem weather station.
The data recorded with a sampling time of 1 minute from the 1st to the 24th of August 2015 were used to calibrate and validate the reference case study. To quantify the difference between measured and simulated data it was also calculated the Mean Absolute Error (MAE), the Root Mean Square Error (RMSE), and the correlation coefficient (R2).
Figure 1. a) View of the investigated area; b) LSI Lastem weather station
2.2 ENVI-met software for CFD simulations
ENVI-met is a prognostic fluid dynamics (CFD) software [25] based on model Navier-Stoke equations for wind flow, atmospheric flow turbulence equations, energy and momentum equation, and boundary condition parameters [26].
In addition, ENVI-met software allows to consider:
Shortwave and longwave radiation fluxes with respect to shading, reflection, and re-radiation from building systems and the vegetation;
Transpiration, evaporation, sensible and latent heat flux from the vegetation into the air including full simulation of all plant physical parameters;
Water and heat exchange inside the soil system.
2.3 Comfort indexes
Predicted Mean Vote (PMV) calculation scheme was developed by Fanger (1970) [27] on the basis of empirical laboratory comfort research in indoor environments, under steady-state conditions. Fanger’s indexes are implemented in many international standards [28] and, currently, their adoption is extended to evaluate the thermal comfort in external environments.
PMV index summarizes the impact of the four main atmospheric variables: Air Temperature, Radiative Temperature, Wind Speed and Humidity on the human thermal sensation. The values of the PMV index for the outdoor environment can overcome the international standard graduation adopted for indoor spaces. Thanks to ENVI-met software, it is possible to simulate firstly the microclimates’ data then estimated the Predicted Mean Vote (PMV) index considering human behavior, clothing parameters and body metabolism [29].
The reference case study is in Catania, a metropolitan city along the Mediterranean coast in Southern Italy (latitude 37°30’ North and longitude 15°04’ East).
According to the international Köppen-Geiger climate classification, Catania is characterized by a warm and temperate climate (Csa). This climatic region typified by warm and humid summers and moderately cool, wet winters. In the summer months, the average outdoor temperature ranges from 23 °C to 35 °C, with peaks of 39 °C when the hot winds blow from North Africa.
In this study, a selected area of University Campus in the neighborhood of “S. Sofia” was analyzed. It includes the buildings that host the classrooms and Departments offices (see Figure 1). Five buildings were considered, where three of them have significant sizes (35 × 35 m2).
The outer surfaces of buildings, pedestrian roads, pavements roads and other outdoor spaces are made by “standard” materials that absorb remarkable solar radiation during daytime contributing to release high heat flux.
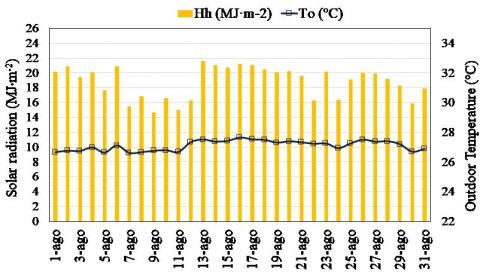
Figure 2 shows the mean daily solar radiation and air temperature measured by weather station “LSI Lastem” during the month of August 2015.
Figure 2. Daily solar radiation and outdoor air temperature recorded by the LSI Lastem station (August 2015)
3.1 The model simulation
For the model simulations, the area of interest has been transformed in a model grid cell, with the dimension 50 × 42 × 30 grids with a resolution of 4.0 m × 4.0 m × 2.0 m resulting in a total area of 200.0 × 168.0 m, in the horizontal extension (33,600 m2) and 100.0 m, in vertical extension. The grid had a fixed spacing at the x and y-axis while along z-axis a telescoping grid with an extension factor (s) of 10 % was adopted. The digital map data for the area was obtained by google earth but additional surveying took place to correct changes. ENVI-met uses its own graphics interface, therefore all cartographic information had to be gathered first on a digital map and then redrawn in ENVI-met‘s own graphics editor for the modeling language.
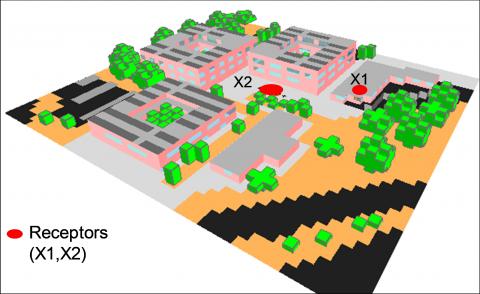
Two receptors have been placed in two different points. One is located on the roof of building n. 13 (X1) of University Campus where it is place placed the LSI Lastem weather station. The second receptor has been located on the pedestrian pavement (X2). In addition, the Fanger parameters are set up as follows: metabolic rate equal to 1.50 Met, clothing thermal insulation (clo) equal to 0.40.
The meteorological input of a year period (2015) recorded by the “Babuc-Lastem” climate station in the University Campus was used. For both the existing situation and the alternative scenarios, it was selected one of the hottest days of the summer of 2015 (23 of August) with mean temperature in 27 °C while the maximum is 32 °C. The wind direction is 162° with an average speed of 1.34 m·s-1. Simulations were performed from 12:00 on 22nd August to 12:00 on 24th August 2015. Figure 3 displays the 3D Model of the investigated area for the baseline scenario (BS).
Figure 3. 3D view of the model in the Baseline scenario (BS)
In figure 3 green color represents the vegetated area (trees or shrubs), black color represents paved area (road, parking, square), light brown represents unpaved area (ground, soil).
3.2 Baseline scenario
This study was developed using the tool, called “Database Manager”, which allows to edit an existing material or to create a new one for buildings, floors, soil, and other surfaces. The input data for each material are thickness, absorption coefficient, transmission, reflection (albedo), emissivity, heat capacity, thermal conductivity, and density. International literature sources were adopted for materials’ thermal properties [30]. As rule, a single value for the facades albedo was estimated based on the material predominance in the simulation area, aiming to simplify the model. Table 1 reports the values of albedo and emittance of buildings and urban surfaces adopted.
Five plant types were implemented: Tree 10.0 m height, dense foliage, leafless; Base grass, average density, 0.50 m tall; Conic, small trunk, sparse, medium 15 m; Cercis Sillisquastrum, 10.0 m height; Citrus Aurantium 4.0 m height All the plants are characterized by albedo values in the range 0.25-0.40.
Table 1. Thermal and optical properties of existing material
|
Urban components |
Albedo (ρ) |
Emittance (ε) |
|
Soil |
0.2 |
0.98 |
|
Pedestrian pavements |
0.3 |
0.85 |
|
Roads |
0.2 |
0.85 |
|
Square |
0.3 |
0.85 |
|
Building facades |
0.3 |
0.90 |
|
Building roofs |
0.3 |
0.90 |
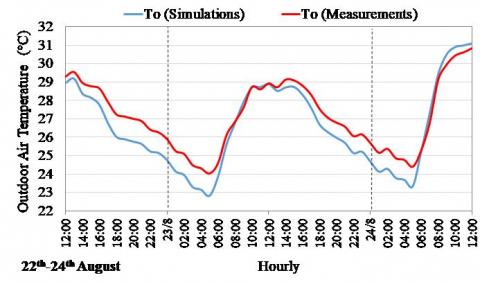
Figure 4 shows the hourly profiles of air temperature (To) obtained by simulations and measurements in receptor “X1” at height (z) of 5.41 m.
It can be noted an almost perfect coincidence of the trends of outdoor air temperature obtained by the simulations and experimental survey during the hours of maximum solar radiation (Figure 4).
Figure 4. Comparison between measurements and simulated air temperatures (receptor X1; z= 5.41 m)
Nevertheless, during the night, the temperatures simulated are around 1.0 °C lower compared with the measured ones. This could be due to an overestimation of the low long-wave radiation exchange with the sky because of low sky temperatures or high values of emittance of the outer layer of buildings surface. In addition to this, the model does not seem to be affected by the fraction of anthropogenic heat that plays actually contribute to climate microscale. Indeed, wind flows could move the heat from vehicular traffic of the ring road.
It can be seen that the MAE value was 0.756, the RMSE value was 0.844 and a correlation coefficient (R2) of 0.96 between the measured and computed data during the analyzed period was obtained. According these results, the model can be considered reliable.
The main goal here is the investigation of micro-climatic variations linked to modified parameters and their impact on building surfaces and pedestrian well-being. Two scenarios were proposed to improve outdoor environmental conditions of the investigated area: I) Cool scenario (CS); II) Green scenario (GS).
5.1 Cool scenario
Cool scenario (CS) consists in replacement of conventional materials with cool materials for pedestrian roads, pavements roads, and application of cool paint on the roofs of all buildings. The Cool materials are characterized by high albedo values and high emissivity values, which are able to reflect the solar radiation keeping the exposed surfaces cool [31]. The thermal and optical features of cool materials adopted are reported in table 2.
Table 2. Thermal and optical features for Cool Scenario (CS) (proposal conditions)
|
Urban components |
|
albedo (ρ) |
emittance(ε) |
|
Pedestrian pavements |
Cool pavement |
0.80 |
0.90 |
|
Roads |
0.80 |
0.90 |
|
|
Square |
0.80 |
0.90 |
|
|
Building roofs |
Cool roof |
0.80 |
0.90 |
In order to build a simulation of Cool scenario (Cs) in ENVI-met, the same input files of the Baseline Scenario have been employed, modifying only the Spaces Configuration File at the level of buildings and surfaces.
5.2 Green scenario
Green Scenario (GS) is based on the extensive use of vegetation consisting in the planting of an average density 30 cm height of grass plants in the bare ground of flowerbeds and on the roof of all buildings [32]. The green roof was modeled into the software by adding the package Greening roof “Vegetation plus Substrate” in the cell that represents top-roof. The substrate of the green roof is a thin layer of cultivated peat soil. The features of vegetation and substrate layer of the green roof are reported in Table 3 and 4 respectively.
Table 3. Features of the vegetation layer
|
Height |
H |
0.30 |
m |
|
Leaf Area Index |
LAI |
1.50 |
m2·m-2 |
|
Albedo |
ρ |
0.25 |
- |
|
Absorptance |
α |
0.60 |
- |
|
Transmissivity |
τ |
0.15 |
- |
|
Emittance |
ε |
0.95 |
- |
Table 4. Features of substrate layer
|
Height |
H |
0.15 |
m |
|
Albedo |
ρ |
0.30 |
- |
|
Absorptance |
α |
0.60 |
- |
|
Emittance |
ε |
0.95 |
- |
|
Thermal conductivity |
l |
1.00 |
W·m-1·K-1 |
|
Moisture content |
θsat |
0.50 |
m-3·m-3 |
6.1 Air temperature and PMV index
The numerical simulations were performed with the aim to predict the air temperature and PMV, and thus for evaluating the effects of the proposed retrofitting scenarios. The results of numerical simulations of outdoor microclimate in Baseline (BS), Cool (CS) and Green (GS) scenarios are compared and discussed in this section. All the simulations have been started on 22th August 2015 at 12.00 am and finished at the same hour on 24th August for an overall time of 48 h.
Figure 5 displays a horizontal view (x-y) of air temperature, wind speed and PMV index for the three scenarios at 1.5 m height above the ground level at 12:00 am on August 23th. In the Baseline scenario (BS), it is achieved air temperature value of 30.00 °C in a large part of the analyzed area. The highest values of air temperature are reached on waterproofed surfaces, such as pedestrian roads and pavements road. The minimum temperature value of 29.00 °C was recorded on land not built on. The PMV index has a minimum value of 1.92 and a maximum of 3.85.
The cool scenario (CS) shows external air temperature values between 28.12 °C and 29.00 °C. thanks to the application of cool materials. Above soil surfaces, the temperature is between 28.6 °C and 29.00 °C. The adoption of cool pavements and roofs allows to reduce the peaks, with a variation from 30.00 °C to 29.00 °C. Therefore, the peak of external air temperature decreases by about 1.0 - 1.2 °C. The PMV index has a small reduction in minimum value (1.86) and in maximum value (3.73).
Figure 5. Air temperature and PMV index on a horizontal plan (x-y) at z = 1.50 m and at 12.00 am on 23th August
Figure 6. Hourly temperature profile in X1 receptor at different heights from 12:00 am on 22th August to 12.00 am on 24th August
Figure 5c depicts the results related to the Green scenario (GS). In this scenario, the adding of plants and green roofs have milder effects on the outdoor air temperature on the pedestrian and road level. The maximum external air temperature value is 29.24 °C and the minimum external air temperature value is 28.41 °C. A decrease in the temperature values are recorded, but it is less effective compared to the
cool scenario (CS). The peak of air temperature is reduced by 0.89 °C than the baseline scenario.
However, it is worth highlighting that the cooling effect of vegetation is not limited to spaces where the plants were added but the plant is having an effect on all surrounding area. Indeed, the best results of PMV is reached in this scenario with minimum values of 1.67 and maximum values of 3.50.
6.2 Hourly temperature profile
The hourly temperature profile was plotted and analyzed for different receptors varying height above the ground. The trends were draw using temperatures output by the software. The temperatures are related to the receptor X2. Figure 6 shows the air temperature profile of the Baseline (BS), Cool (CS) and Green (GS) scenarios at a height of 1.00, 10.75, 20.92 and 29.52 m, respectively.
It is worth to be noticed that during the early hours of the morning, the air temperature is cooler, and increases during the day, from 7:00 am to 12:00 am. The maximum air temperature occurs at around 12.00 am whereas the minimum values are at 6.00 am for all heights.
It can be noticed how the temperatures values decrease during maximum solar radiation in the case of (CS) and (GS) scenarios while they are almost the same during afternoon hours and nighttime. As the height increases, the beneficial effects of Cool and Green scenario are reduced. The results highlight that the proposed alternatives contribute to the improvement of microclimate well-being at the pedestrian level.
This paper aims to identify the effectiveness of cool and green surfaces as strategies for the improvement of the urban micro-climate well-being conditions. To this purpose, a macro-scale analysis, based on a numerical model, was carried out in a neighborhood of Catania city by means ENVI-met software. The influence of extensive vegetation and materials with high albedo were evaluated in two scenarios, Cool (CS) and Green (GS).
The outcomes of the simulations performed in this context confirm the previous research: the increase of the environment air temperatures is significantly influenced by the optical and thermal properties of buildings and urban surfaces.
The numerical simulations have shown that the best solution for the reduction of external air temperature is guaranteed by the adoption of cool material because it can lead to lowering of temperature by about 1.20 °C in the peak.
Besides, the green roof offers better micro-climate wellbeing condition with a significant reduction of PMV index.
In any case, the new scenarios show a maximum cooling effect during the daytime at the pedestrian level.
The findings reveal that the adoption of green and cool materials in the urban context plays a significant role in enhancing the external air temperature and in mitigating urban warming. For this reason, the study can be potentially useful for promoting a sustainable design approach in the Mediterranean area.
This work has been financed by the University of Catania within the project “Piano della Ricerca Dipartimentale 2016-2018” of the “Civil Engineering and Architecture Department" and Electrical Electronic and Computer Engineering Department”
|
H |
Height, m |
|
LAI |
Leaf area index |
|
PMV |
Predicted mean vote, - |
|
s |
Extension factor, % |
|
T |
Air temperature, °C |
|
z |
Altitude, m |
|
w |
Wind speed, m·s-1 |
|
Greek symbols |
|
|
α |
Absorption |
|
ρ |
Albedo |
|
ε |
Emissivity |
|
l |
Thermal conductivity, W·m-1·K-1 |
|
θ |
Moisture content, m-3·m-3 |
|
τ |
Transmissivity, - |
|
Subscripts |
|
|
o |
Outdoor |
|
sat |
Saturation |
[1] Li D, Boud-Zeid E. (2013). Synergistic interactions between urban heat islands and heat waves: the impact in cities is larger than the sum of its parts. Journal of applied Meteorology and Climatology 52: 2051-2064. https://doi.org/10.1175/JAMC-D-13-02.1
[2] Department of Health. (2015). Heatwave Plan for England– Making the Case: the impact of heat on health – now and in the future. 2015 Edition: 1-21. Available: https://www.england.nhs.uk/2015/06/2015-heatwave-plan/
[3] Macintyre HL, Heaviside C, Taylor J, Picetti R, Symonds P, Cai XM, Vardoulakis S. (2018). Assessing urban population vulnerability and environmental risks across an urban area during heatwaves – Implications for health protection. Science of the Total Environment 610: 678-690. https://doi.org/10.1016/j.scito-tenv.2017.08.062
[4] Fischer E, Shär C. (2010). Consistent geographical patterns of changes in high-impact European heatwaves. Nature Geoscience 3: 398-403. https://doi.org/10.1038/NGEO866
[5] Morabito M, Crisci A, Gioli B, Gualtieri G, Toscano P, Stefano VD, Orlandini S, Gensini GF. (2015). Urban-hazard risk analysis: Mapping of heat-related risks in the elderly in major Italian cities. PLoS ONE 10(5). https://doi.org/10.1371/journal.pone.0127277
[6] UN (2014). World Urbanization Prospects, the 2014 Revision. Population Division of the Department of Economic and Social Affairs of the United Nations. Available: http://esa.un.org/unpd/wup/index.htm.
[7] Füssel, HM, Jol A, Kurnik B, Hemming D. (2012). Climate change, impacts and vulnerability in europe 2012: an indicator-based report. European Environment Agency, Copenhagen. Available: https://energee-watch.eu/wp-content/up-loads/2014/05/Climate-change-impacts-and-vulnerabi-lity-in-Europe-2012.pdf.
[8] Li D, Boud-Zeid E, Oppenheimer M. (2014). The effectiveness of cool and green roof as urban heat mitigation strategies. IOP Publishing, Environmental Research Letters 9: 055002. https://doi.org/10.1088/1748-9326/9/5/055002.
[9] Tzavali A, Paravantis JP, Mihalakakou G, Fotiadi A, Stigka E. (2015). Urban heat island intensity: A literature review. Fresenius Environmental Bulletin 24(12): 4537-4554.
[10] Akbari H, Cartalis C, Kolokotsa D, Muscio A, Pisello AL, Rossi F, Santamouris M, Synnefa A, Wong N, Zinzi M. (2016). Local climate change and urban heat island mitigation techniques – the state of the art. Journal of Civil Engineering and Management 22(1): 1-16. https://doi.org/10.3846/13923730.2015.1111934
[11] Salvati A, Roura HC, Cecere C. (2017). Assessing the urban heat island and its energy impact on residential buildings in Mediterranean climate: Barcelona case study. Energy and Buildings 146: 38-54. https://doi.org/10.1016/j.enbuild.2017.04.025
[12] Mihalakakou G, Santamouris M, Papanikolaou N, Cartalis C, Tsangrassoulis A. (2004). Simulation of the urban heat island phenomenon in Mediterranean climates. Pure and Applied Geophysics 161: 429-451. https://doi.org/10.1007/s00024-003-2447-4
[13] Fintikakis N, Gaitani N, Santamouris M, Assimakopoulos M, Fintikaki M. (2011). Bioclimatic design of open public spaces in the historic centre of Tirana, Albania. Sustainable cities and Society 1: 54-62. https://doi.org/10.1016/j.scs.2010.12.001
[14] Santamouris M, Synnefa A, Karlessi T. (2011). Using advanced cool materials in the urban built environment to mitigate heat islands and improve thermal comfort conditions. Solar Energy 85: 3085–3102. https://doi.org/10.1016/j.solener.2010.12.023
[15] Battista G, Carnielo E, Vollaro RDL. (2016). Thermal impact of a redeveloped area on localized urban microclimate: A case study in Rome. Energy and Buildings 133: 446-454. https://doi.org/10.1016/j.enbuild.2016.10.004
[16] Santamouris M. (2014). Cooling the cities – A review of reflective and green roof mitigation technologies to fight heat island and improve comfort in urban environments. Solar Energy 103: 682–703. https://doi.org/10.1016/j.solener.2012.07.003
[17] Dimoudi A, Zoras S, Kantzioura A, Stogiannou X, Kosmopoulos P, Pallas C. (2014). Use of cool materials and other bioclimatic interventions in outdoor places in order to mitigate the urban heat island in a medium size city in Greece. Sustainable Cities and Society 13: 89–96. https://doi.org/10.1016/j.scs.2014.04.003
[18] Akbari H, Matthews HD. (2012). Global cooling updates: Reflective roofs and pavements. Energy and Buildings 55: 2–6. https://doi.org/10.1016/j.en-build.2012.02.055
[19] Akbari H, Levinson R, Miller W, Berdahl P. (2005). Energy saving potentials and air quality benefits of urban heat island mitigation. Lawrence Berkeley National Laboratory Available: http://escholarship.org/u-c/item/20j676c9.
[20] Zoras S, Tsermentselis A, Kosmopoulos P, Dimoudi A. (2014). Evaluation of the application of cool materials in urban spaces: A case study in the center of Florina. Sustainable Cities and Society 13: 223–229. https://doi.org/10.1016/j.scs.2014.01.007
[21] Santamouris M, Xirafi F, Gaitani N, Spanou A, Saliari M, Vassilakopoulou K. (2012). Improving the microclimate in a dense urban area using experimental and theoretical techniques: the case of Marousi, Athens. International Journal of Ventilation 11(1): 1-16. https://doi.org/10.1080/14733315.2012.11683966
[22] Ambrosini D, Galli G, Mancini B, Nardi I, Sfarra S. (2014). Evaluating mitigation effects of urban heat islands in a historical small center with the ENVI-Met® climate model. Sustainability 6: 7013-7029. https://doi.org/10.3390/su6107013
[23] Evola G, Gagliano A, Fichera A, Marletta L, Martinico F, Nocera F, Pagano A. (2017). UHI effects and strategies to improve outdoor thermal comfort in dense and old neighborhoods. Energy Procedia 134: 692–701. https://doi.org/2017. 10.1016/j.egypro.2017.09.589
[24] ENVI-met V4.4. Urban environment through holistic Microclimate Modelling. Available: https://www.envi-met.com/last-accessed 2019/02/13.
[25] Bruse M. (2006). ENVI-met 3 – a three-dimensional microclimate model., Ruhr University at Bochum, Geographischer Institute, Geomatik, Available: http://www.envi-met.com.
[26] Bruse M, Fleer H. (1998). Simulating surface-plant-air interactions inside urban environments with a three-dimensional numerical model. Environment Modelling & Software 13(3-4): 373–384. https://doi.org/10.1016/s1364-8152(98)00042-5
[27] Fanger PO. (1970). Thermal comfort. Analysis and applications in environmental engineering. Mc Graw Hill.
[28] Standards, S. (2005). Ergonomics of the Thermal Environment – Analytical Determination and Interpretation of Thermal Comfort Using Calculation of the PMV and PPD Indices and Local Thermal Comfort Criteria, International Standards Organization, Geneva.
[29] ENVI-met Development Team, 2014. Using ENVI-met BioMet. Available: http://www.envimet.info/do-ku.php?id=ap-ps:biomet.
[30] Santamouris M. (2013). Using cool pavements as a mitigation strategy to fight urban heat island – A review of the actual developments. Renewable and Sustainable Energy Reviews 26: 224-240. https://doi.org/10.1016/j.rser.2013.05.047
[31] Costanzo V, Evola G, Gagliano A, Marletta L, Nocera F. (2013). Study on the application of cool paintings for the passive cooling of existing buildings in Mediterranean climates. Advances in Mechanical Engineering 2013. https://doi.org/10.1155/2013/413675
[32] Gagliano A, Detommaso M, Nocera F, Patania F, Aneli S. (2014). The retrofit of existing buildings through the exploitation of the green roofs - A simulation study. Energy Procedia 62: 52-61. https://doi.org/10.1016/j.egypro.2014.12.366