OPEN ACCESS
The diffusion of plastic materials had and still has a significant impact on the environment. Among these, PVC (polyvinylchloride) is certainly able to guarantee the best cost/performance ratio, high sustainability and absolute recyclability.
In particular, this work refers to cement-based mortars with PVC compound used for electric cables sheathing. The aim was to verify the potential of a “new” mix-design in terms of energy efficiency and mechanical resistance of the finished products.
Some mortar specimens were prepared using as basic components cement, water, sand and PVC as powder and granules.
The plastic aggregate, in volumetric substitution of the sand, has been varied in proportions varying up to 50 % of the dry component.
Different mixtures were prepared, all referred to a base one without PVC, to evaluate its influence on workability, thermal conductivity, compressive and flexural strength, capillary water absorption.
Experimental results have shown that increasing the amount of PVC reduces density as well as compressive and flexural strength. However, PVC mortars show a greater resistance to capillary water absorption compared to the reference one, while the thermal conductivity values slightly decrease. This study is the basis for subsequent research based on further combinations of aggregates.
cementitious mortar, PVC compound, mechanical and hygro-thermal characterization
The diffusion of plastics in the customs and traditions of modern society has led, among other consequences, to a significant increase in the production of waste associated with it, with obvious repercussions on the environment and on the entire sustainability chain.
The fact that plastic is not a biodegradable material entails considerable difficulties linked to its disposal, recycling and therefore possible reuse.
These issues are well known today; for example, the “Great Pacific Garbage Patch” or simply the “plastic island” is the largest of the five offshore plastic accumulation zones in the world’s oceans. More precisely it is an enormous accumulation of floating waste (composed mainly of plastic) located in the Pacific Ocean, between 135° and 155° west meridian and between 35° and 42° north parallel, halfway between Hawaii and California.
This huge mass of waste that is concentrated due to marine currents represents a huge damage to the various animal and plant ecosystems [1].
Plastic recycling is therefore a possible and desirable option. There are many examples of this. For example, its high calorific value can be used for incineration or in other
high-temperature processes such as pyrolysis [2].
Waste plastics can also be recycled for the production of materials similar to the original ones, although this type of process is often uneconomic and the products obtained are of inferior quality to the original ones. Among all the possible solutions, reuse within cement composites seems to be one of the best solutions for the disposal of plastic waste, since concrete is the most widely used construction material [3].
In recent years, the most commonly used types of plastics in concrete and mortar have been: polyethylene terephthalate (PET), polyethylene (PE), polystyrene (PS), polycarbonate (PC), polyvinyl chloride (PVC), polyurethane foams [4-6].
The research work presented here addresses the issue of the possible reuse in cement mortars of PVC obtained from the disposal of electrical cables, investigating the implications of the composite material thus created with respect to the mechanical and thermal behavior as a function of the different percentages of PVC added to the cementitious mixture.
The materials used for the preparation of the samples were a Portland cement CEM II/A-LL 32.5 R [7], water at room temperature, sand characterized by a particle size composition between 0 and 4 mm [8], PVC obtained by the recycling of electrical cables and scrap from the metal grinding and removal operations carried out at R.ed.el srl.
The water/cement ratio was of 0.5, in order to guarantee an appropriate workability of the mixture.
Density was calculated following the pycnometric method for aggregate with granules between 0.063 mm and 4 mm [10] and it was equal to 2600 kg/m3.
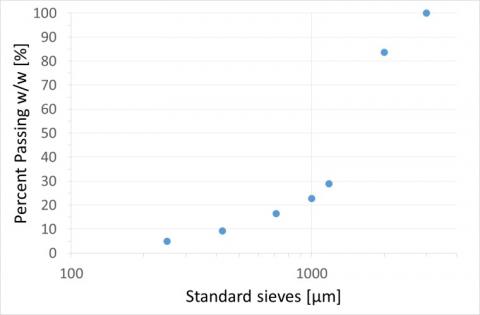
Two types of PVC were analysed, each with its own particle size distribution [9]: the first coming from copper cables (PVC-Cu) and the second from aluminium cables (PVC-Al) and with a large quantity of metal in all its particle size distribution.
Figure 1. Granulometric distribution of PVC-Cu
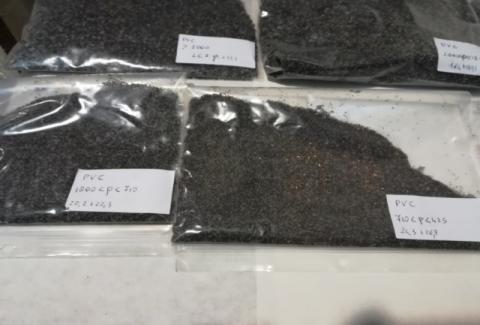
Figure 2. PVC-Cu sieving results
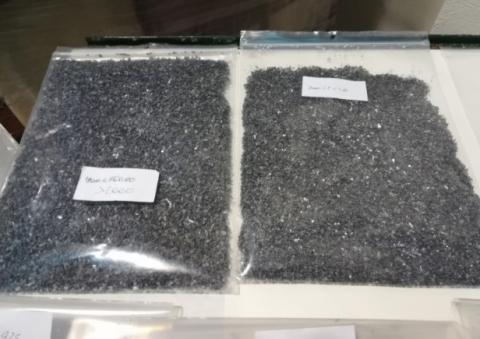
Figure 3. PVC-Cu sieving results; on the right the presence of copper in particle size up to 710 mm is observable
Figure 4. PVC-Al sieving results
2.1 Specimens preparation
Two different sample geometries were prepared in order to find the best mix design for the material.
The first one (160 × 40 × 40 mm) was used for the mechanical test and the capillary water absorption test.
The second one (300 × 300 × 20 mm) was used to study the thermal properties of the resulting composite materials.
The amount of plastic aggregate was calculated as a replacement percentage for sand, calculated by volume, with a variation between 10 % and 50 % [11].
In detail, for each type of mixture, they were made:
- nine samples for mechanical strength tests [12];
- two samples for thermal conductivity tests [13].
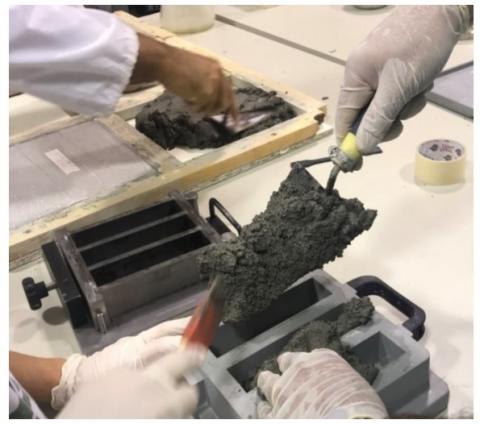
The samples for flexural and compressive strength tests were prepared in special moulds (figure 5) and aged for 28 days in a controlled humidity environment.
Figure 5. The mixture is poured into the formworks
Different types of mixtures were produced: the first one, considered as reference (REF), was made only with cement, sand and water, while the other five mixtures, indicated as PVC10, PVC10, PVC10, PVC20, PVC30, PVC30, PVC40 and PVC50, presented a volumetric substitution of the silica aggregate with PVC, respectively equal to 10, 20, 30, 40 and 50 %. For PVC20 and PVC40 mixtures, only 9 samples were produced for mechanical characterisation tests.
It should be noted that PVC coming directly from the grinding and shredding phases was used, neglecting the finer part that passes through the 710 µm sieve, in order to eliminate the metal part. On average, for each kg of PVC, 150 grams pass through a 710 µm sieve, so the other 850 grams can be used for the mixtures (Figure 1).
Table 1. Composition of PVC cement based mixture
|
|
REF[kg] |
PVC10[kg] |
PVC20[kg] |
PVC30[kg] |
PVC40[kg] |
PVC50[kg] |
|
Cement |
2.51 |
2.51 |
0.56 |
2.51 |
1.00 |
2.51 |
|
Sand |
6.76 |
6.09 |
1.20 |
4.73 |
1.62 |
3.38 |
|
Water |
1.25 |
1.25 |
0.16 |
1.25 |
0.50 |
1.25 |
|
PVC |
- |
0.35 |
0.28 |
1.05 |
0.56 |
1.76 |
The prismatic samples for the mechanical tests carried out under conditions of humidity of 95 % ± 5% and temperature of 20 °C ± 2 °C were taken from the formworks after 24 hours of curing and placed in an environment with controlled humidity of 65 % ± 5 % and at a temperature of 20 °C ± 2°C. The tests were carried out on the mortar hardened after 28 days, evaluating in advance the weight of the samples to be tested [12].
After 28 days of hardening, the samples for the thermal test were placed in an oven at a temperature of 60 °C until a constant mass was reached. Three repetitions were made for each panel to ensure reproducibility of the results.
Experimental tests have been carried out to study the thermal and mechanical properties of products containing different percentages of PVC.
For the study of the mechanical properties of mortars containing PVC, nine samples were prepared for each mixture (dimensions 1604040 mm), to be used for flexural and compressive strength tests, according to UNI EN 1015-11 “Test methods for mortar for masonry - Determination of flexural and compressive strength of hardened mortar” [12].
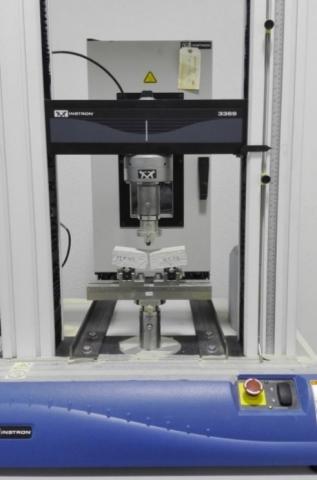
The test equipment used for both types of mechanical tests was a Dual Column Instron 3369 frame [14]. The instrumentation applies the load at a specified speed: for a flexural strength between 10 N/s and 50 N/s (in particular 20 N/s); for a compressive strength without impact and continuously increased up to a speed between 50 N/s and 500 N/s (100 N/s), so that the breakage occurs in a period between 30 s and 90 s. The load is applied at a specified speed: for a flexural strength between 10 N/s and 50 N/s (in particular 20 N/s); for a compressive strength without impact and continuously increased up to a speed between 50 N/s and 500 N/s (100 N/s), so that the breakage occurs in a period between 30 s and 90 s.
Figure 6. Specimen during a three point flexural test
Figure 7. PVC 20 specimen after compressive test
For each sample the maximum applied load was recorded and expressed in Newton; the bending and compressive strength was calculated to the nearest 0.05 N/mm2.
The apparatus used for thermal conductivity measurements was an heat flow meter in “single sample in a double configuration” (NETZSCH heat flow meter HFM 436/0/1) [15], placed in a conditioned laboratory at a temperature of 23 ± 2 °C and relative humidity 50 ± 5 %, to ensure observance of the test conditions required by the standard UNI EN 12664:2002 “Thermal performance of building and products - Determination of thermal resistance by means of guarded hot plate and heat flow meter methods - Dry and moist products of medium and low thermal resistance” [16]. The specimen is placed between two plates placed at two different temperatures (ΔT = 20 °C) and the average temperature of equilibrium of tests is set to 10 °C.
The heat flux (q) which passes through the specimen is measured by heat flux transducers; A is the area through which the heat passes: with the achievement of thermal equilibrium the test ends. For the purpose of the analysis was considered only a central portion (100x100mm) of the whole specimen. The heat balance is expressed by Fourier equation:
Φ=λ·A·ΔT/d (1)
The two transducers measure the heat flow through the specimen; the transducer area is the area through which passes the heat and is constant for all the specimens, then:
Φ=N·V (2)
where N is the calibration factor that joins the potential difference of the transducers to heat flow through the specimen. Resolving isolating λ, thermal conductivity is given by the following relation:
λ=N·V·d/(ΔT·A) (3)
Table 2. Geometric characteristics of the specimens
|
REF |
PVC10 |
PVC30 |
PVC50 |
|
|
Length [cm] |
29 |
29 |
29 |
29 |
|
Depth [cm] |
29 |
29 |
29 |
29 |
|
Thickness [cm] |
2.43 |
2.45 |
2.4 |
2.5 |
|
Volume [cm3] |
0.002 |
0.002 |
0.002 |
0.002 |
|
Weight [g] |
4190 |
3848 |
3406.8 |
3407.9 |
After weighing, each sample was placed in the oven at a temperature of 70 °C for 48 hours. During conditioning, the samples were weighed at 24-hour intervals.
At the end of the 48 hours, as no further mass variation was detected, the density [17] was calculated, a parameter to be inserted before starting the test as an input in the Q-Lab software to calculate λ. The sample tested was placed between two plates placed at two different temperatures (ΔT=20 °C) with an average temperature of equilibrium of the tests set at 10 °C.
Table 3. Density of the specimens
|
|
REF |
PVC10 |
PVC20 |
PVC30 |
PVC40 |
PVC50 |
|
Density [kg/m3] |
2058 |
1950 |
1870 |
1790 |
1620 |
1650 |
The samples used for the capillary water absorption test were prepared according to UNI EN 1015-18 [18]. As prescribed, at the end of the 28-day period, the 160 mm × 40 mm × 40 mm samples were removed from the moulds and the four long faces were sealed with the chosen sealing material (paraffin); they were then broken into two halves.
After this step, the samples were dried in a ventilated oven at 60 ± 5 °C until a constant mass has been achieved. This condition is considered to have been reached if two consecutive weightings, 24 hours apart, do not differ by more than 0.2 % of the total mass.
Then the broken face of the sample was immersed in water (depth of 5 ÷ 10 mm) and the absorption of water by capillary absorption was measured by increasing the weight of each sample at regular intervals of time.
In particular, after 10 minutes the samples were taken from the container, their surface was quickly dried with a damp cloth, they were weighed (M1) and immediately immersed again in water.
The same procedure was repeated at 10, 30, 45, 45, 90 and 120 minutes [19] (the standard provides for a weighing of only 10 and 90 minutes).
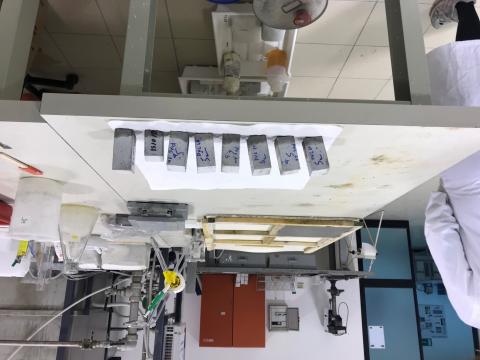
Figure 8. Specimens at minute t10
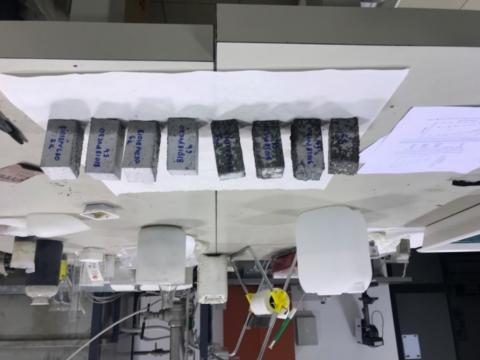
Figure 9. PVC20 and PVC40 specimens at minute t120
Figure 10. PVC30 and PVC50 specimens at minute t120
5.1 Mechanical tests
The following tables show the average values of flexural and compressive breaking strength and the percentage difference with respect to the specimens without replacement of the aggregate.
Table 4. Results of flexural tests
|
Flexural strength [MPa] |
(f - fREF) / fREF [%] |
|
|
REF |
6.4 |
-- |
|
PVC10 |
6.05 |
-5.00 |
|
PVC20 |
5.5 |
-14.06 |
|
PVC30 |
4.88 |
-23.75 |
|
PVC40 |
4.61 |
-27.97 |
|
PVC50 |
3.38 |
-47.19 |
Table 5. Results of compressive tests
|
Compressive strength [MPa] |
(σ - σ REF) / σ REF [%] |
|
|
REF |
26.38 |
-- |
|
PVC10 |
22.19 |
-15.88 |
|
PVC20 |
18.52 |
-29.80 |
|
PVC30 |
14.71 |
-44.24 |
|
PVC40 |
13.18 |
-50.04 |
|
PVC50 |
9.69 |
-63.27 |
Increasing the amount of aggregate decreases the density, as well as compression and flexural strength. In literature, different studies report an increase in the mechanical properties of this type of materials by subjecting the specimens to strength tests even after time intervals exceeding 28 days required for maturation, thus reaching up to 120 days [32].
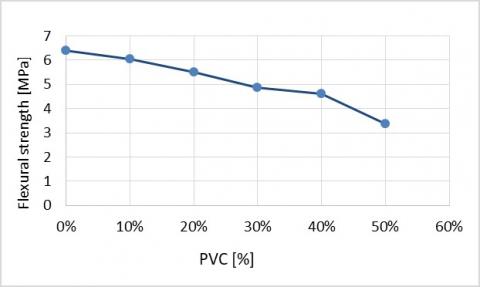
As the PVC content increases, there is a decrease in the flexural strength; up to 20 % of substitution of the siliceous aggregate the variation with respect to that is below 15 %.
As for the flexural strength, the increase in the PVC content shows a decrease in compressive strength; the samples made with PVC10 show a negative variation of 15 % of the strength required for breaking; from 30 % onwards there is a considerable loss of the material's ability to withstand compressive loads.
Figure 11. Flexural strength related to PVC percentage
Figure 12. Compressive strength related to PVC percentage
5.2 Thermal tests
For each panel thermal conductivity λ10, expressed in W/mK, and thermal resistance, expressed in m2K/W were determined. The results are shown in the next table 7.
Table 6. Thermal properties of the specimens
|
REF |
PVC10 |
PVC30 |
PVC50 |
|
|
Thermal Conductivity λ10 [W/mK] |
0.46 |
0.43 |
- |
0.34 |
|
Thermal Resistance [m2 K/W] |
0.05 |
0.05 |
- |
0.08 |
This reduction of thermal conductivity values is a very interesting fact given that this adds value to the range of existent studied materials, so it is worth considering at what percentages there is a decrease in thermal conductivity, predicting future tests on other combinations of aggregate as sand replacement, in order to expand the test set.
5.3 Capillary water absorption
Water transport properties of mortar surface influence its durability. In the present study, capillary water absorption tests have been carried out according to UNI EN 1015-18:2004 [18]. The specimens have been dried in a ventilated oven at 60 °C until a constant mass has been achieved. After cooling at 20 °C, all of the specimens were put on a grid in a shallow bath of water a 20 °C, at a depth of about 6 mm.
For mortars different from mortar for restoration, the water absorption coefficient is by definition equal to the slope of the line that joins the representative points of the measurements made.
According to UNI EN 1015-18:2004 standard, the coefficient C [kg/(m2 × min0.5)] is calculated using the expression:
$C=0.1 (M_2-M_1 )$ (4)
where:
M1 represents the weight of the sample, averaged for the same type of specimen, at time t = 10min;
M2 represents the weight of the sample, averaged for the same type of specimen, at time t = 90min.
For a more efficient evaluation of the capillary water absorption coefficient, the calculation was also carried out using a second procedure that takes into account several points for the linear regression of the line representing the adsorbent capacity of the material.
In particular the uptake of water by capillary absorption was measured through the weight gain of each specimen at regular intervals of immersion (10, 30, 45, 90, 120 minutes). The equation used to model the absorption of water due to capillary action is the following [19]:
$A=(a_0+St^{0.5} )$ (5)
where:
A [mg/mm2] is the water absorbed by the area unit from the moment it is immersed in water;
S [mg/ (mm2 × min0.5)] is the sorptivity of the material;
t [minutes] is the elapsed time;
a0 [mg/mm2] is the water initially absorbed by the pores in contact with water.
Performing the average of the results obtained, the capillary adsorption coefficient is calculated by linear interpolation of the values of A and t0.5 and the evaluation of the slope of the curve.
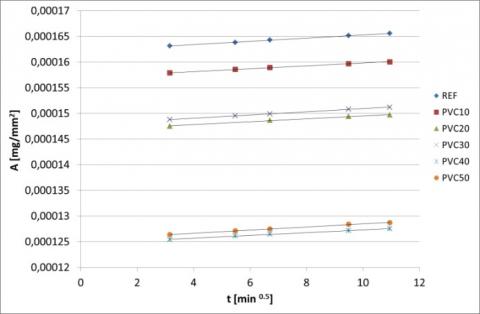
The next graph shows the values of the angular coefficient for each test/class of specimens and the value of R2 calculated with the least squares method.
Figure 13. Capillary absorption vs time at different PVC %
Table 7. Sorptivity values as obtained by experimental data
|
|
S [mg/mm2 × min0.5]*107 |
R2 |
|
REF |
3.155 |
0.99901 |
|
PVC10 |
2.79 |
0.99915 |
|
PVC20 |
2.823 |
0.99153 |
|
PVC40 |
2.69 |
0.99605 |
|
PVC50 |
3.03 |
0.99835 |
Table 8. Capillary water absorption values according to the alternative method [19]
|
REF |
PVC10 |
PVC20 |
PVC40 |
PVC50 |
|
|
3.155 |
2.79 |
2.823 |
2.69 |
2.64 |
[kg/(m2 × min0.5]*104 |
|
- |
-11.6 |
-10.5 |
-14.7 |
-16.3 |
% variation [-] |
Based on the obtained results, it is possible to make some considerations:
- the specimens containing PVC have greater resistance to the absorption of water by capillarity than the mortar without sand replacement;
- the sorptivity is a property of the material that characterizes the tendency of a porous material to absorb and transmit water by capillarity. This value can be influenced by various parameters such as the water/binder ratio, the curing method and time, the drying conditions, the type of reagent mixing and the (partial) substitution of the reagents. In this case only the last factor has been changed, therefore the variation of the capillary absorption coefficient is attributable only to it;
- the application of methodology of the standard and of the linear regression of several points leads to almost identical results;
- the tests performed show that the samples containing PVC have a resistance to capillary rise of about 10 % higher than the reference sample.
The water transport properties on the surface of the mortar affect its durability.
Hygro-thermal and mechanical properties of a cementitious mortar containing PVC aggregates obtained from recycling of electrical cables were investigated.
An amount of plastic up to 50 % in place of silica aggregate was used for material manufacturing.
It is generally known that substituting plastic into a cementitious mix causes a decrease in compressive and tensile strength, probably due to the poor bond between plastic and surrounding matrix.
The use of PVC particles matched to the size of the sand it replaces, at a substitution of 20 % by volume, gave the most promising mechanical performance because flexural and compressive strength are respectively about 15 % and 30 % lower than standard mix.
On the other side hygro-thermal properties improve with the increasing of PVC amount: thermal conductivity of PVC50 is equal to 0.34 W/mK and capillarity water absorption coefficient decreases of about 15 % with respect to the reference sample.
Nowadays there is a particular focus on sustainability issues in all areas of activity, in particular construction.
The research demonstrates that it is possible to solve major problems in the management of plastic waste materials by recycling and to obtain new ecological building materials in applications requiring non-bearing lightweight concrete.
In this study, the optimal recipes for the manufacture of ecological mortars by PVC waste recycling were searched. Mortars containing reused PVC not involve high energy consumption and leads to a reduction of raw material use and also of environmental pollution.
Further investigations are needed before plastic can be considered for widespread use in cement based materials. First of all the bond between matrix and plastic have to be studied, and maybe will be imagined some methods to improve it through chemical treatment.
Also alternative cement types should be investigated, as well as the effect that plastic has on durability, workability, fire performance, and construction cost.
The authors wish to thank Stigliano Inerti S.P.A., in particular Mr Suriano, for his precious support during this work.
|
N V d q |
calibration factor, dimensionless potential difference, volt thickness of the specimen, mm heat flux, W |
|
f C t M A S a0 |
flexural strength, N.mm-2 capillarity water absorption coefficient, kg.m-2. min-0.5) time, min weight, kg water absorbed by the area unit from the moment it is immersed in water, mg.mm-2 material sorptivity, mg.mm-2.min-0.5 water initially absorbed by the pores in contact with water, mg.mm-2 |
|
Greek symbols |
|
|
λ ΔT Φ σ |
thermal conductivity, W.m-1. K-1 temperature difference between the two faces of the test, K heat flux, W compressive tension, MPa |
[1] Dautel SL. (2009). Transoceanic trash: International and united states strategies for the great pacific garbage patch. Golden Gate University Environmental Law Journal 3(1): 181-208. https://doi.org/10.1111/dme.12349
[2] López A, Marco ID, Caballero BM, Laresgoiti MF, Adrados A. (2011). Dechlorination of fuels in pyrolysis of PVC containing plastic wastes. Fuel Processing Technology 92(2): 253-260. https://doi.org/10.1016/j.fuproc.2010.05.008
[3] Marzouk OY, Dheilly RM, Queneudec M. (2007). Valorisation of post-consumer plastic waste in cementitious concrete composites. Waste Manage 27(2): 310-318. https://doi.org/10.1016/j.wasman.2006.03.012
[4] Siddique R, Khatib J, Kaur I. (2008). Use of recycled plastic in concrete: A review. Waste Manage 28: 1835-1852. https://doi.org/10.1016/j.wasman.2007.09.011
[5] Ismail ZZ, Al-Hashmi EA. (2008). Use of plastic waste in concrete mixture as aggregate replacement. Waste Manage 28(11): 2041-2047. https://doi.org/10.1016/j.wasman.2007.08.023
[6] Soroushian P, Plasencia J, Ravanbakhsh S. (2003). Assessment of reinforcing effects of recycled plastic and paper in concrete. ACI Materials Journal 100(3): 203-207. https://doi.org/10.1002/adma.200304917
[7] UNI EN 197-1:2011 Cemento - Parte 1: Composizione, specificazioni e criteri di conformità per cementi comuni.
[8] UNI EN 13139: 2002 (cat.0/4): Aggregati per malta.
[9] UNI EN 933-1:2012: Prove per determinare le caratteristiche geometriche degli aggregati - Parte 1: Determinazione della distribuzione granulometrica - Analisi granulometrica per setacciatura.
[10] UNI EN 1097-6:2002 Prove per determinare le proprietà meccaniche e fisiche degli aggregati - Determinazione della massa volumica dei granuli e dell'assorbimento d'acqua.
[11] Cardinale T, Sposato C, Feo A, Fazio PD. (2018). Clay and fibers: Energy efficiency in buildings between tradition and innovation. Mathematical Modelling of Engineering Problems 5(3): 183-189. https://doi.org/10.18280/mmep.050308
[12] UNI EN 1015-11:2001 Metodi di prova per malte per opere murarie - Determinazione della resistenza a flessione e a compressione della malta indurita.
[13] UNI EN 12664:2001 Thermal performance of building materials and products - Determination of thermal resistance by means of guarded hot plate and heat flow meter methods - Dry and moist products of medium and low thermal resistance.
[14] Cardinale T, Arleo G, Bernardo F, Feo A, Fazio PD. (2017). Investigations on thermal and mechanical properties of cement mortar with reed and straw fibers. International Journal of Heat and Technology 35: S375-S382. https://doi.org/10.18280/ijht.35Sp0151
[15] Cardinale T, Arleo G, Bernardo F, Feo A, Fazio PD. (2017). Thermal and mechanical characterization of panels made by cement mortar and sheep’s wool fibres. Energy Procedia 140: 159-169. https://doi.org/10.1016/j.egypro.2017.11.132
[16] UNI EN 12664:2001 Thermal performance of building materials and products - Determination of thermal resistance by means of guarded hot plate and heat flow meter methods - Dry and moist products of medium and low thermal resistance.
[17] UNI EN 1015-10:2007 Metodi di prova per malte per opere murarie - Parte 10: Determinazione della massa volumica apparente della malta indurita essiccata
[18] UNI EN 1015-18:2004 Metodi di prova per malte per opere murarie - Determinazione del coefficiente di assorbimento d'acqua per capillarità della malta indurita.
[19] Candamano S, Luca PD, Frontera P, Crea F. (2017). Production of geopolymeric mortars containing forest biomass ash as partial replacement of metakaolin. Environments 4(74): 1-13. https://doi.org/10.3390/environments4040074