Vishal A. Meshram![]() | Suvarna S. Pawar
| Suvarna S. Pawar![]() | Vidula V. Meshram
| Vidula V. Meshram![]() | Archana Kale
| Archana Kale![]() | Kanchan S. Tiwari
| Kanchan S. Tiwari![]() | Sarita Ambadekar
| Sarita Ambadekar![]() | Mrinai M. Dhanvijay
| Mrinai M. Dhanvijay![]() | Manisha A. Dudhedia
| Manisha A. Dudhedia![]() | Govind S. Pole
| Govind S. Pole![]() | Balaji Bodkhe*
| Balaji Bodkhe*![]() | Shravan H. Gawande
| Shravan H. Gawande![]()
© 2025 The authors. This article is published by IIETA and is licensed under the CC BY 4.0 license (http://creativecommons.org/licenses/by/4.0/).
OPEN ACCESS
The IT industry is revolutionized by cloud computing due to its flexible, scalable, and demand-based access to resources. However, choosing an appropriate cloud service becomes difficult due to the increase in adoption and diversity across pricing models, performance parameters, and Quality of Service (QoS) benchmarks. Stratus-provided algorithms for automatic selection of user-defined services tend to overlook user requirements and the cloud environment’s dynamic attributes. This paper proposes an Exponential Similarity Measure (ESM)-based approach for efficient selection of service provisioning. The model revises the service matching problem by applying an exponentially weighted similarity function which increases precision by placing more focus on the critical user-defined criteria and dampening the influence of less relevant parameters. The proposed ESM model integrates and multi criteria decision making techniques to validate and process for services. The model attains contextual and precision recommendations by minimizing user preference differences through high attribute exponential weighting. To assess performance, the model was compared with traditional selection-based algorithms and against real-life datasets of cloud services. It is shown in the experimental results that the application of the ESM approach leads to higher service selection accuracy, user preference adaptability, and scalability in multi-faceted scenarios. This work introduces a new framework for supporting decision-making in cloud environments which helps consumers make decisions and enables service providers to refine their offerings. The algorithms based on ESM provide powerful, configurable, and low-cost solutions for the sophisticated problems arising from the provisioning of services in the cloud environment.
multi-criteria decision making, service selection, cloud service provisioning, Exponential Similarity Measure (ESM), Quality of Service (QoS), cloud optimization
Cloud computing has revolutionized the way software is designed, deployed, and accessed, with Internet-Centric Software being a key concept in this paradigm. The cloud model offers three well- defined service delivery models:
In addition to these service models, cloud computing encompasses four primary deployment models [1]:
A critical enabling technology for cloud computing is virtualization [2], which enhances scalability, security, and resource management while providing a shared computing environment. Virtualization allows multiple operating systems and applications to run on the same physical hardware, improving efficiency and resource utilization. Cloud computing presents numerous advantages, making it an attractive solution for various sectors, including academia, industry, government, and Small to Medium Enterprises (SMEs). These sectors leverage cloud computing for cost efficiency, flexibility, and enhanced collaboration. However, despite its benefits, cloud computing poses several challenges. As highlighted by Liaqat et al. [3], fundamental issues arise in legal, technical, and economic domains, affecting both users and cloud service providers. Addressing these concerns is crucial for the widespread adoption and long-term sustainability of cloud computing technologies.
The selection of a Cloud Service Provider (CSP) is crucial for meeting an organization's IT requirements. Decision-makers must evaluate CSPs based on operational needs, financial constraints, and long-term performance goals. Various service providers offer different cloud models, necessitating a structured approach for selection. The Analytic Hierarchy Process (AHP), as discussed by Kogias et al. [4], simplifies decision-making by assessing alternatives based on key criteria. This study identifies eight critical parameters for CSP selection, including cybersecurity, portability, interoperability, and compliance with data protection regulations. Data must be stored only as needed and in accordance with security policies. To avoid vendor lock-in, CSPs should allow seamless transition between services. Additionally, contractual and legal agreements ensure accountability, defining responsibilities and providing legal recourse in case of disputes. A well- informed selection process enhances security, compliance, flexibility, and operational efficiency. Cloud computing enhances productivity through advanced technologies and tools aligned with current needs. Data reliability is ensured by network backups, preventing data loss due to hardware or software failures. Standards and certifications establish trust and credibility among cloud service providers. Cloud services evolve over time, supported by a Service Roadmap that guarantees planned enhancements. Key factors in CSP [5] selection include vendor capabilities, human resources, and technical expertise. Reliability is ensured through connectivity, performance, and security, while Migration Support facilitates seamless data transfers between cloud environments [6].
Multi-criteria decision analysis (MCDA) helps in CSP [5] selection by ranking cloud parameters. The cosine maximization technique determines priority vectors, and a non-linear optimization model is used for pairwise comparisons. Security and transparency are critical concerns in cloud adoption. Trust [7] is a key factor in transferring computing infrastructure to the cloud, with challenges related to control, ownership [8], security, and compliance. Security controls in cloud computing align with traditional IT settings but vary based on SaaS, PaaS, and IaaS delivery models [9], distributing responsibility between cloud providers and customers.
Adopting cloud computing involves a degree of control loss for customers, necessitating a "trust but verify" approach. Cloud providers must offer tools for security verification and monitoring to enhance transparency [10]. Different providers offer varied cloud services to meet customer requirements [11], but concerns such as security compliance and provider history remain critical [12]. The cloud services can be partitioned in the different classes using the different data mining techniques [13]. The Cloud Controls Matrix (CCM) improves transparency by guiding customers in assessing cloud security practices. The AHP helps prioritize selection criteria based on expert evaluation and institutional importance. The cosine maximization technique is employed for vector measurement and unique vector analysis, refining priority calculations. If the pairwise coefficient consistency meets required thresholds through an iterative process, adjustments are made using methods like geometric mean weight or arithmetic mean weight. In cases where inconsistencies arise, the pairwise comparison matrix is reallocated to ensure meaningful and accurate decision-making.
This section overview of CSP performance evaluation in cloud computing, but gives disproportionate attention to service delivery models (IaaS, PaaS, SaaS) and deployment models (public, private, hybrid, community) thinking these will help to build background context. Although such components add to the context, their explanation overshadows the focal area of the research which is CSP selection. The readers who have some working knowledge about the cloud technologies may find these sections redundant, while those who are interested in the frameworks discussing CSP decision-making would find this section too shallow. In my opinion, these sections could remain in the introduction, but authors should try to explain them in only a few sentences so they can then address particular problems organizations face when selecting a CSP, including dealing with the multifaceted tangled provider service offerings, mapping provider capabilities to defined business or technical needs, and meeting regulatory and security compliance requirements. Also, the introduction does not take advantage of clearly stating the current CSP selection methodologies gaps and lack of an explicit motivation for introducing an Exponential Similarity Measure (ESM) CSP selection model. Focusing on the research problem, gaps, and the argument for the solution would strengthen the focus of the study while increase its relevance for researchers and practitioners interested in optimizing cloud services.
1.1 Application allocation in hybrid and inter-cloud environments
Allocating application components across multiple public clouds is a preferred strategy due to the diverse service offerings of cloud providers. Sidhu and Singh [8] presented that such allocation can yield significant cost savings while considering inter-cloud communication costs and delays, which impact application performance. Inter-cloud communication has recently shown high performance within cloud federations. Hybrid cloud models, combining public and private cloud resources, are widely adopted for service provisioning. In resource-constrained scenarios, network bandwidth availability and communication demands are key factors in workflow scheduling across public and private infrastructures [10].
1.2 Role of networking in cloud computing performance
Networking plays a crucial role in hybrid, single, and inter-cloud service provisioning [11-14]. It is essential for the integrated management of network and computing resources to ensure high-performance, end-to-end service delivery. For instance, a research lab generating 100GB of raw data processes it using Amazon EC2 [15]. Each EC2 instance processes 20GB per hour, and with 10 virtual machines, the total processing time is 30 minutes. However, data transmission delays exceed an hour due to a 200 Mb/s network bandwidth, contributing to over 80% of total service delay in a round-trip scenario. This example illustrates that end-to-end cloud services depend on both cloud and network infrastructure, with Quality of Service (QoS) in networking being a key factor in overall cloud service performance.
1.3 Advancements in networking for cloud computing
Traditional networking systems provide data communication services but struggle to meet the growing demands of cloud computing. Cloud computing requires high-performance, predictable network performance, integrating network and computing resources through application-driven network management [16, 17]. Conventional networks are built on rigid infrastructures with limited flexibility for reconfiguration. However, advancements in network virtualization, Software-Defined Networking (SDN), and Service-Oriented Architecture (SOA) have significantly enhanced network management for cloud service provisioning [18]. A key feature of future networking is network virtualization, which decouples network service provisioning from data transport infrastructure [19]. Network Function Virtualization (NFV) allows virtualized network functions, reducing dependence on dedicated data center hardware [20]. The European Telecommunications Standards Institute (ETSI), Industry Specification Group (ISG), NFV architectural framework provides a virtualized layer for managing storage, computing, and network resources [21]. A standard orchestrator ensures end-to-end service provisioning by coordinating virtual storage, computing, and network management [22-25]. These advancements in networking and virtualization bridge the gap between network and computing resources, enabling federated management for seamless composite service provisioning. Table 1 presents a comparative analysis of existing approaches.
From the literature review, it is evident that a multi-parameter-based approach is essential for selecting the most suitable cloud service provider. Additionally, factors such as security, technology, transparency, trustworthiness, business policies and governance, industry best practices, reliability, performance, service level agreements, financial stability, company profile, and migration support must be enhanced to develop a robust framework for cloud provider selection based on diverse user requirements. To address this complexity, the Cloud-based Hierarchy Process (CHP) is introduced as a decision-making technique that effectively resolves intricate problems involving multiple subjective and varied choices.
In addition, the existing approaches often lack the ability to handle qualitative parameters and their relative importance effectively, especially in cases where user needs change rapidly or criteria are conflicting. The absence of an adaptive rational weighing mechanism that discriminates among fundamental components aggravate the precision shortcomings of the existing approaches even more. This underlines the challenge of having a precise, flexible, and robust approach which is mathematically formulated to adaptively assess the CSPs under multiple criteria. To address this defined gap, this work develops a model based on the ESM for the selection of cloud services. With the ESM approach, precision in decisions is achieved through the assignment of exponential weights to each service attribute based on users’ priorities, therefore, ensuring that key parameters influence selection outcomes disproportionately. This vastly improves the selection process and mitigates the issues posed by existing frameworks through more sophisticated alignment and tuning. This proposed framework enhances the precision of the context-aware provisioning of cloud services decision support systems. This approach employs pairwise comparisons to establish priorities, facilitating optimal decision-making. The proposed system offers several key contributions, as outlined below: Cloud Vendor Selection, ESM, Expert-Driven Evaluation. The structure of this work is as follows: Section 2 presents a comprehensive analysis of existing methodologies; Section 3 discusses the proposed.
ESM model in detail, Section 4 provides numerical outcomes related to cloud service provisioning, Section 5 summarizes the research findings.
Table 1. Comparison of various existing approaches with their merits and demerits
|
References |
Methods/Approach |
Merit |
Demerit |
|
Akter et al. [19] |
Non-linear constraint optimization approaches. |
Systematic, trusted, transparent and qualitative information. rank the performance scores. |
Representation with a single value, subjective information, scalability and transparent problem, and uncertainty are solutions. The calculation is difficult. |
|
Andrikopoulos et al. [21] |
QoS, Trust, reputation and feedback technique. |
CSP is selected that based on QoS parameters like performance, availability, reliability and serviceability, having consumer’s feedback and recommendations. |
Problems invalidation, cost and resource constraints, scalability and dependability. |
|
Kou et al. [17] |
An iterative cosine maximization technique. |
Flexible to compute the prioritization vector. |
The consistency index needs to be improved. |
|
Yao and Lu [23] |
Round-robin load balancer and heuristic technique to find the approximate result. |
Data centres' overloading is reduced and lowers the cost, improving the performance in service. |
The initial cost of implementing the data centre is more significant. In the selection of routes, the processing time is high. The connection will fail when the timestamp has elapsed in the round-robin technique. |
This section provides a detailed analysis of the proposed exponential similarity metrics for provisioning the suitable cloud service provisioning process. The proposed model is designed to handle the multi-objective constraints and provide an appropriate framework for cloud providers. A multi-parameter-based approach is essential for selecting the optimal cloud service provider. Key factors such as security, technology, transparency, trustworthiness, business policies, reliability, performance, SLAs, and migration support must be considered to develop a structured selection framework. The CHP is introduced as a decision- making technique to handle complex, subjective choices. It employs pairwise comparisons to establish priorities, ensuring consistency in evaluation. The final phase of CHP integrates weight criteria and optional scores to compute a final score, synthesizing outcomes for optimal decision- making. It is proved with the following analysis.
Definition 1: Let A=(aij)n×n be the square matrix that is mentioned as the positive reciprocal if aij>0, and $a_{i j}=\frac{1}{a_{j i}}$ is expressed as in Eq. (1):
$A=\left( \begin{matrix} 1 & {{a}_{12}} & ..{{a}_{1n}} \\ \frac{1}{{{a}_{12}}} & 1 & ..{{a}_{2n}} \\ \frac{1}{{{a}_{1n}}} & \frac{1}{{{a}_{2n}}} & ..1 \\\end{matrix} \right)$ (1)
Definition 2: The reciprocal matrix A=(aij)n×n is said to be as per the existing model is consistent perfectly when $a_{i j}=a_{i k} a_{k j} \forall i, j, k \in\{1,2,3, \ldots, n\}$.
Definition 3: The similarity measure among wo vectors vi and vjis denoted SM (vi,vj)→[0,1], whose domain is V2. Here, V specifies the n-dimensional vector space and it holds the below valuables:
ESM: The objective optimal function is used to obtain the exponential similarity measures of the consistency index. The C* equals the Pairwise Comparison Matrix (PCM) order when the PCM is consistent. On the other hand, this relies on the ranges from 0 and 1. The consistency index of ESM makes the PCM's sizes available, i.e., $E S I=C^* / n$.
The matrix is consistent perfectly when the CCI is 1. The CCI's lower value represents that the PCM has a familiar constant. Commonly, if the CCI is less than 90%, the CCI needs to be more than 90%. Moreover, the PCM’s consistency is not improved using the existing cosine similarity method. Generally, the PCM's consistency needs to be enhanced using the process in the recursive technique for the entries of the revised judgment matrix till one does not attain the required accuracies for the consistency of the judgment matrix. The weighted geometric mean method or arithmetic mean is selected to enhance consistency.
2.1 Theoretical proof of exponential similarity measures
The memory-based collaborative filtering algorithm is proposed that accepts all similarity formulas for the user to service provisioning calculation. The selection process is predicted using any similarity measure by this algorithm for the specific service provider. This algorithm 1 compares the similarity measures for Root Mean Square Error (RMSE) outcomes for selection and user similarity. The selections are predicted with the help of user similarity. The similarity between service selection and users are identified using different measures. One of the approaches is the ESM which is used to compute the angle among two space vectors. Based on the study conducted by Esposito et al. [25], Pearson introduced the normalized factor of the similarity measure where Manhattan and Euclidean are the other similarity measures [26, 27]. The Manhattan distance is the sum of vertical and horizontal distances on the points between points. The theoretical similarity measures [28] like the replacements to compute the RMSE [29, 30] for the similarity function and every similarity measure’s results are compared.
|
Algorithm 1 Similarity measure |
|
Input: Selection matrix where the column specifies the user and the row defines the similarity metrics for the available users. Output: Filled selection Matrix
|
The introduction of the ESM is used to measure the exponential distance that manages the vectors containing the empty elements. The given Eq. (2) describes the ESM as:
$Exp({{u}_{i}},{{u}_{j}})={{e}^{\frac{\sqrt{\sum\limits_{item=1}^{|j|}{{{({{u}_{i}}(item)-{{u}_{j}}(item))}^{2}}}}}{\varnothing \sqrt{f}}}}$ (2)
The both service similarity weight has considered for recommender list and weight of QoS parameters has utilized for ESM calculation. Here, $0 \leq \operatorname{Exp}\left(u_i, u_j\right) \leq 1$ equals the difference between maximal obtainable and minimal obtainable ratings. The user needs to provide and $|I|$ represent the items number. However, f means the elements' numbers that are rated using both users, and the similarity needs to be identified between intersections of filled elements. Figure 1 and Table 2 represent the similarities smoothly as smooth functions are computed to generate better coefficients like the similarity measure.
Figure 1. Exponential similarity function
Table 2. Exponential similarity measure
|
Item No. |
User 1 |
User 2 |
User 3 |
User 4 |
User 5 |
|
Item 1 |
5 |
4 |
5 |
4 |
4 |
|
Item 2 |
|
2 |
4 |
|
4 |
|
Item 3 |
1 |
|
|
5 |
1 |
|
Item 4 |
|
1 |
3 |
|
3 |
The two vectors' distances need to be measured in the rating matrix such as way that the intersection of filled elements of two user’s vectors like filling the elements using both the user vectors to identify the similarity that is compared to find the similarities and the similarity measure's exponential natures generates the coefficient of similarity for the smooth function. The similarity measure has the issues that do not have the balanced nature that results from the various intersection of filled elements among vectors that create the biased similarity coefficients. It is represented in Figure 1, where user one and user three are considered the same users with a similarity coefficient. The two users are not assumed as completely identical since the two users have one filled element alone in general, and the user 3 has another filled element that is not intersected with user 1’s filled elements. Whereas, since many intersecting filled elements are nearer in value, user three and user 5 are the same users in the real world. Hence user 3's empty element is 0.89 when considering the similar-users are not the optimum rating. Another novel similarity measure is introduced to solve this issue the ESMs provide importance to the number of filled elements among two vectors. Eq. (3) is used in Figure 1. Since user three does not include the ratings of similar items like user one, which provides fewer intersecting elements, user one and user 3 are entirely dissimilar. The similarity measure of novel normalized exponential is represented by Eq. (3). Multi-criteria decision-making methods ensure accurate and consistent weighting, which is then used for selecting cloud service providers (see Table 3).
Table 3. Service providers
|
Features |
Amazon |
Microsoft Azure |
|
VM Ware |
Adobe |
|
Technological & service roadmap |
$\checkmark$ |
$\checkmark$ |
$\checkmark$ |
$\checkmark$ |
$\checkmark$ |
|
Business policies & data governance |
$\checkmark$ |
$\checkmark$ |
$\checkmark$ |
$\checkmark$ |
$\checkmark$ |
|
Certifications & standard |
$\checkmark$ |
$\checkmark$ |
$\checkmark$ |
$\checkmark$ |
$\checkmark$ |
|
Service dependencies and partnership |
$\checkmark$ |
$\checkmark$ |
$\checkmark$ |
$\checkmark$ |
$\checkmark$ |
|
SLA & commercial |
$\checkmark$ |
$\checkmark$ |
$\checkmark$ |
$\checkmark$ |
$\checkmark$ |
|
Reliability & performance |
$\checkmark$ |
$\checkmark$ |
$\checkmark$ |
$\checkmark$ |
$\checkmark$ |
|
Support lock & vendor |
$\checkmark$ |
$\checkmark$ |
$\checkmark$ |
$\checkmark$ |
$\checkmark$ |
|
Business health & company profile |
$\checkmark$ |
$\checkmark$ |
$\checkmark$ |
$\checkmark$ |
$\checkmark$ |
$\operatorname{Exp}-\operatorname{Normalized}\left(u_i, u_j\right)=\frac{e^{\frac{\sqrt{\sum_{\text{item}=1}^{|j|}\left(u_i(\text { item })-u_j(\text{ item})\right)^2}}{\emptyset \sqrt{f}}}}{\frac{\left|U_i\right|}{f}}$ (3)
Here $\emptyset$ is equalized to the difference between maximal obtainable and minimal obtainable ratings (see Table 4 and Figure 2). The user needs to provide and $|I|$ represent the items number. However, $f$ means the elements' numbers that are rated using both users, and the similarity needs to be identified between intersections of filled elements. $\left|U_i\right|$ represents the number of filled elements for selecting the present vector user. The theoretical proof of the similarity measure is given below:
Theorem 1: Let $\widehat{\omega} *=(\widehat{\omega} * 1 . \hat{\omega} * 2 . \widehat{\omega} * 3 . \ldots, \widehat{\omega} * n)$ specifies the optimal solution, let C* represents then,
$\widehat{\omega} *=\frac{\sum_j^n b_{i j}}{\sqrt{\sum_{k=1}^n\left(\sum_j^n b_{k j}^2\right)}} i=1,2,3 \ldots n$ (4)
Table 4. RMSE based similarity measure
|
Similarity Techniques |
K=2 |
K=5 |
K=10 |
K=20 |
K=30 |
K=100 |
Accuracy |
|
Manhattan |
1.3440 |
1.2200 |
1.1494 |
1.0973 |
1.0749 |
1.0285 |
98.60 |
|
Euclidean |
1.3881 |
1.2441 |
1.1662 |
1.1116 |
1.0877 |
1.0366 |
97.30 |
|
Jaccard |
1.0924 |
1.0263 |
0.9964 |
0.9812 |
0.9762 |
0.9733 |
96.80 |
|
Cosine |
1.0725 |
1.0142 |
0.9886 |
0.9752 |
0.9719 |
0.9714 |
99.30 |
|
Pearson |
1.0225 |
0.9780 |
0.9618 |
0.9547 |
0.9537 |
0.9575 |
97.80 |
|
Normalized |
1.0195 |
0.9647 |
0.9391 |
0.9273 |
0.9259 |
0.9352 |
97.20 |
|
Exponential similarities measure |
0.9573 |
0.9399 |
0.9370 |
0.9411 |
0.9448 |
0.9591 |
98.90 |
Figure 2. Similarity measure comparison
The objective function with optimal value is expressed by Eq. (5):
${{C}^{*}}=\sqrt{\sum\limits_{k=1}^{n}{(\sum\limits_{j=1}^{n}{b_{ij}^{2}{{)}^{2}}}}}$ (5)
where, $\hat{\omega }*=\hat{\omega }*\sqrt{\sum\limits_{k=1}^{n}{\omega _{k}^{2}}}$, i=1,2,3, …, n.
Let, $\beta^*=\sqrt{\sum_{k=1}^n \omega_k^2} \geq 0$.
It leads in the form in Eq. (6) as,
$\omega _{i}^{*}=\hat{\omega }_{i}^{*}{{\beta }^{*}}$ (6)
The system of equations is used to solve similarity of exponential measure. Here, β* is the coefficient of weighted assignments, and the assignment weight is the partial exponential normalization that constrains the obtained weights for optimizing the similar exponential measure. The coefficient of weight assignment represents the reciprocal of sum of the distinct maximization optimum solution.
$\sum\limits_{i=1}^{n}{\omega _{i}^{*}=\sum\limits_{i=1}^{n}{{{{\hat{\omega }}}^{*}}{{\beta }^{*}}}}$ (7)
$\sum_{i=1}^n \omega_i^*=1$
$\beta^*=\frac{1}{\sum_{j=1}^n \widehat{\omega}_y^*}$ (8)
The adjusted priority vector is given by Eq. (10).
$\omega_i^*=\widehat{\omega}_i^* \beta^*=\widehat{\omega}_i^* \frac{1}{\sum_{j=1}^n \widehat{\omega}_y^*}$ (9)
Theorem 2: Let PCM $A=\left(a_{i j}\right)_{n^* n}$ is consistent perfectly where the matrix method is derived precisely with the optimal objective function value $C^*=n$, and the properties $\omega_j^*=$ $\frac{1}{\sum_{i=1}^n a_{i j}}$, where, $j=1,2,3, \ldots, n$. The PCM of matrix A intends to form the matrix as in Eq. (10):
$A=\left(\begin{array}{ccc}\frac{\omega_1}{\omega_1} & \frac{\omega_1}{\omega_1} & \frac{\omega_1}{\omega_1} \\ \vdots & \vdots & \vdots \\ \frac{\omega_n}{\omega_1} & \frac{\omega_n}{\omega_2} & \frac{\omega_n}{\omega_n}\end{array}\right)$ (10)
The similarity is attained with the priority vector $\omega$ and the jth column vector with matrix A. It is expressed as in Eq. (11).
$\begin{gathered}C_j=\text { Exponential Similarity Matrix }\left(\omega, a_j\right) =\frac{\sum_{k=1}^n \omega_k a_{k j}}{\sqrt{\sum_{k=1}^n \omega_k^2} \sqrt{\sum_{k=1}^n a_{k j}^2}}\end{gathered}$ (11)
The values of $j$ are set as $1,2, \ldots, n$ where the priority vector $\omega=\left(\omega_1, \omega_2, \ldots, \omega_n\right) T$ and the PCM column entry is provided as $a_j=\left(a_{1 j}, \ldots, a_{n j}\right) T$. The corresponding PCM matrix value with the priority vector is, $a_{i j}=\frac{\omega_i}{\omega_j}$, where for all $j=1,2, \ldots, n$ as in Eq. (12):
$\begin{gathered}C_i=\text { Exponential Similarity Matrix }\left(\omega, a_j\right) =\frac{\sum_{k=1}^n \frac{\omega_k^2}{\omega_f}}{\sqrt{\sum_{k=1}^n \omega_k^2} \sqrt{\sum_{k=1}^n \frac{\omega_k^2}{\omega_j}}}=1\end{gathered}$ (12)
The matrix is consistent ideally iff the similarity measure for the priority vector, and matrix-vector is equal to 1. Else, the matrix is not constant ideally. It helps to enhance the similarity measure among the priority vector and pairwise comparison matrix.
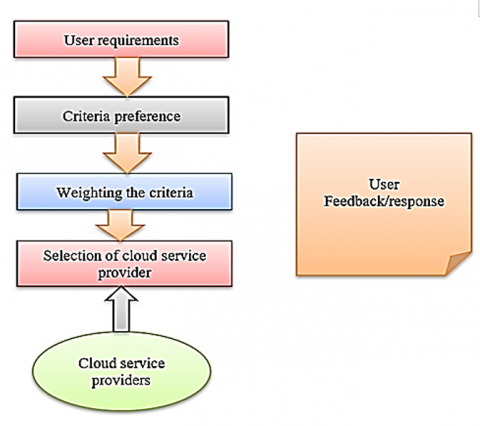
Figure 3 demonstrates the general architecture of the process for choosing a cloud service provider, illustrating a focus on users’ needs and preference details as a primary structure. All models begin with the identification of requirements which serves as the foundation of the entire thought process. Requirements typically consist of expectations: functional, technical, non-functional in terms of cost, security, performance, scale, and compliance needs. After this, users state their criteria preferences which delineate the ranking of parameters in-terms of importance for their cloud service. frameworks. The next step deals with the prioritization of criteria that is among the most crucial stages where each criterion is given relative focus in terms of importance. The multi-criteria decision-making approaches to criteria weighting because they guarantee accuracy and consistency in weighting allocation. Following the weighted criteria, the cloud service provider selection is carried out (Table 3). This entails assessing available CSPs against the defined criteria to ascertain where the specific user’s priorities and limitations meet the greatest value as the user’s cloud service provider. The model captures some feedback loops which are cycles whereby the user feedback or response is solicited after interested treatments have been applied. With this, the users can evaluate the effectiveness of their chosen provider and improve the selection process in the future. The feedback makes sure that the model captures something measurable and provides responsiveness to the user, technology, or fluctuations in service level changes. The Figure 3 highlights a self-directed and self-altering process in decision-making of a model where selection of the cloud service is not a singular action, but a repetitive loop driven by use and ever-evolving needs. This is excessive when attempting to improve accuracy in decision-making, increase cloud adoption satisfaction in the long run, and sustain transparency.
Figure 3. Cloud service provider frameworks
2.2 Cloud selection process
The data needs to be analyzed using the CHP model. The company's business profile needs to be concerned with selecting the cloud criteria such as security, technologies, transparency, trustworthiness, business policies and governance, best industry standards, reliability and performance, migration support, and service level agreements. There are eight parameters (Figure 4) called service roadmap, technologies, business policies, governance, security, choosing the best industry standards and certifications, services partnership and services dependency, reliability and performance, service level agreements, business and company profile and migration support are represented in Table 5 for optimizing the cloud selection.
Figure 4. Comparison of total similarity measure
Table 5. Total similarity measure based on cloud services
|
Cloud Services |
Experiment |
||
|
Exp1-Total Similarity Measure |
Exp2-Total Similarity Measure |
Exp3-Total Similarity Measure |
|
|
Linode |
0.465 |
0.45 |
0.65 |
|
Rackspace |
0.0 |
0.0 |
0.0 |
|
|
0.95 |
0.97 |
1.1 |
|
HP |
0.50 |
0.50 |
0.50 |
|
Soft layer |
0.49 |
0.49 |
0.55 |
|
City-cloud |
0.60 |
0.59 |
0.52 |
|
Amazon |
0.0 |
0.81 |
0.82 |
|
Joyent |
0.0 |
0.0 |
0.35 |
The user-provided PCM chooses the priority vector using the exponential similarity measures. The IT experts and the academicians help to assign the weightage of the grouped attributes. Here, MATLAB 2020a is used to obtain the results. This program comprises the computation of the standard matrix, the weights. The weights for the attributes are adjusted by using the coefficient of weight assignment. The coefficient of weight assignment is depicted as the reciprocal of the sum of weights (attributes). The normalized matrix B and the final weighted evaluation are presented in Tables 6 and 7.
Table 6. Total similarity measure
|
Cloud Services |
Total Measure |
|
CS1 |
0.7 |
|
CS2 |
0.0 |
|
CS3 |
1.0 |
|
CS4 |
0.59 |
|
CS5 |
0.43 |
|
CS6 |
0.74 |
|
CS7 |
0.89 |
|
CS8 |
0.62 |
|
CS9 |
0.35 |
|
CS10 |
0.77 |
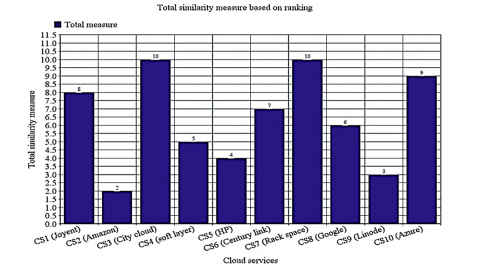
Table 7. Cloud service selection based on ranking
|
Cloud Services |
CS1 (Joyent) |
CS2 (Amazon |
CS3 (City Cloud) |
CS4 (Soft Layer) |
CS5 (HP) |
CS6 (Century Link) |
CS7 (Rackspace) |
CS8 (Google) |
CS9 (Linode) |
CS10 (Azure) |
|
Total measure |
8 |
2 |
10 |
5 |
4 |
7 |
10 |
6 |
3 |
9 |
$\beta^*=\frac{1}{\sum_{j=1}^n \widehat{\omega}_y^*}$ (13)
A weight assignment coefficient’s computational value is given below:
$\beta^*=0.0301$ (14)
CMM is achieved using the optimal objective function with the square root of the sum of squares of the PCM's normal weight.
$C^*=\sqrt{\sum_{i=1}^n\left(\sum_{j=1}^n b_{i j}^2\right)^2}$ (15)
The objective function’s computational value is given below.
${{C}^{*}}=7.2429$ (16)
Exponential Similarity Index (ESI): the average optimal objective function needs to obtain the exponential similarity index.
$ESI=\frac{{{C}^{*}}}{n}$ (17)
The proposed method has the outcomes used to evaluate the priority vector is efficient, simple, flexible, and accurate from the PCM. The exponential similarity measures the present PCM’s consistency. The given PCM’s computational ESI shows 90.5367%. The high level of consistency is represented in the Tables 6 and 7. The PCM's observed data is valid.
Figures 5 and 6 illustrate the cloud parameters with their computational weights and preferences. The consistency of matrix A ensures the reliability of the Cloud Service Model (CSM), which ranks alternatives CS1 to CS10 (refer to Tables 6 and 7). Different methods yield varied priority vectors, but their relative superiority remains unaddressed in recent studies. However, this analysis confirms that the proposed model demonstrates better performance compared to other approaches in cloud service provisioning.
Figure 5. Total similarity measure
Figure 6. Total similarity measure based on ranking
In an evaluation Table 8, the performance of AHP used in five research studies is compared against a proposed Cosine Similarity-based method on eight criteria concerning CSP (Cloud Service Provider) selection. The criteria are Weight Sensitivity, Handling of Qualitative Criteria, Scalability, User Involvement, Consistency Checking, Adaptability, Computational Complexity, and Overall Accuracy of the Decision. Ratings are given from 1 to 5, with 1 being low and 5 high. AHP-based studies [31-35] demonstrated high scores on weight sensitivity and consistency checking, scoring predominantly in the 4-5 range.
Table 8. Comparative analysis between AHP, Cosine similarity of proposed approach
|
Criteria |
Khan et al. [31] |
Xiahou et al. [32] |
Akbar et al. [33] |
Wu and Chen [34] |
Rahimi et al. [35] |
Cosine Similarity (Proposed) |
|
Weight Sensitivity |
5 |
4 |
5 |
4 |
4 |
4.5 |
|
Qualitative Criteria Handling |
5 |
4 |
5 |
4 |
4 |
4.3 |
|
Scalability |
3 |
3 |
4 |
3 |
4 |
5 |
|
User Involvement |
4 |
4 |
4 |
3 |
3 |
4.6 |
|
Consistency Checking |
5 |
4 |
5 |
4 |
4 |
5 |
|
Adaptability |
3 |
3 |
4 |
3 |
4 |
5 |
|
Computational Complexity |
2 |
3 |
2 |
3 |
3 |
3 |
|
Overall Decision Accuracy |
5 |
4 |
5 |
4 |
4 |
4.5 |
According to Figure 7, various QoS parameters are valuated in comparative analysis. User Involvement and Adaptability also show this differing dependable nature suggesting the need for expert input and inflexible response to change. In contrast, the proposed method of Cosine Similarity shows marked improvements in Scalability (5.0), Computational Complexity (5.0), and Adaptability (5.0). This indicates possible broad automated evaluation for low oversights around the system. It also does fairly well in User Involvement (4.6) and Overall Decision Accuracy (4.5), indicating strong performance in practical applications. In addition, it does not perform as well in Weight Sensitivity (4.5) and Qualitative Criteria Handling (4.3) when compared to AHP, which shows some compromises in the logic-based decision-making. Besting AHP in efficiency of execution and scalability of workload, the Table 7 shows the Cosine Similarity-based approach’s advantage complements the AHP’s framework of structured and systematic reliability of decision-making.
Figure 7. Comparative analysis between AHP and proposed cosine similarity approach
This work describes a dynamic service selection using similarity-based techniques. The seven different similarity techniques are applied for accurate process of recommendation. The selection of the cloud section parameters is identified in the proposed model. The exponential similarity measures are applied, and this is considered the non-linear constraint optimization approach in the selection of cloud for estimating the reliable priority vectors. Some cloud parameters such as certifications and standards, technologies, problems in security, service level agreement (SLA), policies, reliability, performance and so on are the key parameters for choosing the services in the cloud. The technologies priority and service roadmap, data governance, and data security are represented in the outcomes, considered essential parameters when the cloud is selected. The IT experts provide the data gathered to construct the pairwise compared matrix. The experimental results compute the exponential consistency index, which shows the weights assigned at the high level of agreements. The evaluation has done with various AHP processing algorithms where proposed similarity-based techniques obtain 98.90% accuracy which is higher than all conventional approaches. The attributes weightage is related to the selection criteria of the cloud, which is ranked. The exponential similarity transformation method provides complete performance, an excellent single parametric model. The necessity of the technique is discussed to uplift the customers for adopting cloud computing and assist in choosing the correct cloud service providers having no security compromises for both parties. Cloud provider provides the transparency that is encouraged. The integration of machine learning algorithm for service recommendation based on QoS parameters will be the future work for this system.
[1] Gill, S.S., Buyya, R. (2018). A taxonomy and future directions for sustainable cloud computing: 360 degree view. ACM Computing Surveys (CSUR), 51(5): 1-33. https://doi.org/10.1145/3241038
[2] Buyya, R., Srirama, S.N., Casale, G., Calheiros, R., Simmhan, Y., Varghese, B., et al. (2018). A manifesto for future generation cloud computing: Research directions for the next decade. ACM Computing Surveys (CSUR), 51(5): 1-38. https://doi.org/10.1145/3241737
[3] Liaqat, M., Chang, V., Gani, A., Ab Hamid, S.H., Toseef, M., Shoaib, U., Ali, R.L. (2017). Federated cloud resource management: Review and discussion. Journal of Network and Computer Applications, 77: 87-105. https://doi.org/10.1016/j.jnca.2016.10.008
[4] Kogias, D.G., Xevgenis, M.G., Patrikakis, C.Z. (2016). Cloud federation and the evolution of cloud computing. Computer, 49(11): 96-99. https://doi.org/10.1109/MC.2016.344
[5] Ma, K., Bagula, A., Ajayi, O. (2019). Quality of service (QoS) modelling in federated cloud computing. arXiv Preprint arXiv:1911.03051. https://doi.org/10.48550/arXiv.1911.03051
[6] Eisa, M., Younas, M., Basu, K., Awan, I. (2020). Modelling and simulation of QoS-aware service selection in cloud computing. Simulation Modelling Practice and Theory, 103: 102108. https://doi.org/10.1016/j.simpat.2020.102108
[7] Chauhan, S.S., Pilli, E.S., Joshi, R.C., Singh, G. (2018). UPB: user preference based brokering for service ranking and selection in federated cloud. In 2018 IEEE International Conference on Advanced Networks and Telecommunications Systems (ANTS), Indore, India, pp. 1-6. https://doi.org/10.1109/ANTS.2018.8710049
[8] Sidhu, J., Singh, S. (2017). Improved TOPSIS method based trust evaluation framework for determining trustworthiness of cloud service providers. Journal of Grid Computing, 15: 81-105. https://doi.org/10.1007/s10723-016-9363-1
[9] Abdel-Basset, M., Mohamed, M., Chang, V. (2018). NMCDA: A framework for evaluating cloud computing services. Future Generation Computer Systems, 86: 12-29. https://doi.org/10.1016/j.future.2018.03.014
[10] Chandni, M., Sowmiya, N.P., Mohana, S., Sandhya, M.K. (2017). Establishing trust despite attacks in cloud computing: A survey. In 2017 International Conference on Wireless Communications, Signal Processing and Networking (WiSPNET), Chennai, India, pp. 712-716. https://doi.org/10.1109/WiSPNET.2017.8299854
[11] Georgiopoulou, Z., Lambrinoudakis, C. (2016). Literature review of trust models for cloud computing. In 2016 15th International Symposium on Parallel and Distributed Computing (ISPDC), Fuzhou, China, pp. 208-213. https://doi.org/10.1109/ISPDC.2016.36
[12] Mohamed, B., Youness, K.I., Mohamed, M. (2016). Taking trust when adopting cloud computing architecture. In: 2nd International Conference on Cloud Computing Technologies and Applications (CloudTech), Marrakech, Morocco, pp. 101-106. https://doi.org/10.1109/CloudTech.2016.7847685
[13] Pole, G., Gera, P. (2024). Combined clustering with classification in a semi-supervised context: An efficient data partitioning. Journal of Integrated Science and Technology, 12(5): 824-824. https://doi.org/10.62110/sciencein.jist.2024.v12.824
[14] Al-Faifi, A., Song, B., Hassan, M.M., Alamri, A., Gumaei, A. (2019). A hybrid multi criteria decision method for cloud service selection from Smart data. Future Generation Computer Systems, 93: 43-57. https://doi.org/10.1016/j.future.2018.10.023
[15] Manasrah, A.M., Smadi, T., Almomani, A. (2017). A variable service broker routing policy for data center selection in cloud analyst. Journal of King Saud University-Computer and Information Sciences, 29(3): 365-377. https://doi.org/10.1016/j.jksuci.2015.12.006
[16] Meesariganda, B.R., Ishizaka, A. (2017). Mapping verbal AHP scale to numerical scale for cloud computing strategy selection. Applied Soft Computing, 53: 111-118. https://doi.org/10.1016/j.asoc.2016.12.040
[17] Kou, G., Ergu, D., Lin, C., Chen, Y. (2016). Pairwise comparison matrix in multiple criteria decision making. Technological and Economic Development of Economy, 22(5): 738-765. https://doi.org/10.3846/20294913.2016.1210694
[18] Bertolino, A., Angelis, G.D., Gallego, M., García, B., Gortázar, F., Lonetti, F., Marchetti, E. (2019). A systematic review on cloud testing. ACM Computing Surveys (CSUR), 52(5): 1-42. https://doi.org/10.1145/3331447
[19] Akter, M., Gani, A., Rahman, M.O., Hassan, M.M., Almogren, A., Ahmad, S. (2018). Performance analysis of personal cloud storage services for mobile multimedia health record management. IEEE Access, 6: 52625-52638. https://doi.org/10.1109/ACCESS.2018.2869848
[20] Garg, S.K., Versteeg, S., Buyya, R. (2011). Smicloud: A framework for comparing and ranking cloud services. In 2011 Fourth IEEE International Conference on Utility and Cloud Computing, Melbourne, VIC, Australia, pp. 210-218. https://doi.org/10.1109/UCC.2011.36
[21] Andrikopoulos, V., Darsow, A., Karastoyanova, D., Leymann, F. (2014). CloudDSF-The cloud decision support framework for application migration. In Service-Oriented and Cloud Computing: Third European Conference, ESOCC 2014, Manchester, UK, Springer Berlin Heidelberg, pp. 1-16. https://doi.org/10.1007/978-3-662-44879-3_1
[22] Sáez, S.G., Andrikopoulos, V., Bitsaki, M., Leymann, F., Van Hoorn, A. (2018). Utility-Based decision making for migrating cloud-Based applications. ACM Transactions on Internet Technology (TOIT), 18(2): 1-22. https://doi.org/10.1145/3140545
[23] Yao, W., Lu, L. (2015). A selection algorithm of service providers for optimized data placement in multi-Cloud storage environment. In Intelligent Computation in Big Data Era: International Conference of Young Computer Scientists, Engineers and Educators, ICYCSEE 2015, Harbin, China. Springer Berlin Heidelberg, pp. 81-92. https://doi.org/10.1007/978-3-662-46248-5_11
[24] Tricomi, G., Panarello, A., Merlino, G., Longo, F., Bruneo, D., Puliafito, A. (2017). Orchestrated multi-cloud application deployment in OpenStack with TOSCA. In 2017 IEEE International Conference on Smart Computing (SMARTCOMP), Hong Kong, China, pp. 1-6. https://doi.org/10.1109/SMARTCOMP.2017.7947027
[25] Jrad, F., Tao, J., Streit, A., Knapper, R., Flath, C. (2015). A utility-Based approach for customised cloud service selection. International Journal of Computational Science and Engineering, 10(1-2): 32-44. https://doi.org/10.1504/IJCSE.2015.067056
[26] Esposito, C., Ficco, M., Palmieri, F., Castiglione, A. (2015). Smart cloud storage service selection based on fuzzy logic, theory of evidence and game theory. IEEE Transactions on Computers, 65(8): 2348-2362. https://doi.org/10.1109/TC.2015.2389952
[27] Subramanian, T., Savarimuthu, N. (2016). Application based brokering algorithm for optimal resource provisioning in multiple heterogeneous clouds. Vietnam Journal of Computer Science, 3: 57-70. https://doi.org/10.1007/s40595-015-0055-8
[28] Lin, D., Squicciarini, A.C., Dondapati, V.N., Sundareswaran, S. (2016). A cloud brokerage architecture for efficient cloud service selection. IEEE Transactions on Services Computing, 12(1): 144-157. https://doi.org/10.1109/TSC.2016.2592903
[29] Elhabbash, A., Elkhatib, Y., Blair, G., Lin, Y., Barker, A. (2019). A framework for SLO-Driven cloud specification and brokerage. In 2019 19th IEEE/ACM International Symposium on Cluster, Cloud and Grid Computing (CCGRID), Larnaca, Cyprus, pp. 666-667. https://doi.org/10.1109/CCGRID.2019.00085
[30] di Vimercati, S.D.C., Foresti, S., Livraga, G., Piuri, V., Samarati, P. (2019). A fuzzy-Based brokering service for cloud plan selection. IEEE Systems Journal, 13(4): 4101-4109. https://doi.org/10.1109/JSYST.2019.2893212
[31] Khan, A.W., Khan, M.U., Khan, J.A., Ahmad, A., Khan, K., Zamir, M., Kim, W., Ijaz, M.F. (2021). Analyzing and evaluating critical challenges and practices for software vendor organizations to secure big data on cloud computing: An AHP-based systematic approach. IEEE Access, 9: 107309-107332. https://doi.org/10.1109/ACCESS.2021.3100287
[32] Xiahou, J., Lin, F., Huang, Q., Zeng, W. (2018). Multi-Datacenter cloud storage service selection strategy based on AHP and backward cloud generator model. Neural Computing and Applications, 29: 71-85. https://doi.org/10.1007/s00521-016-2364-y
[33] Akbar, M.A., Khan, A. A., Mahmood, S., Alsanad, A., Gumaei, A. (2021). A robust framework for cloud‐Based software development outsourcing factors using analytical hierarchy process. Journal of Software: Evolution and Process, 33(2): e2275. https://doi.org/10.1002/smr.2275
[34] Wu, Y.J., Chen, J.C. (2021). A structured method for smart city project selection. International Journal of Information Management, 56: 101981. https://doi.org/10.1016/j.ijinfomgt.2019.07.007
[35] Rahimi, M., Jafari Navimipour, N., Hosseinzadeh, M., Moattar, M.H., Darwesh, A. (2022). Toward the efficient service selection approaches in cloud computing. Kybernetes, 51(4): 1388-1412. https://doi.org/10.1108/K-02-2021-0129