Catur Edi Widodo*![]() | Kusworo Adi
| Kusworo Adi![]() | Priyono Priyono | Aji Setiawan
| Priyono Priyono | Aji Setiawan![]()
© 2023 IIETA. This article is published by IIETA and is licensed under the CC BY 4.0 license (http://creativecommons.org/licenses/by/4.0/).
OPEN ACCESS
COVID-19, a global pandemic, has precipitated millions of fatalities worldwide. Concurrently, pneumonia, another perilous disease, continues to affect a vast global population. Diagnosis of COVID-19 can potentially be expedited through image processing techniques applied to chest X-ray (CXR) images. Innovative methodologies such as deep learning and computer vision offer a revolutionary approach to image recognition with minimal human input. This study aims to employ deep learning, specifically convolutional neural networks (CNN), for the detection of COVID-19 and pneumonia. The dataset under scrutiny comprises 9,208 CXR images, distributed across three distinct classes: 3,207 normal (35%), 1,281 COVID-19 (14%), and 4,657 pneumonia (51%). This dataset was subdivided into training and validation data, with an 80% allocation for training and 20% for validation. The approach adopted involved pre-training modifications before validation through data testing. Eight pre-trained models were comparatively analyzed: MobileNet V3 Small, VGG 19, EfficientNet V2 B0, VGG 16, EfficientNet V2 B3, ResNet RS152, EfficientNet V2 Small, and Inception V3. The MobileNet V3 Small model exhibited superior performance, achieving an accuracy of 0.9815.
COVID-19, pneumonia, chest X-ray images, deep learning, convolutional neural networks, pre-trained models, image classification
Coronavirus disease 2019 (COVID-19), an infectious disease instigated by the novel severe acute respiratory syndrome coronavirus 2 (SARS-CoV-2), poses a significant global health threat [1]. This virus, previously unidentified in humans, belongs to a family of coronaviruses known to cause severe illness, similar to middle east respiratory syndrome (MERS) and severe acute respiratory syndrome (SARS). Typical signs and symptoms of COVID-19 encompass acute respiratory symptoms, dyspnea, cough, and fever. The average incubation period is estimated to be 5-6 days, extending to a maximum of 14 days in some cases. In severe instances, COVID-19 may lead to pneumonia, acute respiratory syndrome, kidney failure, and even death [1].
Pneumonia, a respiratory illness often caused by viral infection, induces inflammation in the lungs, impairing the sacs' ability to absorb oxygen, consequently leading to cellular dysfunction due to oxygen deprivation [2]. Common symptoms include high fever, chest pain, difficulty breathing, and an accelerated heart rate. Pneumonia predominantly affects the elderly (over 60 years old) and children, and transmission commonly occurs through inhalation [2].
Early detection of both COVID-19 and pneumonia is crucial to prevent fatal outcomes. Currently, the detection of COVID-19 is primarily facilitated through Polymerase chain reaction (PCR) tests and swabs of respiratory tract fluids, which often yield uncertain results and require up to 24 hours for results. Similarly, early detection of pneumonia can be achieved through C-reactive protein (CRP) tests, but these also require 24-48 hours for diagnosis [2]. These methods necessitate specialized equipment, extended periods for results, and require trained healthcare professionals, making them time-consuming, costly, and inaccessible for regions such as Indonesia, where there is a shortage of healthcare professionals.
The advent of modern technology, particularly the advancement of artificial intelligence, has facilitated efficient, automatic learning with minimum human intervention [3]. Deep learning, a subset of artificial intelligence, is designed to mimic the structure of the human brain and has proven effective in solving image processing problems. The convolutional neural network (CNN), a deep learning method, has been successfully utilized in the medical field for the detection of skin cancer [4], breast cancer [5], brain cancer calcification [6], and lung segmentation [7]. A study in 2012 demonstrated the efficacy of CNN in image recognition, with accuracy comparable to human vision on a specific dataset [8]. These precedents suggest the potential application of CNN for the detection of COVID-19 and pneumonia using chest X-ray (CXR) imagery, providing a cost-effective, efficient, and accessible detection system.
Previous studies have implemented CXR for the detection of COVID-19 and pneumonia. Wang et al. [9] used the Covid-Net method, achieving an accuracy of 0.93; Rahimzadeh and Attar [10] utilized the Xception and ResNet 50 ensemble methods, yielding an accuracy of 0.914; Garg et al [11] employed ECOV-net with EfficientNet B3 as the base model, resulting in an accuracy of 0.97; and Montalbo [12] used the Fused Dense Tiny method, attaining an accuracy of 0.9799.
Motivated by these findings, the present study proposes a novel method for the detection of COVID-19 and pneumonia using CNN, incorporating a pre-training module before the fully connected layer module. Eight pre-trained models, namely MobileNet V3 Small, VGG 19, EfficientNet V2 B0, VGG 16, EfficientNet V2 B3, ResNet RS152, EfficientNet V2 Small, and Inception V3, are comparatively assessed. With this pre-training, we anticipate achieving superior accuracy.
2.1 Datasets
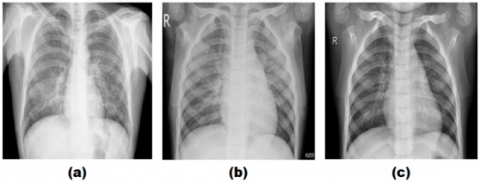
This study used a curated CXR (chest X-ray) dataset that was collected and prepared by Sait et al. [13]. The dataset consists of 3 classes, namely: CXR infected with COVID-19, CXR infected with pneumonia and normal CXR without any infection. The data totals 9208 CXR images, divided into 1281 CXR COVID-19, 4657 CXR pneumonia and 3270 normal CXR. Examples of CXR images of COVID-19, pneumonia and normal data can be seen in Figure 1.
Figure 1. Example of a CXR image: (a) COVID-19; (b) Pneumonia and (c) Normal
Prior to model training, the dataset was normalized by changing all image sizes to 224×224. Meanwhile, to overcome dataset imbalance, the dataset was divided into training data and validation data with a ratio of 80% for training and 20% for validation data. Before training, it is normalized by changing all image sizes to 224×224, as shown in Table 1.
Table 1. Datasets
|
Class |
Training Data (80%) |
Validation Data (20%) |
Total (100%) |
|
COVID-19 |
1025 |
256 |
1281 |
|
Pneumonia |
3726 |
931 |
4657 |
|
Normal |
2616 |
654 |
3270 |
|
Total |
76367 |
1841 |
9208 |
2.2 Transfer learning
Transfer learning is carried out using feature extraction from 8 pre-trained models to find the best accuracy value that can be generated. The pre-trained models used include MobileNetV3 Small [14], Inception V3 [15], VGG16 [16], VGG19 [16], ResNet RS152 [17], EfficientNetV2 B0 [18], EfficientNetV2 B3 [18], and EfficientNetV2 Small [18]. The feature extraction model will be left frozen, i.e., the layer has learned from the ImageNet dataset. Then the final layers will be fine tuned by activating (unfrozen) the layer. In the activated layer, the layer will retrain to learn the CXR dataset used.
The hallmark of VGG is the simplicity of the architecture. The main part of VGG only consists of a convolution layer followed by a maxpolling layer. The convolutional layer is useful for extracting features from the input image, while the maxpolling layer derives the output from the convolutional layer. From maxpolling, this can be passed down to the fully connected layer. The fundamental difference between the MobileNet architecture and the others is the use of a convolution layer with a filter thickness that matches the thickness of the input image. MobileNet divides convolution into depthwise convolution and pointwise convolution. This model is very suitable for limited resources such as mobile devices. EfficientNet is designed to improve accuracy by efficiently scaling depth, breadth and resolution. Ideally leads to an optimal balance for each dimension relative to the others. In this way, EfficientNet can produce better accuracy without increasing computational needs. ResNet was designed to address the 'missing gradient' problem. Because the gradient is backpropagated to the previous layer, repeated multiplication can make the gradient very small. As a result, the deeper the network goes, the performance drops rapidly. The way ResNet does this is to do an "identity shortcut connection" which skips one or more layers so that the gradient can be maintained. The Inception architecture consists of a series of convolutional layers, pooling layers, and auxiliary classifiers. The main innovation in the Inception architecture is the use of "Inception Modules", which combine multiple convolution operations into a single layer. Inception is very complex because it uses many techniques to improve performance; both in terms of speed and accuracy.
In this study, modifications to the classification layer were carried out to reduce misclassification and prevent overfitting. The model modifications made consist of the global average pooling (GAP) layer to pass the feature map into the classification layer by taking the average value of each pixel value from the feature map to the Flatten layer before passing it on to the fully connected layer. The fully connected layer consists of 6 fully connected blocks which contain a drop out layer with a probability of 0.5 which is useful for reducing overfitting, batch normalization to stabilize the training process, and a dense layer with 1024 neurons along with reLu activation. Then enter the output layer with 3 dense layers according to the class used, assisted by softmac activation. The architecture of this model can be seen in Figure 2.
Table 2. Hyper parameters used
|
Hyper-Parameter |
Feature Extraction |
Fine Tunning |
|
Value |
Value |
|
|
Optimizer |
Adam |
Adam |
|
Learning rate |
0.001 |
0.0001 |
|
Batch size |
32 |
32 |
|
Epoch |
50 |
50 |
Figure 2. Modified model architecture
2.3 Hyperparameters
The hyperparameters used in this study can be seen in Table 2. The optimizer used is the Adam optimizer, because Adam uses less memory than most other optimizers and Adam is the most widely used optimization algorithm in image classification involving medical images [19, 20]. The learning rate value used in the first feature extraction process is 0.001 while fine tunning is 10 times lower. The loss function used is categorical crossentropy because this study uses a multiclass classification rather than a binary classification. Batch size 32 is used to speed up the training process because the training data will be divided into batches, and the value 32 is the default value of batch_size because it is lighter on memory during the training process.
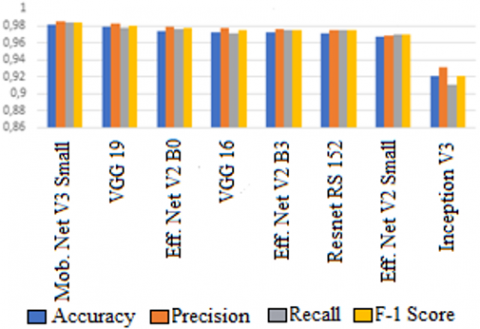
Table 3 shows the accuracy, precision, recall, and f1- scores obtained from the training variations of the 8 pre-trained models, with bold writing indicating the best accuracy value obtained. In this study, MobileNet V2 Small obtained the highest accuracy value, namely 0.9815 or 98.15%. MobileNet has the highest performance in this study because MobileNet is specifically designed for computer vision tasks, where efficiency and performance are better than other models on mobile devices and limited resources. Accuracy, precision, recall and f-1 score visually can be seen in Figure 3 where it can be seen that the average score of MobileNet V3 is the highest
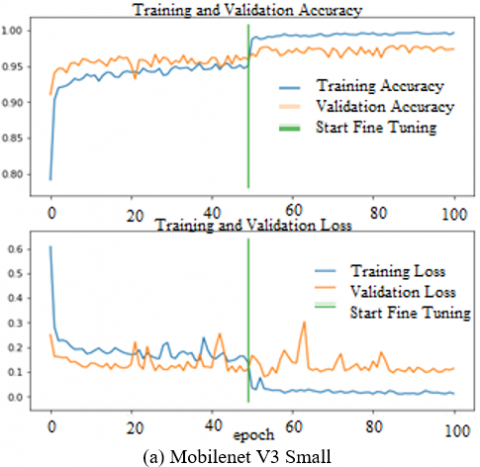
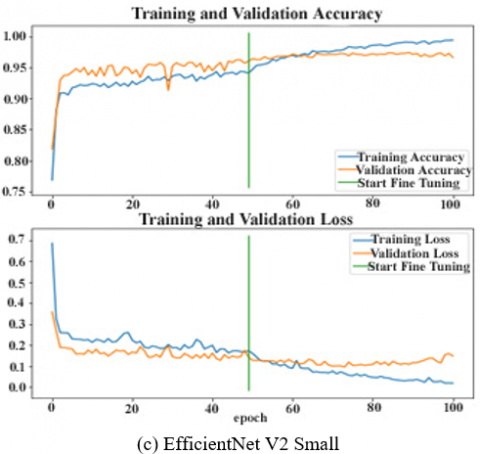
The training performance and validation test for each selected epoch can be seen in Figure 4. The green line indicates the start of the fine tuning process, namely at epoch 50. At that time the accuracy and loss in all models show an increase during the fine tuning process.
3.1 MobileNet V3 performance
The next stage is to evaluate the best model produced in this study, namely MobileNet V3 Small. Evaluation was carried out using 20% data testing (validation) outside of training data, namely 250 COVID-19 images, 931 images of pneumonia, and 654 normal images. The results of testing in the form of a confusion matrix can be seen in Table 4. From this table we calculate the accuracy in a simple way, namely the number of predicted labels that correspond to the true label (TP+TN) divided by all data (TP+TN+FP+FN) which results is 0.9815 or 98.15%, where the results are the same with the results of accuracy when training with the training dataset.
Figure 3. Results of training performance
Table 3. Results of training performance
|
Model |
Accuracy |
Precision |
Recall |
F-1 Score |
|
MobileNet V3 Small |
0.9815 |
0.9851 |
0.9836 |
0.9843 |
|
VGG 19 |
0.9783 |
0.9823 |
0.9770 |
0.9796 |
|
EfficientNet V2 B0 |
0.9739 |
0.9784 |
0.9767 |
0.9775 |
|
VGG 16 |
0.9728 |
0.9780 |
0.9711 |
0.9744 |
|
EfficientNet V2 B3 |
0.9728 |
0.9760 |
0.9746 |
0.9753 |
|
ResNet RS152 |
0.9707 |
0.9749 |
0.9746 |
0.9747 |
|
EfficientNet V2 Small |
0.9666 |
0.9686 |
0.9702 |
0.9693 |
|
Inception V3 |
0.9208 |
0.9317 |
0.9112 |
0.9207 |
Figure 4. Performance of 8 models during training
Table 4. Testing results
|
Predicted Value |
Actual Value |
|||
|
|
COVID-19 |
Pneumonia |
Normal |
|
|
COVID-19 |
254 |
1 |
1 |
|
|
Pneumonia |
0 |
914 |
17 |
|
|
Normal |
0 |
15 |
639 |
|
3.2 Analysis on wrong predictions
In the images with the true label COVID-19, out of 256 images there is still one image that is predicted to be pneumonia and one image predicted to be normal. In the COVID-19 image which is predicted as pneumonia, there is a lot of noise in the chest cavity so that the image is predicted as pneumonia. In the COVID-19 image which is predicted to be normal, it is indicated that the exposure captured is too low so that the consolidation of opacity and ground-glass that should be seen in the lobe as a characteristic of COVID-19 is not visible. The two incorrectly predicted images can be seen in Figure 5.
Figure 5. The mispredicted image of COVID-19: (a) Predicted as pneumonia and (b) Predicted as normal
In the images with true label pneumonia, out of 931 images, there are no images that are predicted to be COVID-19 and there are 17 images that are predicted to be normal. In pneumonia images that are predicted to be normal, the exposure captured is too high so that the shadow of the opacity in the chest cavity cannot be seen so that the image is predicted to be normal. An example of an image with a true label of pneumonia which is predicted to be normal can be seen in Figure 6.
Figure 6. Example of pneumonia predicting normal
In the images with normal true labels, out of 654 images, there are no images that are predicted to be COVID-19 and there are 15 images that are predicted to be pneumonia. In the normal image which is predicted as pneumonia, there is a lot of noise in the chest cavity so that the image is predicted as pneumonia. An example of an image with a normal true label which is predicted as pneumonia can be seen in Figure 7.
Figure 7. Normal sample predicting pneumonia
3.3 Grad-CAM analysis
In machine learning models, visual interpretation can also be carried out before being applied to clinical trials [21]. Visualization can be done using Grad-CAM which is useful to show that the model can study patterns of infected locations and mark infected areas. The Grad-CAM heat map highlights the areas showing the most prominent features that the model says are important for diagnosing each CXR. Even though the Grad-CAM still has limitations, namely not being able to display the entire area without errors, the Grad-cam is very helpful in improving the model [22]. Figure 8. shows a visual example of Grad-CAM COVID-19, pneumonia and normal. Based on Figure 6. it can be seen that in COVID-19, the prominent area is the side of the lobe, both left and right. On the heat map it appears yellow. In pneumonia, seen high intensity (red) in all areas of the lung. This is due to the nature of pneumonia in the form of inflammation that spreads throughout the lung area. On a normal image, there is no protruding part of the lung area.
Figure 8. Grad-CAM image of COVID-19, pneumonia and normal
Table 5. Research results as a comparison
|
Related Work |
Method |
Clases |
Accuracy |
|
Rahimzadeh and Attar [10] |
Ensemble Xception and ResNet50 |
Covid19, Pneumonia, Normal. |
0.9140 |
|
Shastri et al. [20] |
Inception with Transfer Learning |
Covid19, Pneumonia, Normal. |
0.9300 |
|
Wang et al. [9] |
COVID-Net |
Covid19, Pneumonia, Normal. |
0.9330 |
|
Garg et al. [11] |
ECOVNet-EfficientNet B3 Base |
Covid19, Pneumonia, Normal. |
0.9700 |
|
Montalbo [12] |
Fused DenseNet Tiny |
Covid19, Pneumonia, Normal. |
0.9799 |
|
Proposed method |
Modified MobileNet V3 Small |
Covid19, Pneumonia, Normal. |
0.9815 |
3.4 Comparison
By using 8 pre-trained models with modifications to the classification layer, the best results were obtained on the MobileNet V3Small model with 98.15% accuracy. This model is able to produce better accuracy than previous studies that have been carried out by several other researchers as shown in Table 5.
The modified model that we propose can classify CXR into 3 classes, namely normal CXR, COVID-19 CXR, and pneumonia CXR. This research was able to produce competitive accuracy values compared to other models. Based on the results that have been obtained, the best accuracy is obtained from the modified model using MobileNet V3 Small with an accuracy of 98.15%. This model gets the highest accuracy results when fine tuning is done. However, this research cannot be used to completely replace a doctor's or medical expert's diagnosis because it does not produce 100% accuracy. The results of this study can be used as a tool to confirm the results of a CXR diagnosis by a doctor or medical expert.
This study was funded by APBN of the Faculty of Science and Mathematics, Diponegoro University (Grant No.: 26.A/UN7.F8/PP/II/2023).
[1] Cucinotta, D., Vanelli, M. (2020). WHO declares COVID-19 a pandemic. Acta Bio Medica: Atenei Parmensis, 91(1): 157-160. https://doi.org/10.23750/abm.v91i1.9397
[2] Li, Y., Zhang, Z., Dai, C., Dong, Q., Badrigilan, S. (2020). Accuracy of deep learning for automated detection of pneumonia using chest X-Ray images: A systematic review and meta-analysis. Computers in Biology and Medicine, 123: 103898. https://doi.org/10.1016/j.compbiomed.2020.103898
[3] Goodfellow, I., Bengio, Y., Courville, A., Bengio, Y. (2016). Deep learning. MIT press, Cambridge.
[4] Codella, N.C., Nguyen, Q.B., Pankanti, S., Gutman, D.A., Helba, B., Halpern, A.C., Smith, J.R. (2017). Deep learning ensembles for melanoma recognition in dermoscopy images. IBM Journal of Research and Development, 61(4/5): 5:1-5:15. https://doi.org/10.1147/JRD.2017.2708299
[5] Celik, Y., Talo, M., Yildirim, O., Karabatak, M., Acharya, U.R. (2020). Automated invasive ductal carcinoma detection based using deep transfer learning with whole-slide images. Pattern Recognition Letters, 133: 232-239. https://doi.org/10.1016/j.patrec.2020.03.011
[6] Talo, M., Yildirim, O., Baloglu, U.B., Aydin, G., Acharya, U.R. (2019). Convolutional neural networks for multi-class brain disease detection using MRI images. Computerized Medical Imaging and Graphics, 78: 101673. https://doi.org/10.1016/j.compmedimag.2019.101673
[7] Gaál, G., Maga, B., Lukács, A. (2020). Attention u-net based adversarial architectures for chest X-ray lung segmentation. arXiv preprint arXiv:2003.10304. https://doi.org/10.48550/arXiv.2003.10304
[8] Coates, A., Ng, A., Lee, H. (2011). An analysis of single-layer networks in unsupervised feature learning. In Proceedings of the Fourteenth International Conference on Artificial Intelligence and Statistics, Fort Lauderdale, FL, USA, pp. 215-223.
[9] Wang, L., Lin, Z.Q., Wong, A. (2020). Covid-net: A tailored deep convolutional neural network design for detection of COVID-19 cases from chest X-ray images. Scientific Reports, 10(1): 19549. https://doi.org/10.1038/s41598-020-76550-z
[10] Rahimzadeh, M., Attar, A. (2020). A modified deep convolutional neural network for detecting COVID-19 and pneumonia from chest X-ray images based on the concatenation of Xception and ResNet50V2. Informatics in Medicine Unlocked, 19: 100360. https://doi.org/10.1016/j.imu.2020.100360
[11] Garg, A., Salehi, S., La Rocca, M., Garner, R., Duncan, D. (2020). Efficient and visualizable convolutional neural networks for COVID-19 classification using Chest CT. arXiv preprint arXiv:2012.11860.
[12] Montalbo, F.J.P. (2021). Diagnosing COVID-19 chest X-rays with a lightweight truncated DenseNet with partial layer freezing and feature fusion. Biomedical Signal Processing and Control, 68: 102583. https://doi.org/10.1016/j.bspc.2021.102583
[13] Sait, U., Lal, K.G., Prajapati, S., Bhaumik, R., Kumar, T., Sanjana, S., Bhalla, K. (2020). Curated dataset for COVID-19 posterior-anterior chest radiography images (X-rays). Mendeley Data. https://doi.org/10.17632/9xkhgts2s6.1
[14] Howard, A., Sandler, M., Chu, G., Chen, L.C., Chen, B., Tan, M., Wang, W., Zhu, Y., Pang, R., Vasudevan, V., Le, Q.V., Adam, H. (2019). Searching for mobilenetv3. In Proceedings of the IEEE/CVF International Conference on Computer Vision, Seoul, Korea (South), pp. 1314-1324. https://doi.org/10.1109/ICCV.2019.00140
[15] Szegedy, C., Vanhoucke, V., Ioffe, S., Shlens, J., Wojna, Z. (2016). Rethinking the inception architecture for computer vision. In Proceedings of the IEEE Conference on Computer Vision and Pattern Recognition, Las Vegas, NV, USA, pp. 2818-2826. https://doi.org/10.1109/CVPR.2016.308
[16] Simonyan, K., Zisserman, A. (2014). Very deep convolutional networks for large-scale image recognition. arXiv preprint arXiv:1409.1556. https://doi.org/10.48550/arXiv.1409.1556
[17] Bello, I., Fedus, W., Du, X., Cubuk, E.D., Srinivas, A., Lin, T.Y., Shlens, J., Zoph, B. (2021). Revisiting ResNets: Improved training and scaling strategies. Advances in Neural Information Processing Systems, 34: 22614-22627.
[18] Tan, M., Le, Q. (2021). Efficientnetv2: Smaller models and faster training. In International Conference on Machine Learning, pp. 10096-10106.
[19] Yaqub, M., Feng, J., Zia, M.S., Arshid, K., Jia, K., Rehman, Z.U., Mehmood, A. (2020). State-of-the-art CNN optimizer for brain tumor segmentation in magnetic resonance images. Brain Sciences, 10(7): 427. https://doi.org/10.3390/brainsci10070427
[20] Shastri, S., Kansal, I., Kumar, S., Singh, K., Popli, R., Mansotra, V. (2022). CheXImageNet: A novel architecture for accurate classification of COVID-19 with chest X-ray digital images using deep convolutional neural networks. Health and Technology, 12(1): 193-204. https://doi.org/10.1007/s12553-021-00630-x
[21] Guidance, W.H.O. (2021). Ethics and governance of artificial intelligence for health. World Health Organization.
[22] Chattopadhay, A., Sarkar, A., Howlader, P., Balasubramanian, V.N. (2018). Grad-cam++: Generalized gradient-based visual explanations for deep convolutional networks. In 2018 IEEE Winter Conference on Applications of Computer Vision (WACV), Lake Tahoe, NV, USA, pp. 839-847. https://doi.org/10.1109/WACV.2018.00097