Vijayalakshmi Venugopal*![]() | Doddananjedevaru Mahesh Kumar
| Doddananjedevaru Mahesh Kumar![]() | Veeramani Selvaraj
| Veeramani Selvaraj![]() | Shiradanahalli Chandrashekaraiah Prasanna Kumar
| Shiradanahalli Chandrashekaraiah Prasanna Kumar![]()
© 2023 IIETA. This article is published by IIETA and is licensed under the CC BY 4.0 license (http://creativecommons.org/licenses/by/4.0/).
OPEN ACCESS
Soil salinization is a leading cause of soil and land degradation, necessitating early detection for efficient soil management. This study presents an integrated approach combining Remote Sensing and Geographic Information Systems (GIS) to identify salt-affected soils, employing the support vector machine (SVM). The research focuses on the town of Ballari in Karnataka, India, an area highly susceptible to soil salinization with severe consequences. To evaluate, monitor, and implement remedial measures, Ballari was selected as the study area. Data inputs for the SVM model were extracted from nine raster layers derived from the 2011 Landsat 9 imagery and DEM SRTM data. These layers include the Digital Elevation Model (DEM), Topographic Roughness Index (TRI), Topographic Position Index (TPI), Aspect, Slope, Normalized Differential Salinity Index (NDSI), Normalized Differential Vegetation Index (NDVI), Normalized Differential Moisture Index (NDMI), and Normalized Differential Built-up Index (NDBI). Topographical parameters, such as slope, aspect, and other metrics derived from DEM, were found to be instrumental in identifying salt-affected soil due to their ability to indicate land surface texture. Spectral indices NDSI and NDVI, computed using Red and NIR bands, along with the SWIR band, were identified as highly effective in delineating salt-affected soils. Following the layer stacking of these nine layers to form a multiband composite image, the data set was divided into a 70:30 ratio for training and testing, respectively. The model demonstrated an overall accuracy of 89.59% and a Kappa coefficient of 0.84, underlining the efficacy of this approach in predicting soil salinity.
remote sensing, soil salinity, salt affected soil, support vector machine (SVM), spectral indices
Soil Salinization, a phenomenon notably prevalent in arid and semi-arid regions, involves the accumulation of water-soluble salts such as chlorides and sulphates [1]. This process detrimentally impacts plant growth and, in turn, agricultural yield by limiting the soil's quality and the plant's water absorption capabilities, leading to plant toxicity and nutrient deficiency. It is thus essential to map and monitor salt-affected soil distributions to maintain soil quality and maximize agricultural productivity.
In addition to its direct impact on plant life, soil salinization also contributes to soil degradation, thereby diminishing soil quality and further reducing crop productivity [2]. Such outcomes negatively affect the economy, particularly in regions where arid and semi-arid climates facilitate salt deposition on the soil surface. Compounding this issue are the poor quality of groundwater and unscientific irrigation practices, both of which exacerbate soil salinization.
Land and soil degradation due to salinity and sodicity has affected approximately 6.73 million hectares of land, resulting in a loss of 16.84 million tons of agricultural productivity [3]. In response to such widespread degradation, precision farming-based strategies offer an effective solution for generating thematic maps to reclaim degraded land and conserve soil resources, thereby preventing further degradation.
Both primary and secondary factors contribute to soil salinization. Primary factors encompass arid and semi-arid climatic conditions, groundwater quality, the presence of water tables, lithological aspects, mineralogical factors, and topographical features. Secondary causes include unscientific irrigation practices and improper leaching and drainage methods.
Estimating environmental variables such as soil pH, Electrical Conductivity (EC), and Exchangeable Sodium Percentage has been found to aid in predicting soil salinity. Traditional methods of estimating and predicting soil salinity through in-situ soil analysis have been deemed time-consuming, expensive, and impractical, especially for larger study areas and depending on the season.
Visual indicators initially identify salt-affected soil, but this qualitative method requires laboratory analysis for quantitative assessment. Soil testing, a weather-dependent process, involves sample collection, testing, and analysis, proving to be labor-intensive, time-consuming, and costly. Moreover, the process requires skilled labor and may be challenging depending on the climate, weather conditions, and the terrain of the study area.
Spatial and temporal soil analysis is required for sustainable management. Several studies have been conducted to correlate spectral soil characteristics with EC. Soil spectral characteristics' analysis through mapping and modeling is essential for efficient usage, conservation, and sustainability. Machine learning approaches have recently been deployed in Digital Soil Mapping for increased accuracy and optimality, with the training process being a critical factor in determining model accuracy. Optimization algorithms must be implemented to identify the exact combination of hyperparameters.
An integrated approach involving Remote Sensing and GIS statistical analysis of environmental variables has proven useful in predicting soil salinity. Machine learning algorithms such as regression, Artificial Neural Networks (ANN), support vector machines (SVM), Decision Trees (DT), and Random Forest (RF) have been deployed for performance assessment and soil salinity prediction, with the choice of algorithm depending on the application and study area.
Support vector machines (SVM) extend the original input data space, transforming non-linear data into a high-dimensional feature space. Compared to non-parametric classifiers, such as Neural Networks and the Nearest Neighbour algorithm, SVM has demonstrated higher accuracy and improved parameter setting. It was discovered that when integrated with multi-source data, SVM-based classification provided superior accuracy. In this context, the Radial Basis kernel was employed in SVM classification. Further, it was established that combining SVM-based classification with textural features generated the most accurate results.
Regression-based machine learning approaches, including Multiple Linear Regression, binary weighted regression, and Random Forest (RF) regression, have been employed in estimating soil salinity. The northern irrigated plain of the Yinchuan oasis, a region characterized by a semi-arid climate, was selected as the study area. A total of 64 environmental variables were evaluated using Landsat 8 imagery from both dry and wet seasons. The research involved determining optimal environmental variables for estimating soil salinity, conducting performance analysis of the three regression models for predicting soil salinity, and mapping its spatial distribution in the area of interest. An attempt was made to correlate image indices with soil EC values. Image textures were extracted from the Grey Level Co-occurrence (GLCM) Matrix, which utilised a 3×3 window size. Indices extracted during the dry season exhibited a higher correlation than those of the wet season. The Normalised Differential Salinity Index (NDSI) displayed the highest correlation with EC and was found to be a significant determinant of soil salinity. Among the models tested, the RF approach showcased superior accuracy, while multiple linear regression produced the largest error. The study concluded that an analysis combining spectral indices and topographical factors was effective in estimating soil salinity. The study serves as a performance comparison of three models: Random Forest Regression, Multiple Linear Regression, and Binary Weighted Regression, and provides substantial evidence for the inclusion of topographic attributes in predicting soil salinity [4].
A different approach incorporated the firefly algorithm and the Multi-Layer Perceptron algorithm (MLP-FFA) to predict soil salinity. The selected study area was Miandoab city, situated in north-west Iran. Landsat 8 images of the study area, with a 10m spatial resolution, were used in the processing. The MLP-FFA, a biologically inspired meta-heuristic algorithm, was employed for the optimization of neurons with respect to their weights and biases, aiming to minimize the root mean square error. The firefly algorithm initiates with the Initialization phase, followed by the Generation phase, Computation of Fitness value phase, Updation phase, and concludes with the Optimum solution phase. During the Initialization phase, the population size, maximum iteration, dimension, and upper and lower bound values are established. The position can be updated using the relation in Eq. (1).
Position=Lower Bound (Upper Bound-Lower Bound).*rand (1,dimension) (1)
The light intensity value or the Fitness Function or the Objective Function can be computed using the relation Eq. (2).
$F(x i)=\sum_{i=1}^n(x i-1)$ (2)
Update the position of each of the fireflies. The random movement of the firefly can be traced by adding the current position with the step size. The distance between any two fireflies can be computed using the distance formula.
Firefly algorithm can be implemented as a solution dynamic problem, to optimize non-linear problems, fault detection and feature selection.
Calibrating and validating of the MLP-FFA has been done on the study area along with identifying the most efficient environmental variables which are suitable to estimate soil salinity has been the main objective of this research. The study concludes by making a performance assessment with the MLP-FFA with standalone MLP. A number of indices were provided as features from which EC was the extracted output. High resolution Google Earth (GE) imagery was used to identify the sampling points and around 80 samples were collected for ground truth verification process [5].
The study area chosen is El Outaya plain for the purpose of mapping soil salinity. The study area falls under the arid climatic zone and the imagery were acquired for the month of July as it is the hottest month of the year. Landsat 8 OLI imagery were used to develop the spectral indices. Comparison of prominent machine learning algorithms such as SVM, simple Kriging, CoKriging (SCOK) and Multilayer Perceptron Neural Networks (MLP-NN) has been summarized in this study. Overall, 136 soil samples were collected from the study area from which EC values were analysed. The samples were segregated in the ratio 80:20 for training and later on for testing phases. MLP-NN exhibited highest accuracy with lower values of errors [6].
Conditional Hypercube Sampling approach was implemented for soil sampling for which the pH, EC and Sodium Absorption Ratio (SAR) were calculated. The training dataset for the RF model was developed by correlating the sampling points with the generated environmental covariates derived from spectral indices. The primary goal of this research was to predict the pH, EC and SAR of soil in order to identify salt affected soil in the study area. Ghorveh region, Kurdistan Province, west of Iran has been considered as the area of interest. The study area falls under arid climate and a total of 295 soil samples were collected. Topographic factor such as quality of ground water, distribution of vegetation and lithology are critical in accurately predicting salt affected soils. Landsat 8 OLI and Sentinel-2A images were used in this study. Ground water table maps, Physiographical categorical maps, geology and land use of the study area were also used to optimally identify salt affected soils. Varied combinations of Genetic algorithm (GA), RF, Bat algorithm and Particle swarm optimization (PSO) algorithms were used for optimization. Out of these it was found that the RF and PSO produced highest accuracy with least error values [7].
Monitoring of soils degraded due to salinization by making use of hyperspectral remote sensing technology has been the main focus of this research work. The SVM and Principal Component Analysis (PCA) based regression algorithms exhibited optimal performance and hence were chosen to be implemented. This research work experimented to understand the possibility of deploying hyperspectral remote sensing in mapping the spatial extent of salt affected soils. The study focused on to assess the soil properties quantitatively such as to correlate the spectral reflectance of soil with that of its salt concentration. The study concluded by stating that the spectral reflectance of soil decreased with increase in levels of soil salinity [8].
Geostatistical analysis of the Ghaghar basin in India has been performed for the purpose of delineating salt affected soils. Mapping of Gypsum requirement for reclamation of the salt affected land for reducing the plant and soil stress caused by sodicity has been the main objective. Overall, 354 soil samples were collected using stratified random sampling technique during the April-May pre-monsoon seasons. PCA was implemented to reducing the dimensions of the dataset as well as to identify the minimum dataset required for processing; thus, PCA acts as a data reduction technique [3].
Flooding has caused land degradation within the Pantanal wetland. The mineral diversity of the samples suggests that the change in clay minerals occurs gradually through mixed-layering processes rather than through total breakdown and subsequent precipitation. Fresh water inclusion further increases the extent of salinity levels which hampers the concentration of clay minerals. As cation leaching and progressive acidification advance in the impacted soil systems, the sequential processes result in the creation of transient phases among the various clay types [9].
The exchangeable sodium percentage (ESP) is the best indicator of soil sodicity, although calculating this index requires a lot of work and time. As an alternative, a less complex indicator called the sodium adsorption ratio (SAR) is frequently employed to calculate soil sodicity. This study aims to calculate the ESP using four different methods such as assessing the SAR using the saturated paste, evaluating a conversion factor represented as a function of percentage of saturation, electrical conductivity and implementing Generalised Regression Neural Networks (GRNN). While the technique lessened the impact of the data on the predictive model’s capacity, GRNN models can precisely forecast the ESP based on simple soil characteristics. These models offer a potentially useful tool for landscapes management which are at a risk of degradation. They provide a quick and accurate estimate of soil sodicity [10].
This research work contributes in assessing the quality of soil which has been affected by salinity for optimizing crop yield. Soil Quality Indices (SQI) were evaluated and assessed for the coastal regions in the west of India. A total dataset (TDS) and a minimal dataset (MDS) were used to generate the SQIs. An MDS was created using PCA and correlation analysis, The linear weighted and non-linear weighted SQI based on MDS that were successful in evaluating the SQ of acid soils impacted by salt had substantial and adverse correlations with EC of 0.83 and 0.70 (p 0.01), respectively. It is evident that the SQ significantly decreases when soil salinity rises. The ability of the MDS-based SQIs to distinguish between various soil salinity classes were superior to that of the TDS. Therefore, utilising MDS, linear scoring and the weighted technique of the soil quality indexing to evaluate the SQ of salt-affected acid soils could be economical [11].
This research outlines an attempt to categorise salt-affected soil using an enhanced SVM classifier. In this study, thematic data for soil damaged by salt using a support vector machine using texture features were extracted. The SVM method was contrasted with the suggested SVM method. The findings showed that identification of salt affected soil for the Yinchuan Plain may be successfully extracted using the SVM classifier method here. In particular the accuracy was 84.6974% and Kappa coefficient obtained was 0.8202, demonstrating its robustness to different techniques of classification. Texture features will be helpful in identifying objects when their spectral features are comparable. Combining textural features and spectral features will aid in increasing the accuracy of classification in the absence of significant prior knowledge. It has been demonstrated that SVM classification using texture characteristics produced classification results exhibit higher accuracy than compared to other features. The outcomes of these tests show that the GLCM offers a reliable way to compute the texture features that are capable of accurately describing the spatial distributions and structural traits of the neighbouring pixels. However, in order to reduce run time and enhance accuracy, the texture feature must be chosen while employing an SVM [12].
This study aims to assess the extent of land degradation taking into account human-induced causes, biophysical parameters, and climate parameters. Geospatial analysis employs a hierarchy-based indexing mechanism. According to a study, 27% of the land area is considered to be moderately vulnerable, while 67% of the land area is classified as high susceptibility. This study supports in urban planning and helps to avert further deterioration of land and soil by planning land reclamation strategies. According to the validation using MODIS Land Surface Temperature (LST) and NDVI datasets, the results exhibited an increase in surface temperature between 2001 and 2019 and no change in NDVI [13].
In the study [13], three distinct regions of Catalonia, Poland, and Romania, Sentinel-2 and Landsat 8 satellite pictures were used to evaluate classification accuracy. SVM and RF algorithms were compared for their performances and accuracy parameters. Using randomised training, test, and verification pixels iteratively helped to reduce classification bias. Reproducing the results and making them comparable is made easy by the simplicity of implementation. The findings indicate that RF is the second-best classifier, followed by an SVM with a radial kernel. It specifies the high accuracy classes that can be updated and the classes that need to be redefined [14].
In the study [15], research work focused on extracting green cover using satellite images for the urban towns of Croatia [15].
In the study [16], the research work performs change detection of urban areas and their assessment for the study area Ballari city, located in Karnataka, India for the duration 1989 to 2010. NDVI values were computed for all the images to analyse the changes in land cover during the period of study. Initially the False Color Composite (FCC) was generated using the green, red and NIR bands of the dataset. During the training phase, GPS data was collected and then verified with GE images, after which the training polygons were generated. The dataset was divided into 60:40 for training and testing operations respectively. Gaussian maximum Likelihood Classifier was implemented to classify the study area into following classes: urban areas, water bodies, vegetation and others [16].
In the study [17], Landsat 8 OLI imagery of Dan City, China has been used to estimate soil salinity by using a combination of Regression algorithm with other machine learning algorithms such as Cubist, SVM, RF and Extreme Gradient Boosting. The study focuses on developing 15 salinity indices, 3 vegetation indices and a brightness index to map the spatial distribution and extent of soil salinity as well as to correlate the changes in land cover with that of soil salinity. Performance analysis of machine learning algorithms have been done to control the effects of land degradation. It has been seen that only continuous variables could be used in Regression models. The study proved that the performance of SVM based regression depended on the value of sample points. RF seemed to be more ideal as it was found to be immune to noise effects and speedy processing of a large number of independent variables. The Cubist model based with Regression is recommended for higher degrees of soil salinity [17].
Landsat 9 imagery of Ballari town, Ballari district of 3rd February 2023 was downloaded from Earth Explorer Portal. The image was downloaded during the summer season with cloud cover less than 5% [18]. Out of the 11 bands of Landsat 9, 6 bands as shown in Table 1 which were of 30m resolution were layerstacked to obtain the multiband composite image to form the input dataset.
Generally during the month of February, the land would be dry and the images were acquired in the beginning of summer season so that there would be no water content in soil.
The band representations with respect to their frequencies are as shown in Table 1.
Table 1. Landsat 9 bands
|
Band Number |
Band Name |
Frequency Range in µm |
Resolution in m |
|
Band 2 |
Visible blue |
0.450-0.51 |
30 |
|
Band 3 |
Visible green |
0.53-0.59 |
|
|
Band 4 |
Visible red |
0.64-0.67 |
|
|
Band 5 |
Near infrared (NIR) |
0.85-0.88 |
|
|
Band 6 |
Short wave infrared-1 (SWIR) |
1.57-1.65 |
|
|
Band 7 |
Short wave infrared-2 |
2.11-2.29 |
3.1 Study area
Ballari districyt is identified at the eastern side of Karnataka state in south of India. The district lies between the co-ordinates 14°30’ and 15°50’ north latitude and 75°40’ and 77°11’ east longitude. Raichur, Chitradurga, Davangere form the neighboring districts of Ballari. It houses a total area of 8447 sq. km. There are a total of seven taluks viz. Ballari, Sandur, Siruguppa, Hadagali, Hospet, Kudligi, H.B. Halli, Ballari taluk. Ballari town occupies an area of 180.7 sq. kms. This district receives an average rainfall of 639mm during the months August to October. Agriculture has become the main occupation of this district as over 70% of the total labor force is dependent on agriculture for their livelihood. The study area, Ballari is a town in Ballari taluk and occupies an area of 92.7 sq kms with latitude 15.15 N and longitude 76.93 E. Black cotton is the most prominent type of soil amidst arid climatic zone. Ballari Hills and the Kumbara Gudda hills are spread around the city. The average temperature of the city is 34.1℃.
Ballari, a district belonging to Karnataka, experiences frequent droughts due to arid climate and scanty rainfall. Under the United Nations Convention to Combat Desertification (UNCCD) programme, this district had been taken up as a pilot project for assessing the desertification process. This project mapped the desertification status of the district after which soil reclamation programmes were initiated. While extensive mining activities were one of the causes for land degradation in the entire district, soil salinization and alkalinization caused deterioration in the soil quality. It was found that the soil salinization and alkalinization processes dominantly occurred in black soils and which adversely affected agricultural yield. Thus, it became crucial to identify salt affected soil for land and soil conservation [19].
Within the study area, the process of salinization has significantly deteriorated the quality of soil thus resulting in land becoming barren and desertified. Hence it is of immediate concern to formulate methodologies to identify and delineate salt affected soil so that reclamation measures could be taken up.
Conventional methods of estimating soil salinity involve soil sample collection and laboratory analysis through which the EC of soil is measured. It has been found that presence of EC is a direct indicator of salt affected soil. This method is tedious and time consuming.
Thus, technically advanced methods such as integrated approaches involving Remote Sensing and GIS are adopted for the purpose of soil and land conservation. In this paper, GIS has been effectively used to identify salt affected soil within the study area.
3.2 Methodology
The objectives of this research work are to:
1. Generate an optimal feature set which includes a combination of topographical variables and spectral indices for predicting soil salinity.
2. Implement SVM to predict soil salinity.
Topography refers to the shape of the Earth’s surface and its characteristic features [20]. TRI, TPI and Aspect were evaluated from DEM SRTM 2011 data of the study area [2]. Table 2 refers to the Spectral Indices and band ratios that were calculated.
Aspect ratio of an image is defined as the ratio of the image width to its height. The image in Figure 1 shows the aspect ratio of input dataset. Inclusion of the aspect ratio as a raster input layer in the training phase for the SVM model ensures efficient object detection as well as training process. Low and high aspect ratios ranged between-9999 and 359.657 respectively.
Figure 2 and Figure 3 shows the DEM and NDBI of input dataset. NDBI is evaluated using the ratio of NIR and SWIR bands of the input dataset as shown in Table 2. It was observed that lower values of NDBI represents vegetation while higher values represent built-up areas and negative values represent water bodies. A value of -0.355 was considered as the minimum value of NDBI and 0.137 as the highest value.
Figure 4 represents the NDMI map of the study area. NIR and SWIR bands have been used to generate the NDMI map as these two bands produce the combined effect of removing variations from the internal structure of the leaf along with the dry matter content present within the leaf. This ensures that the moisture content present in the vegetation has been represented optimally. A value of 0.355 was considered as the maximum value of NDBI and -0.137 as the minimum value. To mitigate the effects of soil moisture on the reflectance, it is required to generate a model which is insensitive to soil moisture which acts as a foundation in identifying salt affected soil [21].
Table 2. Spectral indices
|
Spectral Function |
Band Ratios |
|
NDSI |
(R–NIR)/(R+NIR) |
|
NDVI |
(NIR–R)/(NIR+R) |
|
NDMI |
(NIR–SWIR)/(NIR+SWIR) |
|
NDBI |
(SWIR–NIR)/(SWIR+NIR) |
Figure 1. Aspect ratio map
Figure 2. DEM map
Figure 3. NDBI map
Figure 4. NDMI map
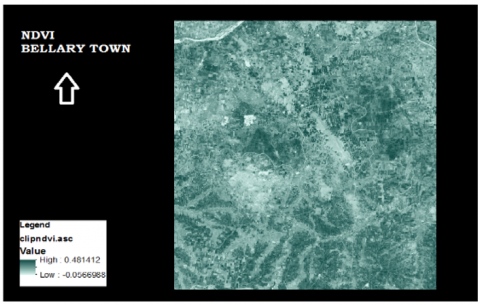
Figure 5 represents the NDVI map of the study area. It is the most popular and significant vegetation index. It has been observed that healthy green vegetation absorbs electromagnetic radiation in the visible region of the spectrum. The presence of chlorophyll enables the absorption of blue and red frequencies while it reflects the green radiation. Since healthy vegetation exhibit high reflectance in the NIR region and high absorption in the red region, these two bands are used to evaluate the NDVI. While NDVI values ranging from 0.6 to 1.0 indicate thick vegetation, 0.2 to 0.5 indicate shrubs, -0.1 to 0.1 indicate barren rocks or sand and -1 to 0 indicate water bodies. A value of -0.056 has been the minimum value and 0.481 maximum value of NDVI. This range of NDVI values indicate that the study area consists of shrubs which are randomly scattered with no traces of vegetation and the land seems to be barren. NDVI values assists in estimating the developing stages of the vegetation and also indicates the amount of greenness within the pixel.
Figure 5. NDVI map
SVM is a supervised machine learning classification algorithm very popularly used for mapping changes in LULC. In this approach a hyperplane is developed which separates the data points into a number of classes. In this research work, SVM has been implemented to find the distribution and extent of soil salinization by classifying the study area into the following classes: water bodies, low saline, medium saline, high saline and no salinity. The hyperplanes are constructed such that the distance between the classes is maximum and that classes are homogeneous. Training process plays a key role in determining the accuracy of the algorithm [22].
Initially the scheme of classification is to be determined. In this work as mentioned earlier, the study area is classified into 5 classes which are water bodies, low saline, medium saline, high saline and no salinity.
The two critical factors that decide the performance of a classifier are selecting a model and determining an appropriate feature sub-space to carry out the classification.
SVMs can be described as a binary classifier with supervised learning mechanism where the training set consists of a set of vectors V, from a feature space S whose dimension is d.
Each of the vectors vi can be represented as in Eq. (3):
$v_i \in R^d(i=1,2, \ldots, V)$ (3)
In the linear mode, SVM algorithm classifies the dataset into two classes with the help of a hyperplane. In case of non-linear datasets, the SVM transforms the input dataset into a high dimensional feature space Φ (S) by using the kernel method as in Eq. (4).
$\Phi(S) \in R^{d^{\prime}}\left(d^{\prime}>d\right)$ (4)
If f(x) represents the discriminant function which is associated with the hyperplane in the transformed feature space, then it is given by the expression as in Eq. (5).
$f(x)=z^* \cdot \Phi(x)+a^*$ (5)
It is to be noted that z* represents the optimum hyperplane, where, z*$\in$Rd'and a* which is the bias $\in$R [21].
In research works [23, 24], a robust model was developed using SVM which was integrated with biophysical factors for the quantitative assessment and monitoring of soil salinity within the study area Yanqi Basin, Xinjiang, China. The performance of SVM showed highest accuracy when compared to ANN. In this research work the performance of the algorithms were compared with the EC values in the validation phase. It proved that SVM showed optimal results in predicting soil salinity.
In the study [25], SVM, a supervised learning classification algorithm is found to be robust in handling high dimension data. It exhibits high efficiency during the training phase. SVMs show higher accuracy to classifying land cover types than compared to Maximum Likelihood Classification, Decision trees and Multi-layer Perceptron Neural Networks. Since training phase is crucial in SVM, the pixels to be trained should be of homogeneous nature to attain highest accuracy.
It was evident that SVM showed much accuracy with overall accuracy value being 92% and Kappa Co-efficient value being 0.89 while maximum Likelihood classifier showed overall accuracy of 87% with kappa coefficient value 0.83 [25, 26].
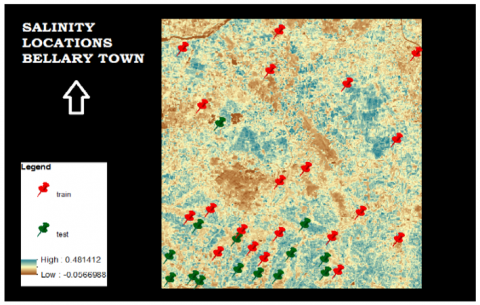
Figure 6 shows the input image being divided in the ratio 70:30 for training and testing operations respectively. Classification is the process of extracting useful information from images. SVM which is a supervised classification technique has been implemented in this work.
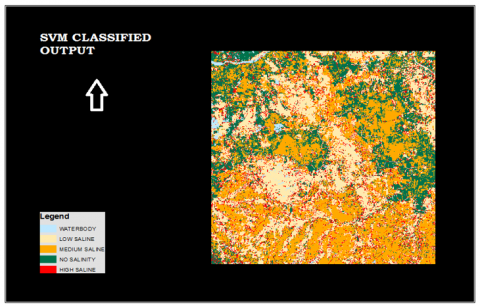
Making use of the ground truth data, the classified image was verified. Figure 7 shows the SVM classified image which identified the salt affected areas.
The study area was delineated based on the different levels of salinity as highly saline, medium saline, low saline and no salinity regions as shown in Figure 7.
Confusion matrix was generated which gave the values of overall accuracy and Kappa co-efficient which were found to be 89.59% and 0.84 respectively. The actual and predicted pixel classification percentage has been tabulated in Table 3.
The accuracy can be further improved by increasing the training samples to the model and also by increasing the resolution of input dataset.
Figure 6. Training and testing points
Figure 7. SVM based classified image
Table 3. Confusion matrix
|
High Saline |
No Salinity |
Medium Saline |
Low Saline |
Water Body |
|
|
Unclassified |
0 |
0 |
0 |
0 |
0 |
|
High saline |
93.16 |
0.84 |
0 |
0.65 |
2.54 |
|
No salinity |
0.85 |
93.81 |
0.38 |
0.61 |
7.85 |
|
Medium saline |
0 |
1.55 |
83.99 |
1.75 |
4.39 |
|
Low saline |
2.14 |
0.42 |
13.94 |
93.95 |
26.1 |
|
Water body |
3.85 |
3.38 |
1.69 |
3.04 |
59.12 |
|
Total |
100 |
100 |
100 |
100 |
100 |
This work focussed on how to identify the salt affected soil within the study area. Thus, the study area was classified into water bodies, low salinity, medium salinity, no salinity and high salinity classes so that appropriate reclamation measures could be taken up for soil and land conservation. It also serves as a basis for farmers and other individuals to plan cultivation of salt tolerant crops in the next cycle.
In this investigation, salinity maps were constructed for the study area, utilising multi-spectral characteristics and textural features as data sources for the SVM classification. SVM, a robust and potent tool used for both classification and regression tasks, is effective in accommodating high-dimensional datasets and can be applied to both binary and multi-class classification scenarios. A hyperplane is constructed, positioned such that it maximises the distance between the classes, with support vectors representing the points closest to the hyperplane. The SVM strives for margin maximisation, where the margin is defined as the distance between two classes.
The technique of Band ratioing was employed in this study to evaluate the Spectral indices, wherein nine raster layers were analysed and supplied to the SVM model for classification, aimed at delineating salt-affected soils. A prevalent challenge in the classification of salt-affected soil was the identical reflectance values exhibited by sand and salt-affected soil, leading to misclassification. To counter this, a combination of spectral indices was selected and evaluated to enhance the classification accuracy.
The feature selection and extraction process play a pivotal role in Land Use/Land Cover (LULC) classification and change detection studies. LULC Maps serve as a foundation in land planning and urban development [27]. In this work, a combination of topographic features and spectral indices were chosen to optimise the identification of salt-affected soil. Topographic features, including aspect, slope, Terrain Ruggedness Index (TRI), and Topographic Position Index (TPI), were extracted from the Digital Elevation Model (DEM). Selected spectral indices included Normalised Differential Salinity Index (NDSI), Normalised Differential Moisture Index (NDMI), and Normalised Differential Built-up Index (NDBI), thereby enhancing the classification accuracy.
The SVM classification algorithm used in this study yielded an overall accuracy and Kappa co-efficient of 89.59% and 0.84, respectively, indicating that approximately 89% of the classification results were consistent with ground truth values. Notably, there were no unclassified pixels in this method.
To further enhance classification accuracy, the inclusion of the Normalised Differential Nitrogen Index (NDNI) may prove beneficial, as it represents soil alkalinity, where lower levels signify higher salinity. NDNI assesses soil nitrogen content using the Near-Infrared (NIR) and Red bands. Higher NDNI values denote a higher concentration of nitrogen, reflecting increased chlorophyll levels and, by extension, vegetation quantity. Nitrogen content indirectly influences soil salinity, as salinity levels alter the soil structure. Hence, nitrogen-based irrigation practices can aid in maintaining plant growth and soil structure. To mitigate soil salinity effects and balance overall soil nutrient concentration, nitrogen-based fertilisation could be a potential solution.
The identification and classification of salt-affected soil can underpin reclamation programmes, whereby remedial actions can be undertaken by individuals or organisations to maintain and monitor soil quality. Such measures, including the cultivation of salt-tolerant crops, well-planned irrigation practices, and judicious use of fertilisers, can contribute significantly to land and soil conservation.
|
DEM |
digital elevation model |
|
SRTM |
shuttle radar topography mission |
|
SVM |
support vector machine |
|
TRI |
Topographic Roughness Index |
|
TPI |
Topographic Position Index |
|
NDSI |
normalised differential salinity index |
|
NDVI |
normalised differential vegetation index |
|
NDMI |
normalised differential moisture index |
|
NDBI |
normalised differential built-in index |
|
ANN |
artificial neural networks |
|
DT |
decision trees |
|
GPS |
global positioaning system |
|
GIS |
geographic information system |
|
MLP-FFA |
multi layer perceptron-fire fly algorithm |
|
GLCM |
grey level co-occurrence matrix |
|
SCOK |
simple kriging, cokriging |
|
SAR |
sodium absorption ratio |
|
OLI |
operational land imager |
|
PSO |
particle swarm optimization |
|
PCA |
principal component analysis |
|
GRNN |
generalised regression neural networks |
|
SQI |
soil quality indices |
|
MDS |
minimal dataset |
|
LST |
land surface temperature |
|
TDS |
total dataset |
|
FCC |
false color composite |
|
GE |
google earth |
|
UNCCD |
united nations convention to combat desertification |
|
EC |
electrical conductivity |
[1] Stavi, I., Thevs, N., Priori, S. (2021). Soil salinity and sodicity in drylands: A review of causes, effects, monitoring, and restoration measures. Frontiers in Environmental Science, 9. https://doi.org/10.3389/fenvs.2021.712831
[2] Dehni, A., Lounis, M. (2012). Remote sensing techniques for salt affected soil mapping: Application to the Oran region of Algeria. Procedia Engineering, 33: 188-198. https://doi.org/10.1016/j.proeng.2012.01.1193
[3] Barman, A., Sheoran, P., Yadav, R.K., Abhishek, R., Sharma, R., Prajapat, K., Singh, R.K., Kumar, S. (2021). Soil spatial variability characterization: Delineating index-based management zones in salt-affected agroecosystem of India. Journal of Environmental Management, 296: 113243. https://doi.org/10.1016/j.jenvman.2021.113243
[4] Li, Z., Li, Y., Xing, A., Zhuo, Z.Q., Zhang, S.W., Zhang, Y.P., Huang, Y.F. (2019). Spatial prediction of soil salinity in a semiarid oasis: Environmental sensitive variable selection and model comparison. Chinese Geographical Science, 29: 784-797. https://doi.org/10.1007/s11769-019-1071-x
[5] Pouladi, N., Jafarzadeh, A.A., Shahbazi, F., Ghorbani, M.A. (2019). Design and implementation of a hybrid MLP-FFA model for soil salinity prediction. Environmental Earth Sciences, 78: 1-10. https://doi.org/10.1007/s12665-019-8159-6
[6] Boudibi, S., Sakaa, B., Benguega, Z., Fadlaoui, H., Othman, T., Bouzidi, N. (2021). Spatial prediction and modeling of soil salinity using simple cokriging, artificial neural networks, and support vector machines in El Outaya plain, Biskra, southeastern Algeria. Acta Geochimica, 40: 390-408. https://doi.org/10.1007/s11631-020-00444-0
[7] Nabiollahi, K., Taghizadeh-Mehrjardi, R., Shahabi, A., Heung, B., Amirian-Chakan, A., Davari, M., Scholten, T. (2021). Assessing agricultural salt-affected land using digital soil mapping and hybridized random forests. Geoderma, 385: 114858. https://doi.org/10.1016/j.geoderma.2020.114858
[8] Mahajan, G.R., Das, B., Patel, K., Kulkarni, A., Morajkar, S., Kulkarni, R., Gaikwad, B. (2019). Monitoring properties of the salt-affected soil of the coastal region of India using hyperspectral remote sensing. International Salinity Conference. https://doi.org/10.13140/RG.2.2.26824.16647
[9] Andrade, G.R.P., Furquim, S.A.C., do Nascimento, T.T.V., Brito, A.C., Camargo, G.R., de Souza, G.C. (2020). Transformation of clay minerals in salt-affected soils, Pantanal wetland, Brazil. Geoderma, 371: 114380. https://doi.org/10.1016/j.geoderma.2020.114380
[10] Mahajan, G., Das, B., Morajkar, S., Desai, A., Murgaokar, D., Kulkarni, R., Sale, R., Patel, K. (2020). Soil quality assessment of coastal salt-affected acid soils of India. Environmental Science and Pollution Research, 27: 26221-26238. https://doi.org/10.1007/s11356-020-09010-w
[11] Gharaibeh, M.A., Albalasmeh, A.A., Pratt, C., El Hanandeh, A. (2021). Estimation of exchangeable sodium percentage from sodium adsorption ratio of salt-affected soils using traditional and dilution extracts, saturation percentage, electrical conductivity, and generalized regression neural networks. Catena, 205: 105466. https://doi.org/10.1016/j.catena.2021.105466
[12] C ai, S.M., Zhang, R.Q., Liu, L.M., Zhou, D. (2010). A method of salt-affected soil information extraction based on a support vector machine with texture features. Mathematical and Computer Modelling, 51(11-12): 1319-1325. https://doi.org/10.1016/j.mcm.2009.10.037
[13] Parmar, M., Bhawsar, Z., Kotecha, M., Shukla, A., Rajawat, A.S. (2021). Assessment of land degradation vulnerability using geospatial technique: A case study of Kachchh District of Gujarat, India. Journal of the Indian Society of Remote Sensing, 49: 1661-1675. https://doi.org/10.1007/s12524-021-01349-y
[14] Dabija, A., Kluczek, M., Zagajewski, B., Raczko, E., Kycko, M., Al-Sulttani, A.H., Tardà, A., Pineda, L., Corbera, J. (2021). Comparison of support vector machines and random forests for Corine land cover mapping. Remote Sensing, 13(4): 777. https://doi.org/10.3390/rs13040777
[15] Kranjčić, N., Medak, D., Župan, R., Rezo, M. (2019). Support vector machine accuracy assessment for extracting green urban areas in towns. Remote Sensing, 11(6): 655. https://doi.org/10.3390/rs11060655
[16] Ramachandra, T.V., Bharath, H.A. (2013). Spatio temporal patterns of urban growth in Bellary, Tier II City of Karnataka State, India. International Journal of Emerging Technologies in Computational and Applied Sciences, 3(2): 201-212.
[17] Ge, H.T., Han, Y., Xu, Y.P., Zhuang, L.J., Wang, F.Y., Gu, Q.Y., Li, X.J. (2023). Estimating soil salinity using multiple spectral indexes and machine learning algorithm in Songnen Plain, China. IEEE Journal of Selected Topics in Applied Earth Observations and Remote Sensing, 16: 7041-7050. https://doi.org/10.1109/JSTARS.2023.3274579
[18] Landsat 9 data users handbook, (2022). USGS. https://www.usgs.gov/media/files/landsat-9-data-users-handbook.
[19] Budihal, S.L., Raj, K.G., Reddy, R.S., Natarajan, A., Paul, M.A., Thomas, J.V., Arya, A.S., Ajai, Bandyopadhyay, S. (2006). Assessment and mapping of desertification status in Bellary district, Karnataka State, using IRS data. In ISPRS Commission IV International Symposium on Geospatial Databases for Sustainable Development, Goa, 25-30.
[20] Habib, M. (2021). Quantifying topographic ruggedness using principal component analysis. Advances in Civil Engineering, 2021: 1-20. https://doi.org/10.1155/2021/3311912
[21] Wang, Q., Li, P.H., Chen, X. (2012). Modeling salinity effects on soil reflectance under various moisture conditions and its inverse application: A laboratory experiment. Geoderma, 170: 103-111. https://doi.org/10.1016/j.geoderma.2011.10.015
[22] Shrestha, D. (2023). Support vector machines (SVM) for land cover mapping. https://www.linkedin.com/pulse/support-vector-machines-svm-land-cover-mapping-dinesh-shrestha/.
[23] Bazi, Y., Melgani, F. (2006). Toward an optimal SVM classification system for hyperspectral remote sensing images. IEEE Transactions on Geoscience and Remote Sensing, 44(11): 3374-3385. https://doi.org/10.1109/TGRS.2006.880628
[24] Jiang, H., Rusuli, Y., Amuti, T., He, Q. (2019). Quantitative assessment of soil salinity using multi-source remote sensing data based on the support vector machine and artificial neural network. International Journal of Remote Sensing, 40(1): 284-306. https://doi.org/10.1080/01431161.2018.1513180
[25] Shi, D., Yang, X.J. (2015). Support vector machines for land cover mapping from remote sensor imagery. Monitoring and Modeling of Global Changes: A Geomatics Perspective, 265-279. https://doi.org/10.1007/978-94-017-9813-6_13
[26] Jamsran, B.E., Lin, C., Byambakhuu, I., Raash, J., Akhmadi, K. (2019). Applying a support vector model to assess land cover changes in the Uvs Lake Basin ecoregion in Mongolia. Information Processing in Agriculture, 6(1): 158-169. https://doi.org/10.1016/j.inpa.2018.07.007
[27] Vijayalakshmi, V., Mahesh Kumar, D., Prasanna Kumar, S.C. (2023). Principal Component Analysis of LISS—III Images Using QGIS. In: Agrawal, R., Kishore Singh, C., Goyal, A., Singh, D.K. (eds) Modern Electronics Devices and Communication Systems. Lecture Notes in Electrical Engineering, vol 948. Springer, Singapore. https://doi.org/10.1007/978-981-19-6383-4_38