Rasaq A. Kazeem | John U. Amakor | Omolayo M. Ikumapayi* | Sunday A. Afolalu | Wasiu A. Oke
© 2022 IIETA. This article is published by IIETA and is licensed under the CC BY 4.0 license (http://creativecommons.org/licenses/by/4.0/).
OPEN ACCESS
The energy sector is considered one of the most sensitive sectors to climate change. Climate change has a considerable impact on environmental weather parameters such as temperature, humidity, radiation from the sun, precipitation, sunshine hours, wind direction, etc. These meteorological considerations have an impact on the electricity consumption rate. As a result, knowing the influence of weather conditions on energy demand and consumption is critical for adapting, planning, and forecasting the impact of changing climate on an organization's energy needs. Several factors influencing electricity consumption can be classified as economic, seasonal, and meteorological factors. This research aims to look at the influence of climate change on energy supply in a typical agricultural institute and utilize Artificial Neural Network (ANN) and Multivariate Linear Regression (MLR) models to predict the impact of changes in temperature on electricity generated. The approach used in this study includes: Creating a database of weather variables and energy demand or consumption parameters; analyzing and correlating electrical energy demand to weather variables, developing models - Multivariate Linear Regression (MLR) and Artificial Neural Networks (ANN) to forecast the impact of change in the weather variables on the electrical energy. “Average temperature” was seen to have the most influence on electrical energy with the highest correlation (r = 0.92 for 2015 and r = 0.86 for 2011 - 2018), while “Wind speed” had the least influence with the lowest correlation (r = 0.033 for 2011 - 2018). The ANN model was the best of the two models considered in this study. The mean squared error was reduced by 39% and 42% on test data and train data, respectively, indicating that ANNs outperformed the MLR model. Other measures, such as Mean Absolute Error (MAE) and Mean Absolute Percentage Error (MAPE), showed that the ANN performed substantially better than the MLR. The results suggest that ANN models perform relatively well since the algorithm learns independently and develops a reasonably accurate representation of the dataset.
artificial neural network, climate change, energy consumption, Multivariate Linear Regression
The energy sector is one of the most vulnerable sectors to climate change. In recent years, the Federal Government of Nigeria has worked hard to reform the energy sector. Some of the issues that concern decision-makers across the globe include the level of impact climate change is having on the energy sector and the available strategies or mechanisms to cope with this critical threat to humanity in the twenty-first century. Energy is an essential contributor to the advancement of any economy because it is a vital component to the growth and development of any nation [1] and systematic to increasing the competitiveness of its economy [2]. Because the energy industry is critical to a country's development and growth, reliable and sufficient electricity generation is required to support economic activity and industrial development efforts to raise income and living standards. This is demonstrated by the fact that any shock to the sector automatically ripples through the economy, as all industries require energy to function. As a result, virtually all economic activity involves the use of energy, and it is critical to be able to obtain enough energy at a reasonable cost (both economically and environmentally), giving rise to the concept of "energy security" [3].
On the other hand, the climate has been diversely defined in the literature as a long-term change in the weather conditions of a geographical area that can be ascribed to natural variability and human-induced (artificial) operations. According to the Intergovernmental Panel on Climate Change (IPCC) definition, the climate is a significant statistical difference that lasts for a long time, usually decades or more. Changes in the frequency and amplitude of random weather events and a slow but steady rise in global mean surface temperature are all part of it [4]. It is considered one of the significant threats to society in the 21st era. Its impact on different sectors of the economy, including the energy industry, has sparked a lot of policy debate, even on a worldwide scale. Because its impact pervades all economic sectors, it has implications for long-term national development in sustainable development, equity, and growth [1]. Increasing temperatures and switching rainfall patterns are signs of climate change. Nigeria's current episode with periodic droughts and extreme flooding are all indicators that the nation's climate change is happening. The Nigerian government attaches great importance to selecting an effective response to the issue of climate change, and the National Adaptation Strategy and Plan of Action on Climate Change for Nigeria (NASPA-CCN) is one of those measures taken.
According to scientific studies and findings made available to policymakers, climate change will harm the energy sector [5, 6]. Shifting climate patterns are likely to limit the supply of safe, viable, and reliable energy, which is essential to the growth of the economy [7]. And the changing climate will have a substantial impact on the energy industry in various ways [6]. It can occur when factors such as increased temperatures, abnormal precipitation, and rising sea levels, among many others, impact energy facilities and the way to generate energy, primarily through thermal and hydro sources. According to Woodley [8], hydroelectricity is the form of energy most frequently identified to be impacted by climate change because it is susceptible to timing, precipitation amount, temperature, and geographical pattern. According to the report, low water flows and increased temperature reduce thermal electricity generation capabilities, while higher temperatures also minimize transmission capabilities. Besides that, severe drought causes increased evapotranspiration, which reduces water volume and thus hydroelectric potential. In addition, extreme weather events caused by climate change, such as floods and windstorms, will hasten the failure of electric utility transmission systems [8] and temporarily disrupt energy infrastructure and, therefore, energy supply [3].
A good example is the effect of Hurricane Katrina, which hit the Gulf of Mexico in 2005 and shut down a substantial portion of the United States' oil and gas production and processing capability. For scheduling, day-to-day control, operation, stability, and power system planning, accurate electricity demand forecasting for a short horizon is critical. Probabilistic variables and weather variables are the essential factors that influence prediction performance. Due to Nigeria's tropical climate, the marginal impact of climate variability on electricity consumption is worth investigating. Electricity consumption varies due to customers' erratic behaviour; however, some predictable patterns can be determined, such as weekly, daily, and seasonal. Intraday trends are attributed to variations in demand during the day, night, and morning hours. The research scientist has two options for dealing with these intraday patterns: the first is to allocate the individual variables for each hour/half-hour, while the other method is to create separate models for each hour/half-hour to eliminate intraday seasonality.
Non-working and working days also contribute to weekday seasonal variation. The relationship of these seasonal variables is incorporated in the Institute of Agriculture data set to enhance forecasting accuracy. The energy industry is among the most weather-sensitive economic sectors. Several factors for determining electricity demand can be classified as economic variables, schedule effects, and meteorological conditions [9]. Climate change significantly impacts weather variables, such as temperatures, humidity, solar radiation, rainfall, sunshine hours, winds speed, etc. These weather factors also have an impact on electricity demand and consumption. Adapting to climate change entails concentrating on activities that reduce the adverse effects of the change while also taking advantage of every opportunity it presents [4]. The ability to plan and forecast the impact of changing climate on an organization's energy needs would provide a thorough understanding of the influence and impact of weather variables on energy demand and consumption. The project models the effect of weather variables such as temperature on a typical agricultural research institute's electricity demand and consumption, including forecasting the impact of implementing this variable on energy demand. The objectives of this research include: (i) To determine electricity and weather pattern within six (6) years spectrum at an agricultural research institute. (ii) To analyze and develop models that simulate the influence of change in weather variables on electricity demand and consumption. (iii) To forecast the impact of change in weather variables on electricity demand and consumption. (iv) To recommend measures to take advantage of the opportunities created by changing climate. The study uses the electricity and weather data from the International Institute of Tropical Agriculture in Ibadan, Nigeria, from 2012 to 2018. It analyzes the impact of changes in daily atmospheric minimum and maximum temperatures on electricity demand.
As a result of climate change, weather and environmental conditions constantly change and become increasingly extreme. African countries, such as Nigeria, are especially vulnerable to climate change due to low infrastructure development and poverty [4]. The economic, social, and political development of a nation is dependent on energy, specifically electrical energy. The use of fossil fuels harms the climate, while renewable energy sources (hydro, wind, wave, geothermal, solar, biogas, and biomass) positively impact the environment. As a result, the demand and supply of electricity from these energy sources (hydro, wind, and solar) largely depend on weather variables. Staffell and Pfenninger [10] asserted that in recommending, planning, and managing the transition to renewable generation, it is critical to understand weather variability and its impact on the power system. These weather variables should also be included in electricity demand models to improve model accuracy and predictive power and provide energy managers with a deeper understanding of the effects on energy needs [9]. Due to the rising impact of changing climate and weather conditions, it is necessary to understand their expected effect on energy demand and consumption to plan and project future energy needs.
Therefore, this study presented an in-depth understanding of the influence and impact of weather variables on energy generation and consumption to plan and forecast the impact of the changing climate on the energy needs of an organization with a specific focus on Nigeria. The study focused on analyzing the case study area's historical weather and energy data. It used mathematical models to represent and forecast the impact of the change in weather variables on energy. It focused on the significant differences between Traditional Machine Learning (MLR) processes and Modern techniques using Artificial Neural Network. It was found that ANNs performed much better than the MLR model as the mean squared error was reduced by 39% and 42% on test data and train data, respectively.
1.1 Energy models
The energy industry is among the most sensitive aspects of the economy to weather changes [11]. The following factors are considered in determining power consumption or demand on time scales varying from a few hours to about a year: (i) Data from the calendar: day of the week, time of day, national holidays, school holidays, daylight saving time and bridge days; (ii) Data from the weather station: solar radiation, temperatures, wind speed, humidity, etc.; and (iii). Economic considerations include company production scheduling and economic development etc. Models, forecasts, and estimates are three vital tools in energy systems monitoring, control, evaluation, and planning [12]. Estimates are forecasts that assess the energy system supply and demand. Models are often used to represent the present and future patterns of the energy system. Together, these tools (models, estimates and forecasts) help build the energy system and maintain its orderly growth. Types of models and forecasts in energy systems include (1) Least-squares method (Linear and quadratic models), (2) Dynamic state estimation techniques (Kalman filtering; least absolute value filtering algorithms), (3) Static state estimation methods, (4) Genetic-based Algorithm (GA) techniques (5) Artificial Neural Networks (ANN) approach (6) Operational Research (OR) techniques.
Various researchers have developed several of these energy models to model the impact of these factors, such as weather, economy, calendar data, demography, the population on components (minimum and peak load, daily and monthly consumption, heating, and cooling demand, etc.) of energy (electricity) demand and consumption. Kuo and Huang [13] used historical information from Texas, USA, to design and develop a high-precision ANN model for short-term energy using a long short-term memory system to forecast load. Nasr et al. [14] developed two ANN models to predict Electrical Energy Consumption (EEC): one was a univariate fully integrated ANN model with three electrical power consumption input layers. The other was an intermittently connected multivariate ANN model with EEC and degree day as input units. Abdel-Aal et al. [15] developed an abductory induction mechanism model for forecasting electrical energy consumption in Saudi Arabia using historical data for weather parameters (mean air temperature, relative humidity, and solar radiation), demography (population), and economic indicators (gross domestic product per capita). Ogcu et al. [16] used support vector regression (SVR) and ANN to model and forecast the electricity consumption of Turkey using a dataset of electricity consumption that covers a period of forty years (1970 - 2011). Hor et al. [17] used three different models to measure the influence of climate variability on monthly electricity consumption in the United Kingdom: The socioeconomic model (S-E), Box and Jenkin's model and ANN. Nagbe et al. [18] implemented a functional state-space model for forecasting short-term electricity demand based on historical consumption data integrated into a state-space model with a functional vector autoregressive function. In this paper, Gujba et al. [19] calculated the weather sensitivity of power demand by evaluating the effects of apparent temperature in Delhi, India's electricity demand using daily data from 2000 to 2009. Chikobvu and Sigauke [9] used the piecewise linear regression model and the generalized extreme value distribution to model the effect of temperature on daily peak electricity demand in South Africa. Numerous different statistical techniques were used to assess the levels of accuracy and predictive performance of the existing theories, including Mean Square Error (MSE), Sum of Square Error (SSE), Mean Absolute Percentage Error (MAPE), mean absolute error (MAE), etc. and the models showed various degrees of accuracies as presented by the authors. Some of these models, specifically the non-parametric models (ANN, Support Vector, etc.), are data-dependent, and as such, the resultant models are tailored to the dataset. In Nigeria, accurate data (weather and energy) is not readily available to develop such models due to the unstable power supply.
1.2 Salient findings on the effect of climate on energy consumption
The World Energy Council [20] assessed the effects of existing climate change evaluations and how they functioned in achieving sustainability using the "3A's" standards (accessibility, availability, and acceptability). The WEC report found that the government and others have not been up to the task of mitigating climate change from the energy industry, based on what drives emissions and how policies have fared so far. Policy decisions have become too narrow and relatively brief, failing to recognize the correct signals for greener, relatively long investments. As per the WEC article, no single strategy or measure could give the whole arrangement, or even most of the solution, since all accessible means get their arrangement of weaknesses and advantages. Mideksa and Kallbekken [21] investigated the consequences of climate change on the electricity sector by evaluating previous and present studies on how climate change affects electricity demand and supply. Matsuo et al. assessed the impact of CO2 emission requirements on global energy supply, demand, structure, and costs for both OECD and non-OECD regions using the MARKAL model, a linear programming model for energy system analyses. Akinbami [1] investigated the long-term implications of climate change and energy system interactions for Nigeria, imploring the politicians to implement more proactive assessment in case of mitigation technologies. Enete and Alabi [22] completed research of key published papers to explore the impact of climate change on energy generation. They discovered evidence that climate change reduces power and energy production by diminishing renewable and non-renewable resources. Nnaji et al. [23] used a multivariate network to examine the relationship between electricity supply, CO2 emissions, fossil fuel consumption, and economic growth in Nigeria from 1971 to 2009. Their research results revealed that economic growth is linked to increased CO2 emissions, while electricity supply and CO2 emissions have a positive relationship, highlighting Nigeria's poor electricity supply. Uzoma et al. [24] discussed Nigerian sustainable development and claimed that no single energy mix could meet a country's energy demands indefinitely. As a result, incorporating all exploitable energy resources is a feasible method for Nigeria to achieve energy supply stability. They discovered that the current energy mix had had little impact on sustainable development, even though electricity generation is insufficient, and coal is no longer used, using a linear regression (Ordinary Least Square) estimation procedure. According to their findings, climate change will have a more significant impact on energy services. Parkpoom and Harrison [25] used a simple regression model for Thai data to conduct a micro-study of temperature for short-term load forecasting and climate change impact analysis. They addressed climate and socioeconomic occurrences and forecasted that peak electric demand could rise by 1.74%–3.43% by 2020, with a 1.74℃ rise in average annual temperature. Wangpattarapong et al. [26] investigated the effects of climate and economic factors on residential power consumption using data from the Bangkok metropolitan area. The study discovered that with every one-degree Celsius temperature increase, housing demand increased by 6.79%. Akinbami [1] explored the implications of climate change and power system interrelations for sustainable development, urging the government to be more proactive in terms of mitigation technologies. In investigating how the energy industry might be influenced by climate change and the management options available.
According to Greenleaf et al. [3], the implementation of a percentage of climate change policies in the EU will significantly alter the structure of the energy system. When evaluating thermoelectric power vulnerability in Brazil, Schaeffer et al. [6] performed a climate impact assessment based on HadCM3 GCM temperature forecasts for the A2 and B2 IPCC SRES17 scenarios. The scholars found that the overall energy consumption would only be 2% greater than in the base year, implying that the effects may be minor given natural gas's small share of the country's energy production matrix. Gujba et al. [19] scheduled to investigate the consequences of Nigeria's climate policy by presenting a life cycle environmental and economic assessment of Nigeria's current and prospective electricity industry. Their analysis revealed that all life cycle impacts and economic costs significantly increased over the time frame evaluated, even though the government proposed renewable energy sources to reduce the environmental footprint of the energy matrix. By 2030, however, this should necessitate a five-fold rise in power system investment opportunities. Analysts have used a range of methodologies to model consumer response to climate change [27-29], and there is significant regional variation. As previously stated, consumer electricity demand models in the context of climate change should consider not only temperature but also relative humidity, solar radiation, sunshine hours, and evaporation. The best indicator for human (residential) electricity demand is a combined heat index that considers temperature, relative humidity, solar radiation, sunshine hours, and evaporation [30-34].
The overall approach used in this study includes: Creating a database of weather variables and energy demand or consumption parameters; analyzing and correlating electrical energy demand to weather variables, developing models - Multivariate Linear Regression and Artificial Neural Networks to forecast the impact of change in the weather variables on the electrical energy.
2.1 Data source
The study area, International Institute of Tropical Agriculture (IITA), Ibadan, Oyo State, Nigeria, is located at Latitude 07°30’N and longitude 03°55’E, at an altitude 227 m above sea level. The institute is a not-for-profit institution founded in 1967 that generates agricultural innovations to meet Africa’s most pressing challenges of hunger, malnutrition, poverty, and natural resource degradation. IITA campus sits on about 1,000 hectares, including a 300-hectare forest reserve that preserves some of the region’s indigenous flora and fauna. It comprises office buildings, residential buildings, a mini-industrial complex, an international conference centre, a research farm area, a primary healthcare facility, an international school, and a four-star international hotel located within the campus. Power supply to the campus is both from the public utility (Ibadan Electricity Distribution Company – IBEDC), self-generation (four 1.5 MVA Caterpillar Generators), and battery backup power (inverters and UPS), thus ensuring a 24-hour power supply with brief interruptions in some locations (less than 5 minutes) during changing of power source. IITA also has a state-of-the-art weather observation station located in the study area.
Being a developing nation, Nigeria has struggled with providing stable electricity to its citizens. It is difficult to get accurate data on energy data (utilization) for research purposes, especially those studies that require almost uninterrupted or stable electricity. This location was primarily chosen for this study because it is one of the few locations, if not the only location in Nigeria that has managed to maintain and operate an almost stable, reliable, and available (24 hrs x 7 days) mini-grid electricity supply to its diverse community for more than thirty (30) years and has an environment and facilities that is comparative to modern-day society or a developed country.
2.1.1 Weather data
Weather and temperature are essential drivers of electricity consumption. According to Crowley and Joutz [35], more than 40% of end-use energy consumption is related to the heating and cooling needs in the residential and commercial sectors. These needs are influenced mainly by weather conditions. The weather data was obtained from the IITA weather observation station located at the case study area in Ibadan, Nigeria. The daily weather data (Min and Max Temp, Min and Max Rel. Humidity, Sunshine Hours, Solar Radiation and Wind Speed) from 2011 to 2018 was collected, and the monthly weather data (Min and Max Temperature) from 2008 to 2018 was collated for this study.
2.1.2 Energy data
The IITA Ibadan campus gets its electricity supply from IBEDC via a 33 kV feeder, stepped down by 2 x 5 MVA, 33/11 kV power transformers. This is further stepped down to 415 V (3 phase) by several strategically located 11/0.415 kV distribution transformers before supplying the various buildings within the campus. Due to the unreliability of the electricity provided by the public utility, the campus has 4 x 1.5 MVA hot-standby diesel generators with 4 x .415/11 kV step-up transformers, providing electricity to the campus when there is an interruption in the supply from the public utility. Several energy meters are installed at various levels in the power chain to measure different energy parameters (voltage, current, power, energy, power factor). Readings from these energy meters are manually collated and recorded in a hardcopy register on an hourly/daily/monthly basis. Energy data for this study was collated from the data provided by the IITA Power Unit, which is responsible for managing the electricity supply to the institute. Energy parameters, such as average power factor, minimum load (MW), maximum load (MW), average load (MW), generator hours (hrs), public utility hours (hrs), generator consumption, public utility consumption, total consumption, were collated daily for this study.
2.2 Artificial Neural Network (ANN) analysis
An ANN is built from a network of linked units or terminals known as artificial neurons, roughly modelled after the biological brain neurons. Like synapses in a brain, each link can send a signal to other neurons. An artificial neuron receives a signal, analyzes it, and can signal neurons to which it is linked. Each neuron's output is generated by a specific non-linear function of the summation of its inputs, and the "signal" at a connection is a real number. Edges are the terms for the connections. The weight of neurons and edges is generally adjusted as learning progresses. Several systematic methods are followed while creating ANN models. There are five fundamental phases in broad: (1) gathering data, (2) preparing data, (3) developing the network, (4) training, and (5) testing the model's performance. The ANN model learns from each iteration of the dataset during training and modifies the weight of its neurons to represent the dataset more accurately, thus making it an effective model for interpreting data without any recognizable patterns.
2.3 Multivariate Linear Regression (MLR) analysis
Diversified linear regression analysis of weather conditions has been evaluated to assess the quality and objective data processing in difficult topography. A least-square fit to the pressure, temperature, and dew point data throughout the field is achieved by assuming a linear variance of the surface data (e.g., temperature) in 3-dimensional space. The linear regression analysis is a valuable tool for (i) evaluating data integrity and (ii) objectively evaluating surface weather forecasts. Objective strategies widely used in weather forecasting assessment (e.g., Barnes) [31] use a weighting of values from nearby data to determine an approximate at a specified region. Several strategies are being used to analyze weather parameters on quasi-horizontal surfaces, with weights based on the reference plane between observations and analysis points. Due to the strong dependence of weather factors on the vertical plane, a two-dimensional smoothing of findings (with typical station densities) in challenging topography will generate undependable forecasts. These methods allow for three-dimensional weighting schemes, but they are not always simple to implement. Because the use of the three-dimensional space is reliable and easy, the Multivariate Linear Regression model was examined as a strategy for usage in difficult terrain.
2.4 Regression analysis
The key to using regression analysis is the premise that a linear estimate of the weather parameter in three dimensions will be a better match over the selected region [34]. Considering temperature as an example, the required linear fit would be as follows in Eqns. (1) and (2):
Linear Assumption:
$\widehat{T}={{T}_{0}}+\frac{\partial T}{\partial x}\Delta x+\frac{\partial T}{\partial y}\Delta y+\frac{\partial T}{\partial z}\Delta z$ (1)
Multivariate Linear Regression Solution
$\left(\begin{array}{cccc}n & \sum x & \sum \mathrm{y} & \sum \mathrm{z} \\ \sum x & \sum x^{2} & \sum x y & \sum x z \\ \sum y & \sum x y & \sum y^{2} & \sum y z \\ \sum z & \sum x z & \sum y z & \sum z^{2}\end{array}\right)\left[\begin{array}{l}T_{0} \\ \frac{\partial T}{\partial x} \\ \frac{\partial T}{\partial y} \\ \frac{\partial T}{\partial z}\end{array}\right]=\left[\begin{array}{l}\sum T \\ \sum T_{x} \\ \sum T_{y} \\ \sum T_{z}\end{array}\right]$ (2)
where, T is the estimated temperature at a specified location (in three dimensions) given the temperature at the source and the temperature variations (calculated from the regression analysis). Diversified linear regression (e.g., Strait) [32] is used to determine T0 and the spatial derivation of T with observational data from a particular time frame. Because of non-linear temporal systems, it was not expected that extending this problem to the time dimension would enhance outcomes.
3.1 Influence of weather on electricity consumption using Artificial Neural Network and Multivariate Linear Regression
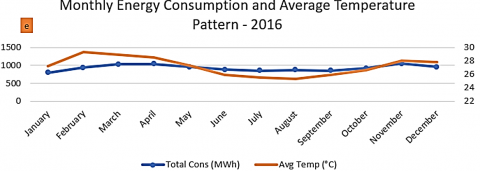
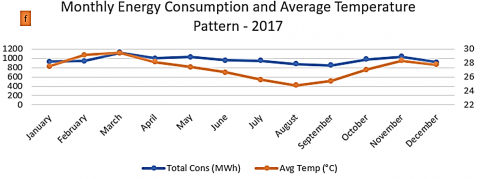
Figure 1. (a-g) - Monthly energy consumption and average temperature patterns from 2012 to 2018
This study was able to show the influence of weather variables (temperature) on electricity consumption in a typical agricultural research institute. The monthly electricity consumption pattern of the case study location follows a similar pattern as the average temperature of that location (see Figure 1 (a-g). Models were developed to be used to forecast the expected daily electricity consumption when given the values of the weather variables. The Artificial Neural Network model showed the best result in terms of error and predictive performance compared to MLR models. Further study should be carried out to analyze the extent to which each of these weather variables contributes to impacting the electricity consumption of the institute. The correlation data generated is presented in Table 1.
3.2 Exploratory data analysis for MLR
To begin writing a suitable model for the Multivariate Linear Regression algorithm, we must perform exploratory data analysis as this is necessary for the model to take shape.
Table 2 shows Pearson Correlation and P-Value (Significance) between the Target Variable (Average Total Energy Consumption) and the Independent Variables (Weather Variables) while Figure 2 displays the heat map of correlation.
Eliminating weather variables with Pearson correlation with average total electricity consumption less than 0.5 and variables with their significance (P-value) greater than 0.01, we have the following variables as input into the Multivariate Linear Regression model. The description and values for the input selection algorithm are depicted in Table 3.
Table 1. Correlation data
|
Data Correlation of Variable |
Year Index |
Month Index |
Total Cons (MWh) |
Avg. Total (MWh/day) |
Min Temp (°C) |
Max Temp (°C) |
Avg. Temp (°C) |
Rainfall (mm) |
Evaporation (mm) |
Wind Speed (km/hr.) |
Solar Radiation (MJ/m2/day) |
Min - Relative Humidity (%) |
Max - Relative Humidity (%) |
Sunshine hours (hrs.) |
|
Year Index |
1 |
-0.0442 |
0.6823 |
0.6128 |
0.1096 |
0.0165 |
0.0506 |
0.0143 |
0.1383 |
-0.5260 |
0.3665 |
0.0166 |
-0.0580 |
-0.0116 |
|
Month Index |
-0.0442 |
1 |
-0.1294 |
-0.1985 |
-0.1975 |
-0.5088 |
-0.4877 |
0.1269 |
-0.4125 |
-0.4740 |
-0.2163 |
0.3132 |
0.1474 |
-0.1737 |
|
Total Cons (MWh) |
0.6824 |
-0.1294 |
1 |
0.8588 |
0.5519 |
0.3741 |
0.5043 |
-0.0597 |
0.4276 |
-0.1129 |
0.6313 |
-0.1223 |
-0.0339 |
0.3793 |
|
Avg. Total (MWh/day) |
0.6128 |
-0.1985 |
0.8588 |
1 |
0.2799 |
0.5960 |
0.5899 |
-0.3789 |
0.5988 |
-0.1012 |
0.6281 |
-0.5149 |
-0.2589 |
0.5904 |
|
Min. Temp (°C) |
0.1096 |
-0.1975 |
0.5519 |
0.2799 |
1 |
0.3437 |
0.6363 |
0.1423 |
0.2418 |
0.1712 |
0.2556 |
0.0955 |
0.3544 |
0.2030 |
|
Max. Temp (°C) |
0.0165 |
-0.5088 |
0.3741 |
0.5960 |
0.3437 |
1 |
0.9430 |
-0.5168 |
0.8822 |
0.3309 |
0.5067 |
-0.8255 |
-0.3126 |
0.8215 |
|
Avg. Temp (°C) |
0.0507 |
-0.4877 |
0.5043 |
0.5899 |
0.6363 |
0.9429 |
1 |
-0.3744 |
0.8091 |
0.3339 |
0.5069 |
-0.6435 |
-0.1304 |
0.7482 |
|
Rainfall (mm) |
0.0144 |
0.1268 |
-0.0597 |
-0.3789 |
0.1423 |
-0.5167 |
-0.3744 |
1 |
-0.2968 |
-0.1528 |
-0.0790 |
0.7311 |
0.3778 |
-0.4027 |
|
Evaporation (mm) |
0.1384 |
-0.4125 |
0.4276 |
0.5988 |
0.2418 |
0.8822 |
0.8091 |
-0.2968 |
1 |
0.2785 |
0.6124 |
-0.7042 |
-0.4072 |
0.7886 |
|
Wind Speed (km/hr.) |
-0.5260 |
-0.4740 |
-0.1129 |
-0.1012 |
0.1711 |
0.3309 |
0.3339 |
-0.1528 |
0.2785 |
1 |
0.0725 |
-0.1748 |
-0.2019 |
0.1315 |
|
Solar Radiation (MJ/m2/day) |
0.3665 |
-0.2163 |
0.6313 |
0.6281 |
0.2556 |
0.5067 |
0.5069 |
-0.0790 |
0.6124 |
0.0725 |
1 |
-0.3130 |
-0.2260 |
0.5821 |
|
Min. Relative Humidity (%) |
0.0167 |
0.3132 |
-0.1223 |
-0.51489 |
0.0955 |
-0.8255 |
-0.6435 |
0.7311 |
-0.7042 |
-0.1748 |
-0.3130 |
1 |
0.5148 |
-0.7053 |
|
Max. Relative Humidity (%) |
-0.0581 |
0.1474 |
-0.0400 |
-0.2589 |
0.3544 |
-0.3126 |
-0.1304 |
0.3778 |
-0.4072 |
-0.2019 |
-0.2260 |
0.5148 |
1 |
-0.2728 |
|
Sunshine hours (hrs.) |
-0.0116 |
-0.1737 |
0.3793 |
0.5904 |
0.2030 |
0.8215 |
0.7482 |
-0.4027 |
0.7886 |
0.1315 |
0.5821 |
-0.7053 |
-0.2728 |
1 |
Table 2. Pearson correlation and P-value (significance) between the target variable (average total energy consumption) and the independent variables (weather variables)
|
Parameter |
R–Average Total (MWh/day) |
P–Average Total (MWh/day) |
|
Year Index |
0.612834499 |
2.91E-12 |
|
Month Index |
-0.198484481 |
0.041386872 |
|
Min. Temp (°C) |
0.279874441 |
0.003665249 |
|
Max. Temp (°C) |
0.596024921 |
1.58E-11 |
|
Avg. Temp (°C) |
0.589859889 |
2.87E-11 |
|
Rainfall (mm) |
-0.378921501 |
6.19E-05 |
|
Evaporation (mm) |
0.598753014 |
1.21E-11 |
|
Solar Radiation (MJ/m2/day) |
0.628146813 |
5.70E-13 |
|
Min - Relative Humidity (%) |
-0.514894945 |
1.63E-08 |
|
Max - Relative Humidity (%) |
-0.258948721 |
0.00735542 |
|
Sunshine hours (hrs.) |
0.590381399 |
2.73E-11 |
Table 3. Description and values for the input selection algorithm
|
Input Parameter |
Description |
Value |
|
Trials Number |
The number of trials for each neural network. |
3 |
|
Tolerance |
Tolerance for the selection error in the training of the algorithm. |
0.01 |
|
Selection Loss Goal |
Goal value for the selection error. |
0 |
|
Maximum Selection Failures |
The maximum number of iterations at which the selection error increases. |
10 |
|
Maximum Inputs Number |
The maximum number of inputs in the neural network. |
7 |
|
Minimum Correlation |
The minimum value for the correlations to be considered. |
0 |
|
Maximum Correlation |
The maximum value for the correlations to be considered. |
1 |
|
Maximum Iterations Number |
The maximum number of iterations to perform the algorithm. |
100 |
|
Maximum Time |
The maximum time for the inputs selection algorithm. |
3600 |
|
Plot Training Loss History |
Plot a graph with the training errors of each iteration |
True |
|
Plot Selection Error History |
Plot a graph with the selection errors of each iteration |
True |
Figure 2. Heat map of correlation
3.2.1 Model inputs of multivariate linear regression
Let Year Index = A; Maximum Temperature (℃) = B; Average Temperature (℃) = C; Evaporation (mm) = D; Solar Radiation (MJ/m2/day) = E; Minimum Relative Humidity (%) = F; and Sunshine hours = G.
3.2.2 Mathematical representation of multivariate linear regression model
Let Average Total Consumption = Y.
The model of the Multivariate Linear Regression is presented in Eq. (3).
$Y={{Z}_{0}}+{{Z}_{1}}A+{{Z}_{2}}B+{{Z}_{3}}C+{{Z}_{4}}D+{{Z}_{5}}E+{{Z}_{6}}F+{{Z}_{7}}G$ (3)
This model was implemented using the monthly weather and energy data obtained from the institute using the python programming language. The values for the coefficient of the independent variable Z0 to Z7 were calculated for the linear regression model as shown in Eq. (4).
Y=-1.308833+0.873882A–0.074710B+0.928433C–0.852106D+0.259264E–0.038418F+0.744448G (4)
3.2.3 MLR training and testing dataset
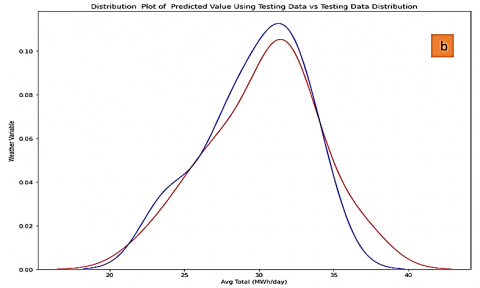
Figures 3 and 4 show the model linear regression parameters between predicted and actual average electricity consumption (Test Dataset) and (Train Dataset). The MLR model has a mean square error (MSE) of 2.5578, a mean absolute error (MAE) of 1.3510, and a mean absolute percentage error (MAPE) of 4.721% using the training dataset. The MLR model for the testing dataset has a mean square error (MSE) of 4.8064, a mean absolute error (MAE) of 1.5570 and a mean absolute percentage error (MAPE) of 1.557% using the testing dataset, as shown in the comparison table (see Table 4). Figure 5 presents a distribution plot of predicted value using training/testing data and training/testing data distribution.
Figure 3. Model linear regression parameters between predicted and actual average electricity consumption (test dataset)
Figure 4. Model Linear Regression Parameters between Predicted and Actual Average Electricity Consumption (Train Dataset)
Figure 5. (a) Distribution plot of predicted value using training data vs training data distribution (b) distribution plot of predicted value using testing data vs testing data distribution
Table 4. Comparison of models
|
Type of Error |
Scenario |
MLR Model |
ANN Model |
|
Mean Squared Error (MSE) |
Test |
4.8064 |
2.9420 |
|
Train |
2.5578 |
1.4677 |
|
|
Mean Absolute Error (MAE) |
Test |
1.5570 |
1.1995 |
|
Train |
1.3510 |
0.9576 |
|
|
Mean Absolute Percentage Error (MAPE) |
Test |
1.557% |
1.199% |
|
Train |
4.721% |
3.332% |
3.3 Artificial Neural Network model
The mathematical expression represented by integral parts of the inputs It takes the inputs Year Index_lag_0, Max Temp_lag_0, Avg. Temp_lag_0, Evaporation_lag_0, Solar Radiation_lag_0, min - Relative Humidity_lag_0, Sunshine hours_lag_0, to produce the output Avg. Total_lag_0. In forecasting models, the information is propagated in a feed-forward fashion through the scaling, perceptron, and unscaling layers. Figure 6 represents a general ANN system.
Figure 6. General representation of an Artificial Neural Networks
3.3.1 ANN training dataset
Figure 7. ANN model linear regression parameters between predicted and actual average electricity consumption (train dataset)
Figure 8. ANN model linear regression parameters between predicted and actual average electricity consumption (test dataset)
Figures 7 and 8 show the ANN Model Linear Regression Parameters between Predicted and Actual Average Electricity Consumption (Train Dataset) and (Test Dataset). The ANN model has a Mean Square Error (MSE) of 1.4677, a Mean Absolute Error (MAE) of 0.9576 and a Mean Absolute Percentage Error (MAPE) of 3.332% using the training dataset as shown in the comparison table (see Table 4).
3.3.2 ANN testing dataset
The ANN model has a mean square error of 2.9420, a mean absolute error of 1.1995 and a mean absolute percentage error of 1.199% using the testing dataset. The distribution plot of predicted value using training/testing data and training/testing data distribution is illustrated in Figure 9.
Figure 9. (a) Distribution plot of predicted value using training data vs training data distribution (b) distribution plot of predicted value using testing data vs testing data distribution
This study focuses on the major differences between Traditional Machine Learning (MLR) processes and modern techniques using Artificial Neural Network. The significant difference is the extreme need for feature engineering while using MLR against the complete lack of such feature engineering when producing a model with ANNs. It was found that ANNs performed much better than the MLR model as the mean squared error was reduced by 39% and 42% on test data and train data, respectively. It was also observed that the performance of ANN was much better than that of the MLR on other metrics like Mean Absolute Error (MAE) and Mean Absolute Percentage Error (MAPE). These results show that ANN models can perform better as the algorithm goes on to learn on its own and develop a pretty accurate representation of the data. This study is limited by the size of the case study area and the size of available historical data. This is due to the unreliable and unstable power supply in Nigeria and thus making it challenging to collect energy data representing a large geographical area. Further study on more significant geographical regions, such as cities or states, should be conducted to enhance energy planning and support effective response to climate change in Nigeria and the African continent.
[1] Akinbami, J.F.K. (2009). Climate change and energy: Issues, prospects and challenges for sustainable development in Nigeria. International Association for Energy Economics, pp. 27-31.
[2] Adenikinju, A. (2008). Efficiency of the energy sector and its impact on the competitiveness of the Nigerian economy. International Association for Energy Economics, 27(32): 131-9.
[3] Greenleaf, J., Harmsen, R., Angelini, T., Green, D., Williams, A., Rix, O., Blyth, W. (2009). Analysis of impacts of climate change policies on energy security. Final Report. Being final report of Ecofys, ERAS and RedPoint Energy by order of: European Commission DG Environment.
[4] Ifeanyi-Obi, C.C., Etuk, U.R., Jike-Wai, O. (2012). Climate change, effects and adaptation strategies; implication for agricultural extension system in Nigeria. Greener journal of Agricultural Sciences, 2(2): 53-60.
[5] Beecher, J.A, Kalmbach, J.A, (2012). Climate Change and Energy. US National Climate Assessment Midwest Technical Input Report. Available from: https://glisa.umich.edu/media/files/NCA/MTIT_Energy.pdf.
[6] Schaeffer, R., Szklo, A.S., de Lucena, A.F.P., Borba, B.S.M.C., Nogueira, L.P.P., Fleming, F.P., Boulahya, M.S. (2012). Energy sector vulnerability to climate change: A review. Energy, 38(1): 1-12. https://doi.org/10.1016/j.energy.2011.11.056
[7] Zamuda, C., Mignone, B., Bilello, D., Hallett, K.C., Lee, C., Macknick, J., Steinberg, D. (2013). US energy sector vulnerabilities to climate change and extreme weather. Department of Energy Washington DC.
[8] Woodley, E. (2011). Building Nigeria’s response to climate change: Pilot projects for community-based adaptation in Nigeria. In Experiences of Climate Change Adaptation in Africa, 297-315. Springer, Berlin, Heidelberg. https://doi.org/10.1007/978-3-642-22315-0_19
[9] Chikobvu, D., Sigauke, C. (2013). Modelling influence of temperature on daily peak electricity demand in South Africa. Journal of Energy in Southern Africa, 24(4): 63-70.
[10] Staffell, I., Pfenninger, S. (2018). The increasing impact of weather on electricity supply and demand. Energy, 145: 65-78. https://doi.org/10.1016/j.energy.2017.12.051
[11] Kirshen, P., Ruth, M., Anderson, W. (2008). Interdependencies of urban climate change impacts and adaptation strategies: A case study of Metropolitan Boston USA. Climatic Change, 86(1): 105-122. https://doi.org/10.1007/s10584-007-9252-5
[12] Jebaraj, S., Iniyan, S. (2006). A review of energy models. Renewable and Sustainable Energy Reviews, 10(4): 281-311. https://doi.org/10.1016/j.rser.2004.09.004
[13] Kuo, P.H., Huang, C.J. (2018). A high precision artificial neural networks model for short-term energy load forecasting. Energies, 11(1): 213. https://doi.org/10.3390/en11010213
[14] Nasr, G.E., Badr, E.A., Younes, M.R. (2001). Neural networks in forecasting electrical energy consumption. In FLAIRS Conference, pp. 489-492.
[15] Abdel-Aal, R.E., Al-Garni, A.Z., Al-Nassar, Y.N. (1997). Modelling and forecasting monthly electric energy consumption in eastern Saudi Arabia using abductive networks. Energy, 22(9): 911-921. https://doi.org/10.1016/S0360-5442(97)00019-4
[16] Oğcu, G., Demirel, O.F., Zaim, S. (2012). Forecasting electricity consumption with neural networks and support vector regression. Procedia-Social and Behavioral Sciences, 58: 1576-1585. https://doi.org/10.1016/j.sbspro.2012.09.1144
[17] Hor, C.L., Watson, S.J., Majithia, S. (2005). Analyzing the impact of weather variables on monthly electricity demand. IEEE Transactions on Power Systems, 20(4): 2078-2085. https://doi.org/10.1109/TPWRS.2005.857397
[18] Nagbe, K., Cugliari, J., Jacques, J. (2018). Short-time electricity demand forecasting using a functional state space model. Energies, 11(5): 1120. https://doi.org/10.3390/en11051120
[19] Gujba, H., Mulugetta, Y., Azapagic, A. (2010). Environmental and economic appraisal of power generation capacity expansion plan in Nigeria. Energy Policy, 38(10): 5636-5652. https://doi.org/10.1016/j.enpol.2010.05.011
[20] World Energy Council (2007). Energy and Climate Change. London, United Kingdom. Available from: https://www.worldenergy.org/assets/downloads/PUB_Energy_and_Climate_Change_2007_WEC.pdf.
[21] Mideksa, T.K., Kallbekken, S. (2010). The impact of climate change on the electricity market: A review. Energy Policy, 38(7): 3579-3585. https://doi.org/10.1016/j.enpol.2010.02.035
[22] Enete, C.I., Alabi, M.O. (2011). Potential impacts of global climate change on power and energy generation. Journal of Knowledge Management, Economics and Information, Technology, 6: 1-14.
[23] Nnaji, C.E., Chukwu, J.O., Nnaji, M. (2013). Electricity supply, fossil fuel consumption, CO2 emissions and economic growth: Implications and policy options for sustainable development in Nigeria. International Journal of Energy Economics and Policy, 3(3): 262-271.
[24] Uzoma, C.C., Nnaji, C.E., Nnaji, M. (2012). The role of energy mix in sustainable development of Nigeria. Continental Journal of Social Sciences, 5(1): 21-29.
[25] Parkpoom, S., Harrison, G.P. (2008). Analyzing the impact of climate change on future electricity demand in Thailand. IEEE Transactions on Power Systems, 23(3): 1441-1448. https://doi.org/10.1109/TPWRS.2008.922254
[26] Wangpattarapong, K., Maneewan, S., Ketjoy, N., Rakwichian, W. (2008). The impacts of climatic and economic factors on residential electricity consumption of Bangkok Metropolis. Energy and Buildings, 40(8): 1419-1425. https://doi.org/10.1016/j.enbuild.2008.01.006
[27] Mansur, E.T., Mendelsohn, R., Morrison, W. (2008). Climate change adaptation: A study of fuel choice and consumption in the US energy sector. Journal of Environmental Economics and Management, 55(2): 175-193. https://doi.org/10.1016/j.jeem.2007.10.001
[28] Sailor, D.J., Muñoz, J.R. (1997). Sensitivity of electricity and natural gas consumption to climate in the USA-Methodology and results for eight states. Energy, 22(10): 987-998. https://doi.org/10.1016/S0360-5442(97)00034-0
[29] Rosenberg, N.J., Crosson, P.R. (1991). The MINK project: A new methodology for identifying regional influences of, and responses to, increasing atmospheric CO2 and climate change. Environmental Conservation, 18(4): 313-322. https://doi.org/10.1017/S0376892900022566
[30] Gotham, D.J., Angel, J.R., Pryor, S.C. (2012). Vulnerability of the electricity and water sectors to climate change in the Midwest. In Climate Change in the Midwest: Impacts, Risks, Vulnerability, and Adaptation, 158-177. Indiana University Press.
[31] Barnes, S.L. (1964). A technique for maximizing details in numerical weather map analysis. Journal of Applied Meteorology and Climatology, 3(4): 396-409. https://doi.org/10.1175/1520-0450(1964)003<0396:ATFMDI>2.0.CO;2
[32] Strait, P.T. (1983). A first course in probability and statistics with applications. Harcourt. Available from: https://openlibrary.org/works/OL4659707W/A_first_course_in_probability_and_statistics_with_applications.
[33] Johnson, S.L., Penaluna, B.E. (2019). Chapter 2 - Climate change and interactions with multiple stressors in rivers. In S. Sabater, A. Elosegi & R. Ludwig (Eds.), Multiple Stressors in River Ecosystems. 23-44. https://doi.org/10.1016/B978-0-12-811713-2.00002-9
[34] Okunlola, O.A., Alobid, M., Olubusoye, O.E., Ayinde, K., Lukman, A.F., Szűcs, I. (2021). Spatial regression and geostatistics discourse with empirical application to precipitation data in Nigeria. Scientific Reports, 11(1): 1-14. https://doi.org/10.1038/s41598-021-96124-x
[35] Crowley, C., Joutz, F.L. (2005). Weather effects on electricity loads: Modeling and forecasting. Final Report for US EPA on Weather Effects on Electricity Loads, 1-48.