Bo Dong | Yurong Li* | Xinyue Li | Zhiting Chen | Yi Ge | Rui Zhang
© 2022 IIETA. This article is published by IIETA and is licensed under the CC BY 4.0 license (http://creativecommons.org/licenses/by/4.0/).
OPEN ACCESS
Compared with a microbial fuel cell (MFC) of single flora, the MFC of mixed flora provide much better denitrification and electricity generation performance. Therefore, in-depth analysis of the kinetic features such as the structures of various types of microflora in MFCs is of important theoretical and practical significance. There is little existing research on the electricity generation and pollutant removal process of cathode microorganisms and the functions of microbial flora. To this end, this paper constructs an MFC anaerobic-aerobic coupled denitrification system and studies its performance enhancement method. First, the basic principle of MFC biological denitrification was expounded, the kinetics was introduced into the analysis of the reaction between the MFC microorganisms and pollutants, and the migration and transformation occurring in the reaction process and the mechanism of transformation speed changes were revealed. Then, the analysis and calculation methods for the electrochemical parameters and microbial diversity index in MFC were explained in detail, and the experimental results and analysis conclusions were given.
MFC denitrification, anaerobic flora, aerobic flora, enhancement of electricity generation performance
A microbial fuel cell (MFC) is a electricity generation device that uses enzymes or microbial tissues as the catalyst to convert the chemical energy of fuel into electrical energy [1- 7]. Thanks to its wide range of fuel sources, mild reaction conditions, and its cleanness and environmentally friendliness, it has attracted widespread attention from scholars at home and abroad [8-15]. Studies have shown that microbial diversity in MFC is closely related to its electricity generation efficiency. If different microbial populations that are helpful to the anaerobic treatment of sewage for electricity generation are mixed, the working potential and internal resistance of the MFC will change significantly, and the denitrification and electricity generation performance will also be greatly enhanced [16-20]. Therefore, in-depth analysis of the kinetic features such as the structures of various types of microflora in MFC is of great theoretical and practical significance.
In the continuous flow mode of wastewater treatment and electricity generation, Karra et al. [21] compared two flow modes (plug flow (PF) and complete mixing (CM)) of microbial fuel cells (MFCs) with multiple anode-cathode. The results show that PF MFC has higher electricity generation and Columbia efficiency (CE) than CM MFC, and the electricity generation varies with the flow path in PF MFC. The substrate concentration gradient along the PF MFC is the driving force for electricity generation. Comparatively, the wastewater removal efficiency of CM MFC is higher than that of PF MFC, but the power conversion efficiency and electricity generation are lower. This work demonstrates that the MFC configuration is a key factor to enhanced electricity generation and wastewater treatment. Mohan et al. [22] evaluated the performance of aerated and ferricyanide catholytes in bioelectricity generation in a dual-chamber microbial fuel cell (MFC) using a selectively enriched hydrogen-producing mixture as the anode inoculum. Two MFCs with aerated catholyte (MFCAC) and ferricyanide catholyte (MFCFC) were operated separately to clarify the differences in electricity generation potential and carbon removal efficiency under similar operating conditions. In order to better understand the effect of temperature, especially the response of biological nodes to temperature changes, Tkach et al. [23] studied the current mixed culture and pure culture MFC at two low temperatures (10°C and 5°C). The results show that the mixed culture MFCs consistently outperformed the pure culture MFCs at 10°C, but the electrogenic activity of the anodic bacteria was significantly reduced at a lower temperature of 5°C.
So far, research is mostly concentrated on the process of degradation of organic matters enriched at the MFC anode and electrode-active bacteria, while little has been done on the process of electricity generation and pollutant removal of cathode microorganisms and the functions of microbial flora. In order to further enhance the electricity generation performance of MFC, it is necessary to explore the kinetic features of the diverse microbial flora of MFC, and at the same time make up for the deficiency in the research on the kinetics of microbial fuel cells. To this end, this paper constructs an MFC anaerobic-aerobic coupled denitrification system and studies its performance enhancement method. Section 2 expounds the basic principle of MFC biological denitrification, introduces the kinetics into the analysis of the reaction between the MFC microorganisms and pollutants, and reveals the migration and transformation occurring in the reaction process and the mechanism of transformation speed changes. Section 3 explains in detail the analysis and calculation methods for the electrochemical parameters and microbial diversity index in MFC and gives the experimental results and analysis conclusions.
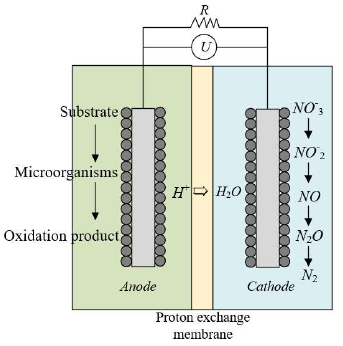
Traditional biological denitrification technology has disadvantages in carbon-source-limited denitrification process, while MFC biological denitrification uses the microorganisms on the cathode electrode as a catalyst to directly receive the electrons transmitted from the external circuit for denitrification, which is more superior than the traditional technology. Figure 1 shows the schematic diagram of MFC denitrification.
Figure 1. Schematic diagram of MFC denitrification
The anode and cathode reaction formulas of MFC biological denitrification are given below with glucose being the substrate as the electron donor and NO-3-N as the electron acceptor. The anode reaction formula is:
$C _6 H _{12} O _6+6 H _2 O \rightarrow 6 CO _2+24 H ^{+}+24 e^{-}$ (1)
The cathode reaction formula is
$NO _3^{-}+2 e^{-}+2 H ^{+} \rightarrow NO _2^{-}+ H _2 O$ (2)
$NO _2^{-}+e^{-}+2 H ^{+} \rightarrow NO + H _2 O$ (3)
$NO +e^{-}+ H ^{+} \rightarrow \frac{1}{2} NO +\frac{1}{2} H _2 O$ (4)
$\frac{1}{2} N _2 O +e^{-}+ H ^{+} \rightarrow \frac{1}{2} N _2+\frac{1}{2} H _2 O$ (5)
The traditional biological denitrification consists of two processes: nitrification and denitrification. The biological denitrification of MFC involves two forms: denitrification and simultaneous nitrification and denitrification. Considering that ammonia nitrogen is generally present in sewage, in order to reduce costs and improve the effect of MFC cathode denitrification, it is necessary to complete the nitrification of ammonia nitrogen to NO-2-N or NO-3-N before denitrification. The following is the reaction formula of simultaneous nitrification and denitrification:
$NH _4^{+}+\frac{3}{2} O _2 \rightarrow NO ^{-}+2 H ^{+}+ H _2 O$ (6)
$NO _2^{-}+\frac{1}{2} O _2 \rightarrow NO _3^{-}$ (7)
$2 NO _3^{-}+10 e^{-}+12 H ^{+} \rightarrow N _2+6 H _2 O$ (8)
The introduction of kinetics into the analysis of the reaction between MFC microorganisms and pollutants can better reveal the migration and transformation occurring in the reaction process and the mechanism of transformation speed changes. Since the concentration of NO-3-N is the core factor affecting the activity of denitrifying microorganisms, this study established the kinetic model of NO-3-N denitrification inhibition based on the results of a large number of comparative experiments, to explain the denitrification mechanism of anaerobic + aerobic bacteria in MFC under different NO-3-N concentrations.
3.1 Construction of the basic kinetic model
For the study of denitrification kinetics, a Monod model was established first in this paper to characterize the relationship between the microbial proliferation rate and the substrate concentration. Assuming that the maximum specific growth rate of microorganisms is represented by vmax, that the concentration of organic substrate R, that the saturation constant Lr, and that the specific growth rate of microorganisms v, the model is expressed as follows:
$v=v_{\max } \frac{R}{L_r+R}$ (9)
This paper conducted a study of the specific degradation rate of organic substrate instead of the conventional study on microbial growth rate, in order to obtain a more visual result. Assuming that the microbial concentration is represented by a, that the specific degradation rate of the organic substrate U, and that the maximum specific degradation rate of the organic substrate Un, there is:
$v=\frac{d a \cdot d o}{a}=-B \frac{d r \cdot d o}{a}$ (10)
Let
$-\frac{d r \cdot d o}{a}=U$ (11)
There are:
$v_n=B U_n$ (12)
$U=\frac{U_n R}{L_r+R}$ (13)
The simulated sewage used for experiments in the laboratory is of ideally simple composition, so it can be considered that the degradation kinetics of $M F C$ substrate is only related to the concentration of $NO _3^{-}- N$, which can be characterized by a power function kinetic model. Assuming that the substrate concentration at time $o$ is denoted by $D_0$, that the initial concentration of the substrate $D_0$, that the time $o$, and that the zero-order and first-order degradation rate constants $L_0$ and $L_1$ respectively, then based on the principle of power function kinetics, the zero-order reaction kinetic equation can be obtained as follows:
$D_o=D_0-L_0 o$ (14)
The first-order reaction kinetic equation is given as follows:
$\ln D_o=\ln D_0+L_1 o$ (15)
When the first substrate does not self-inhibit, the Monod model can be used. To fit the denitrification reactions under different NO-3-N concentrations, the matrix inhibition kinetic model can be used. In order to explore the reason why excessively high concentration of NO-3-N could cause the decrease of microbial activity, the Haldane model and Han-Levenspiel model were introduced to simulate the kinetic ehaviors of inhibition.
Suppose that the specific degradation rate is represented by $s$, that the maximum specific degradation rate $s_{\max }$, that the half-saturation constant $L^{\prime} r$, that the mass concentration of the substrate $R$, that the Haldane inhibition constant $L_{I F}$, that the complete inhibitory concentration $R_n$, and that the constants $n$ and $m$, respectively. The the Haldane model is expressed as follows:
$s=\frac{s_{\max } \quad R}{L_r+R+\frac{R^2}{L_{I F}}}$ (16)
The Han-Levenspiel model is expressed as follows:
$s=\frac{s_{\max } \quad R\left(1-\frac{R}{R_n}\right)^n}{R+L_r^{\prime}\left(1-\frac{R}{R_n}\right)^n}$ (17)
3.2 Selection of the degradation kinetic model
Compared with the Haldane model, the Han-Levenspiel model, if used for the anaerobic-aerobic flora coupled MFC, can achieve a higher correlation coefficient and lower fitting error, and better reflect the actual situation of the experiment. Therefore, the Han-Levenspiel model was selected in this paper to explore the change pattern of the denitrification rate of anaerobic-aerobic flora coupled MFC under different NO-3- N concentrations.
Based on the Han-Levenspiel model, the fitting equation obtained for the anaerobic flora MFC is as follows:
$s_{A N}=\frac{9.12 r\left(1-\frac{r}{197.22} \quad \right)^{0.19}}{r+58.71\left(1-\frac{r}{197.22} \quad \right)^{1.77}}$ (18)
The fitting equation obtained for the anaerobic-aerobic flora coupled MFC is as follows:
$s_{A N+A E}=\frac{24.51 r\left(1-\frac{r}{336.74} \quad \right)^{-2.09}}{r+17.36\left(1-\frac{r}{336.74} \quad \right)^{-5.81}}$ (19)
The concentration of COD in $M F C$ can increase the removal rate of $NO _3^{-}- N$ to a certain extent, but when the concentration of COD reaches a certain value, it will inhibit the increase of the removal rate. The main reason is that the excessively high COD concentration will lead to the decrease of microbial activity in $M F C$. Therefore, based on the choice of the kinetic model, the degradation performance of the COD concentration was analyzed.
Based on the Han-Levenspiel model, the fitting equation obtained by the anaerobic flora MFC is:
$s_{A N}=\frac{6.13 r\left(1-\frac{r}{896.07} \quad \right)^{0.32}}{r+814.25\left(1-\frac{r}{896.07} \quad \right)^{1.82}}$ (20)
The fitting equation obtained for the anaerobic-aerobic flora coupled MFC is:
$s_{A N+A E}=\frac{8.21 r\left(1-\frac{r}{921.67} \quad \right)^{0.28}}{r+907.64\left(1-\frac{r}{921.67}\quad \right)^{1.84}}$ (21)
4.1 Analysis and calculation of electrochemical parameters and microbial diversity index in MFC
The conventional indicators that need to be measured in this study include MFC output voltage and coulombic efficiency. At the same time, the MFC polarization curve and power density curve need to be drawn.
Record the voltage U between the cathode and anode electrodes of the MFC and the external resistance value R, and then calculate the MFC output current value I based on the following formula:
$I=\frac{U}{R}$ (22)
Change the external resistance value several times, and when the voltage becomes stable, record the corresponding MFC output voltage value and external resistance value. Assuming that the volume of the MFC anode chamber is represented by F, the formula for calculating the current density DM is as follows:
$D M=\frac{U}{1000 R F}$ (23)
The polarization curve of MFC can be drawn with DM as the x-axis and U as the y-axis. The following is the calculation formula of MFC power density GM:
$G M=V D M$ (24)
With DM as the x-axis and GM as the y-axis, the power density curve of the MFC can be drawn.
Suppose that the number of electrons transferred by metabolism per unit of chemical oxygen demand concentration is l, that the electricity generation cycle of MFC O, that the infinitely small time period do, that the current in this time period I, that the Faraday’s constant G, that the difference between the concentration of chemical oxygen demand at the beginning and end of the cycle ΔGK, and that the volume of the anode chamber F’, then the Coulombic efficiency DP of the MFC can be calculated by the following formula:
$D P=\frac{l \int_0^P I d o}{G \cdot \Delta G K \cdot F^{\prime}}$ (25)
Chao1 index, Shannon index and Simpson index were selected as the electrochemical parameters and microbial diversity indexes in MFC. Suppose that the actual observed number of operational taxonomic units is represented by RAOQ, that the numbers of operational taxonomic units containing only one and only two rRNA sequences m1 and m2, respectively, and so on. Then the calculation formula for the estimated number of operational taxonomic units based on the Chao1 index is as follows:
$R_{\text {chaol }}=R_{A O Q}+\frac{m_1\left(m_1-1\right)}{2\left(m_2+2\right)}$ (26)
Assuming that the number of operational taxonomic units containing i rRNA sequences is represented by mi, and that the total number of sequences M, the estimated number of operational taxonomic units Rshannon based on the Shannon index is calculated as follows:
$R_{\text {Shannon }}=-\sum_{i=1}^{R_{A O Q}} \frac{m_i}{M} \ln \frac{m_i}{M}$ (27)
The formula for calculating the estimated number of operational taxonomic units based on the Simpson index is as follows:
$C_{\text {Simpson }}=1-\frac{\sum_{i=1}^{R_{A O Q}} m_i\left(m_i-1\right)}{M(M-1)}$ (28)
4.2 Experimental results and analysis
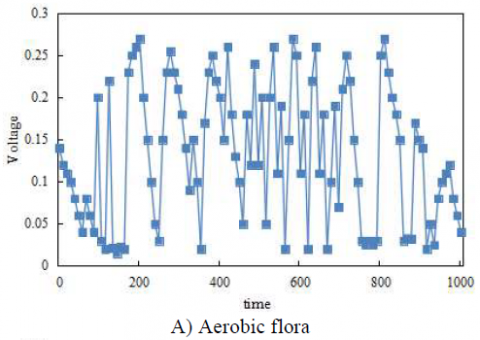
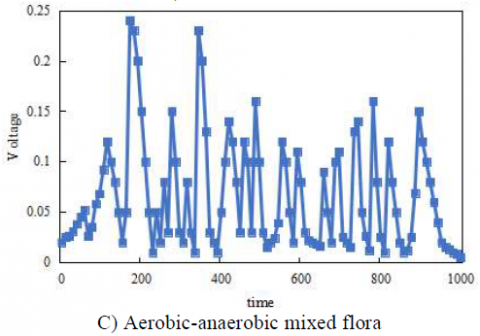
In this paper, the MFC voltage trend charts were drawn, as shown in Figure 2, used to characterize the electricity generation of aerobic flora, anaerobic flora, and aerobic-anaerobic mixed flora MFC during the electricity generation process.
Figure 2. MFC voltage change trends
It can be seen from the figure that the electricity generation voltage of the aerobic flora MFC was the highest, and that the maximum voltage levels of the anaerobic flora and mixed flora MFC had little difference. The average maximum voltage values of aerobic flora, anaerobic flora, and mixed flora MFC were 0.19V, 0.13V, and 0.12V, respectively. Based on the variance calculation results, it can be seen that the voltage stability of aerobic and anaerobic flora MFCs was relatively close, but lower than that of the mixed flora MFC. The voltages of the three MFCs all enjoyed short plateau time and shared the same change trends - rising to the highest value and then falling. In order to improve the stability of electricity generation and achieve a longer maximum voltage duration, this paper further explored the reasons based on the MFC power density curve.
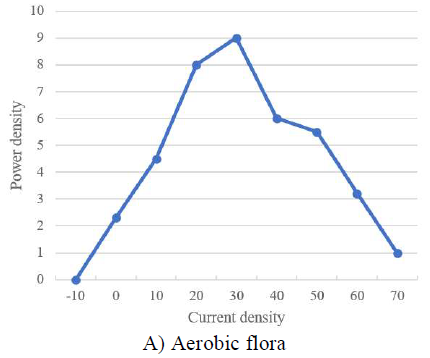
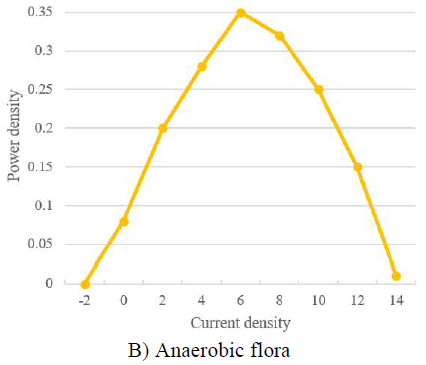
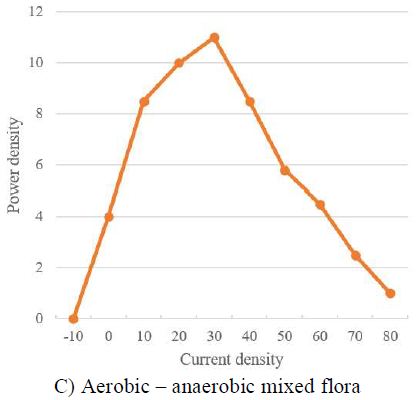
Figure 3. MFC power density curve
Figure 3 shows the MFC power density curves of aerobic flora, anaerobic flora, and aerobic-anaerobic mixed flora MFCs. The maximum power density and corresponding current density of aerobic flora MFC were 7.99W/m3 and 52.64A/m3, respectively, and the power density and corresponding maximum current density of anaerobic flora MFC were 0.36W/m3 and 9.62A/m3, respectively. Compared with the above two, the mixed flora MFC had a higher power density - the maximum current density and corresponding power density were 30.67A/m3 and 9.07W/m3 respectively. In order to improve the electricity generation performance of the MFC, an appropriate resistor can be used to help eliminate polarization and increase the output power density of the MFC.
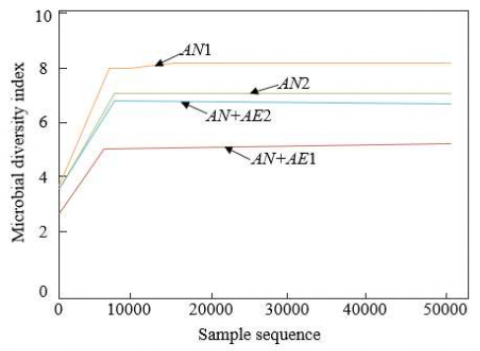
Figure 4. Sparse analysis chart of microbial diversity index
Based on the average values of Chao1 index, Shannon index and Simpson index, the sparse analysis chart of the microbial diversity index was drawn, as shown in Figure 4. It can be seen that the microbial diversity index of the mixed flora MFC with a great variety of species was high, reaching about 8. The microbial diversity index of the MFC with relatively fewer species was low, reaching about 5.5. After the operation became stable, the microbial diversity of the mixed flora MFC (reaching about 7) was not much different from that of the anaerobic flora MFC.
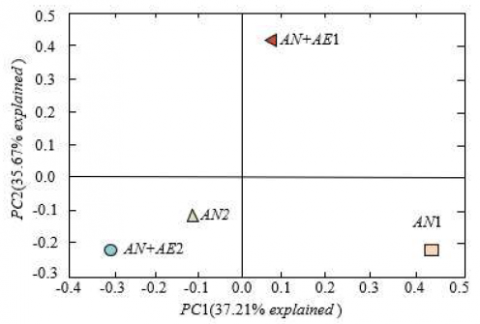
Figure 5. Scatter plot of principal component analysis
Figure 5 shows the scatter plot of principal component analysis. From the principal component analysis of the microbial community, it can be seen that, after the operation became stable, the microbial species of the mixed flora MFC (AN+AE2) and those of the anaerobic flora MFC (AN2) were relatively close in terms of the distance between principal components 1, indicating that AN+AE2 and AN2 have a relatively close genetic relationship. After the operation became stable, the microbial species of the mixed flora MFC (AN+AE1) and the anaerobic flora MFC (AN1) were relatively far from each other in terms of the distance between principal components 1, indicating that AN+AE1 and AN1 have a relatively distant genetic relationship. This shows that different kinds of microorganisms were selected in the process of MFC electricity generation.
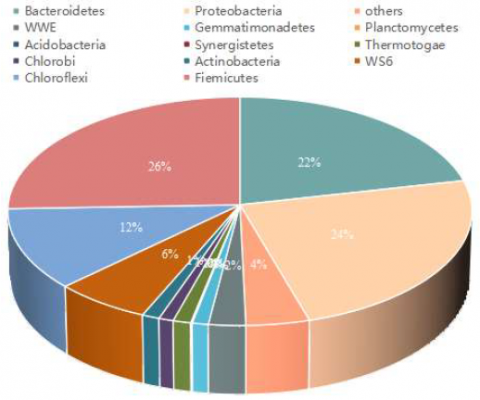
Figure 6. Composition and relative abundance of the microbial community of the mixed flora
Figure 6 shows the species composition and relative abundance of the microbial community of the mixed flora. In the anaerobic flora MFC, δ-proteobacteria, γ-proteobacteria and Firmicutes were the dominant microbial flora, accounting for more than 80% of the entire community, indicating that the microbial diversity in the anaerobic flora MFC was relatively low. However, after the operation of the mixed flora MFC became stable, the species of the microbial community were more abundant, so the microbial diversity was significantly higher. In addition toδ-proteobacteria, γ-proteobacteria and Firmicutes, there were floras like Bacteroidetes, Chloroflexi, α-proteobacteria which had a relative abundance of greater than 2%.
This paper constructed an MFC anaerobic-aerobic coupled denitrification system and studies its performance enhancement method. First, the basic principle of MFC biological denitrification was expounded, the kinetics was introduced into the analysis of the reaction between the MFC microorganisms and pollutants, and the migration and transformation occurring in the reaction process and the mechanism of transformation speed changes were revealed. Then, the analysis and calculation methods for the electrochemical parameters and microbial diversity index in MFC were explained in detail. Based on experiments, the MFC voltage trend charts and power density curves were drawn. It can be seen that, compared with the aerobic and anaerobic flora MFCs, the mixed flora MFC had a higher power density and higher voltage stability. The sparse analysis of the microbial diversity index was conducted, from which, it can be seen that the microbial diversity index of mixed flora MFC with abundant species was higher. The scatter plot of principal component analysis was given to verify the selection of different types of microorganisms in the process of MFC electricity generation. The species composition and relative abundance of the microbial community of the mixed flora were exhibited, which further verified that, after the operation of the mixed flora MFC became stable, the microbial community was more abundant in species and that the microbial diversity was significantly higher.
This work is supported by the Application study on the structure function and regulation mechanism of the MFC coupled anaerobic + aerobic enhanced nitrogen removal system (Grant No.: KJ2021A1407); and the Application of solidification and stabilization technology of river sediment (Grant No.: YJZ-2020-07).
[1] Di Rito, G., Chiarelli, M.R., Luciano, B. (2020). Dynamic modelling and experimental characterization of a self-powered structural health-monitoring system with MFC piezoelectric patches. Sensors, 20(4): 950. https://doi.org/10.3390/s20040950
[2] Kondaveeti, S., Lee, S.H., Park, H.D., Min, B. (2020). Specific enrichment of different Geobacter sp. in anode biofilm by varying interspatial distance of electrodes in air-cathode microbial fuel cell (MFC). Electrochimica acta, 331: 135388. https://doi.org/10.1016/j.electacta.2019.135388
[3] Okabe, S. (2021). Bioelectrochemical anoxic ammonium nitrogen removal by an MFC driven single chamber microbial electrolysis cell. Chemosphere, 274: 129715. https://doi.org/10.1016/j.chemosphere.2021.129715
[4] Chang, J., Wang, W., Wang, Y., Su, C., Pan, J., Wang, H., Song, H. (2021). Fabrication of bimetallic Co/Zn leaf blade structure template derived Co3O4-ZIF/Zn and its ORR catalytic performance for MFC. Journal of the Taiwan Institute of Chemical Engineers, 129: 144-153. https://doi.org/10.1016/j.jtice.2021.09.027
[5] Koszewnik, A. (2021). The influence of a slider gap in the beam–slider structure with an MFC element on energy harvesting from the system: Experimental case. Acta Mechanica, 232(3): 819-833. https://doi.org/10.1007/s00707-020-02869-3
[6] Seo, E.J., Lee, J.M. (2021). Properties of MFCs and MFC films from Radiata pine pulps. Palpu Chongi Gisul/Journal of Korea Technical Association of the Pulp and Paper Industry, 53(1): 76-82. https://doi.org/10.7584/JKTAPPI.2021.02.53.1.76
[7] Larson, T., Svending, P., Lai, R., Skuse, D. (2021). Upcycling of Recycled Feedstocks: Conversion into MFC. TAPPICon LIVE, 2021(1): 255-258.
[8] Fan, L., Shi, J., Xi, Y. (2020). PVDF-modified Nafion membrane for improved performance of MFC. Membranes, 10(8): 185. https://doi.org/10.3390/membranes10080185
[9] Panjiara, D., Pramanik, H. (2020). Optimization of process parameters using response surface methodology (RSM) for power generation via electrooxidation of glycerol in T-Shaped air breathing microfluidic fuel cell (MFC). International Journal of Hydrogen Energy, 45(58): 33968-33979. https://doi.org/10.1016/j.ijhydene.2020.09.023
[10] Mukimin, A. (2020). The energy production and efficiency treatment of ML-MFC using high organic content wastewater. In E3S Web of Conferences, 202: 10006. https://doi.org/10.1051/e3sconf/202020210006
[11] Shi, K., Zhao, Q.L., Wang, W.Y., Wang, K. (2020). Electricity production and RhB degradation in MFC-EF coupling system with iron and manganese composite cathode. Harbin Gongye Daxue Xuebao/Journal of Harbin Institute of Technology, 52(2): 129-137. https://doi.org/10.11918/201904181.
[12] Bauomy, H.S., El-Sayed, A.T. (2020). Act of nonlinear proportional derivative controller for MFC laminated shell. Physica Scripta, 95(9): 095210. https://doi.org/10.1088/1402-4896/abaa7c
[13] Xiao, N., Wu, R., Huang, J.J., Selvaganapathy, P.R. (2020). Anode surface modification regulates biofilm community population and the performance of micro- MFC based biochemical oxygen demand sensor. Chemical Engineering Science, 221: 115691. https://doi.org/10.1016/j.ces.2020.115691
[14] Zhu, Y.L., Pu, J.K., Ge, X.L., Yan, P.L., Sun, W.X., Li, T.T., Liu, C. (2020). Sequence admittance modeling and stability analysis for three-phase LCL-type grid- connected inverter with DC bus and MFC disturbance under weak grid. Dianli Zidonghua Shebei/Electric Power Automation Equipment, 40(9): 190-196. https://doi.org/10.16081/j.epae.202009027
[15] Yang, H., Zhang, S., Yan, J. (2020). Chitosan-reinforced MFC/NFC aerogel and antibacterial property. Advances in Polymer Technology, 2020: Article ID 7890215. https://doi.org/10.1155/2020/7890215
[16] Gao, Z., Huang, J., Miao, Z., Zhu, X. (2020). Multiple model switching adaptive control for vibration control of cantilever beam with varying load using MFC actuators and sensors. Smart Structures and Systems, An International Journal, 25(5): 559-567.
[17] Skuratovskii, R.V., Osadchyy, V. (2021). Analysis of the MFC singuliarities of speech signals using big data methods. In Intelligent Computing, 987-1009. https://doi.org/10.1007/978-3-030-80126-7_70
[18] Zou, H., Chu, L., Wang, Y. (2020). Evaluation of integrated UFCW-MFC reactor for azo dye wastewater treatment and simultaneous bioelectricity generation. Environment Protection Engineering, 46(1): 63-72. https://doi.org/10.37190/epe200105
[19] Zhang, S., Tong, W., Wang, M. (2021). Graphene- modified biochar anode on the electrical performance of MFC. Ferroelectrics, 578(1): 1-14. https://doi.org/10.1080/00150193.2021.1902759
[20] Feng, Y., Liang, H., Yang, T., Liu, C., Gong, A., Shen, T. (2021). MFC-MZI type ultraviolet sensor based on ZnO and composite graphene. Journal of Lightwave Technology, 39(13): 4542-4547. https://doi.org/10.1364/JLT.39.004542
[21] Karra, U., Troop, E., Curtis, M., Scheible, K., Tenaglier, C., Patel, N., Li, B. (2013). Performance of plug flow microbial fuel cell (PF-MFC) and complete mixing microbial fuel cell (CM-MFC) for wastewater treatment and power generation. International Journal of Hydrogen Energy, 38(13): 5383-5388. https://doi.org/10.1016/j.ijhydene.2013.02.092
[22] Mohan, S.V., Saravanan, R., Raghavulu, S.V., Mohanakrishna, G., Sarma, P.N. (2008). Bioelectricity production from wastewater treatment in dual chambered microbial fuel cell (MFC) using selectively enriched mixed microflora: effect of catholyte. Bioresource Technology, 99(3): 596-603. https://doi.org/10.1016/j.biortech.2006.12.026
[23] Tkach, O., Sangeetha, T., Maria, S., Wang, A. (2017). Performance of low temperature Microbial Fuel Cells (MFCs) catalyzed by mixed bacterial consortia. Journal of Environmental Sciences, 52: 284-292. https://doi.org/10.1016/j.jes.2016.11.006