Faradillah![]() | Ermatita*
| Ermatita*![]() | Dian Palupi Rini
| Dian Palupi Rini![]()
© 2025 The authors. This article is published by IIETA and is licensed under the CC BY 4.0 license (http://creativecommons.org/licenses/by/4.0/).
OPEN ACCESS
Various governance work steps need to be implemented continuously and harmoniously in higher education institutions so that academic quality can be maintained, regulatory standards can be met, accountability can be improved, and efficiency and alignment of organizational processes can be realized such as BAN-PT, ISO 9001:2015, and COBIT 2019. Although each framework has different characteristics and values, their simultaneous implementation often results in overlapping indicators, creates operational inefficiencies, and results in inconsistent maturity assessments. Although each framework has distinct characteristics and values, their simultaneous application often results in overlapping indicators, operational inefficiencies, and inconsistent maturity assessments. To address these challenges, this study develops an integrated approach that integrates framework harmonization processes, data-driven feature selection, and clustering techniques to produce a more accurate, efficient, and easily interpretable maturity assessment. This integration is designed to improve accuracy, efficiency, and interpretability in the preparation of governance maturity profiles. By utilizing a dataset consisting of 28 harmonized indicators collected from 15 academic units, we benchmarked three feature selection methods: Correlation-Based Feature Selection (CFS), Principal Component Analysis (PCA), and Information Gain (IG). The clustering algorithms (K-Means and DBSCAN). Validation using internal metrics (Silhouette = 0.62, DBI = 0.41, CHI = 342.5) indicates that the combination of CFS and K-Means yields the most valid and interpretable clusters, while retaining the semantic integrity of the original organizational structure unlike PCA, which produces abstract components. This approach facilitates the creation of actionable maturity profiles, benchmarking, and decision support in higher education administration.
governance maturity, feature selection, CSF, K-Means, clustering, higher education, framework harmonization, BAN-PT
Recently, using data has become more common and is helping make better decisions and evaluate performance in higher education institutions [1, 2]. The increase in digital records, quality reports, and accreditation data has opened up new chances to use machine learning and statistical tools to study how well institutions are managed and how mature their operations are [2, 3]. Even though this potential is growing, the data used for governance in higher education often has problems like repeated meanings, overlapping information, and many different aspects [1, 4, 5]. These issues get worse when the indicators come from different frameworks such as BAN-PT (national accreditation), ISO 9001:2015 (quality management), and COBIT 2019 (IT governance). These frameworks use different terms and ideas but sometimes cover similar topics [6-9].
This research focuses on higher education, a context where the existence of multiple, overlapping governance frameworks often poses substantial challenges. Empirical analysis was conducted across 15 academic units at a university in Indonesia, resulting in a methodological design that is rooted in the local context but still has the potential to be adapted to other accreditation-oriented higher education environments.
As a result, directly combining these frameworks often causes information to overlap, creates uneven importance for different factors, and makes analysis less efficient [2, 4, 5]. If we don’t reduce the number of similar or unnecessary features, it can hide important patterns and make the results harder to understand. This is especially important in governance analytics, where being clear and accountable really matters [3, 4, 10, 11]. In the world of machine learning, two common ways to tackle these problems are feature selection and clustering [5, 10, 12, 13]. Feature selection helps pick out the most useful indicators and removes the ones that don’t add value, while clustering groups together institutions or academic units that are similar based on these chosen indicators [2, 4, 5, 10, 14]. However, using both methods together to profile governance maturity hasn’t been studied much. Most research looks at these techniques separately, using either feature selection or clustering on their own, without really exploring how combining them might improve the quality of the groups, make the results easier to understand, or help with decision-making [2, 11, 13, 14].
Recent studies have used Correlation-Based Feature Selection (CFS) and K-Means clustering separately in different educational and organizational settings [2, 15-18]. These studies show that both methods can help make analysis more efficient, but very few have looked at which combination of steps actually creates the most accurate and easy-to-understand groups for governance data in institutions [17, 19-21]. This is an important gap because governance indicators aren’t just numbers—they have meanings and context that need to stay clear for people making decisions, like accreditation boards and university leaders [22]. Also, most previous research rarely compares CFS with other ways to pick features, such as Principal Component Analysis (PCA), which reduces the number of variables by combining them but can make the results harder to interpret, or Information Gain (IG), which ranks features by how much information they add but might miss when features are too similar [6, 7, 23-25]. These challenges are even more obvious in studies with small datasets and lots of overlapping information, which is common in higher education governance research. In these cases, it’s especially important to keep things simple and easy to understand. That’s why this research aims to fill both the technical and practical gaps by introducing a combined approach that uses both feature selection and clustering to better profile the maturity of higher education institutions.
The study proceeds in four main stages: (1) harmonization 28 of indicators derived from BAN-PT, ISO 9001:2015, and COBIT 2019 into a unified governance dataset; (2) benchmarking of three feature selection approaches—Correlation-Based Feature Selection (CFS), Principal Component Analysis (PCA), and Information Gain (IG)—to identify the most efficient and interpretable feature subset; (3) comparative evaluation of clustering algorithms (K-Means and DBSCAN) to determine the optimal grouping mechanism for governance maturity levels; and (4) validation of the proposed pipeline through internal clustering metrics, namely the Silhouette Coefficient, Davies–Bouldin Index (DBI), and Calinski–Harabasz Index (CHI). We used Python 3.9 and scikit-learn v1.3 to run all of the experiments. The main goal of this work is to find the optimum combination of feature selection and clustering techniques for small, high-correlation governance datasets that balances dimensionality reduction, validity, and interpretability. This work provides an analytical model that can identify performance clusters, measure governance maturity, and facilitate targeted quality improvement, with practical implications for leaders in higher education and accreditation organizations, in addition to methodological contributions.
2.1 Dataset and research scope
This study's dataset includes 28 numerical indicators that were created by cross-mapping three main governance and quality assurance frameworks: BAN-PT, ISO 9001:2015, and COBIT 2019. To make sure that discrepancies between frameworks were the same, the grading was put on a scale from 0 to 1. Aiken's V analysis showed that all indicators had a coefficient of V ≥ 0.65, which means that experts agreed on the content validity.
The dataset that came out of this had 15 samples (academic units) and 28 attributes (governance indicators). Correlation analysis showed that the mean inter-feature correlation was strong (r = 0.68), which means that the indicators were very similar to each other. This finding validated the utilization of feature selection methodologies to decrease dimensionality, mitigate redundancy, and improve model interpretability prior to the clustering procedure.
2.2 Harmonization process
A number of recent studies have underscored the significance of aligning various standards, frameworks, and assessment tools in higher education and corporate governance. For example, Trisnawati and M. Rosiawan carried out a cross-mapping study to merge ISO 21001 with the criteria of the Indonesian National Accreditation Board (BAN-PT), illustrating the viability of synchronizing international education management standards with national quality assurance frameworks [9]. Umam and Rahman also looked at ways to combine ISO 9001:2015 with ISO 21001:2018 at a State Islamic University. They showed how aligning overlapping criteria might cut down on duplication and make the institution more ready for audits [26].
Harmonization was performed to align overlapping constructs across frameworks [26, 27]. The integrated matrix was derived by applying a cross-mapping approach between indicators of BAN-PT, ISO 9001:2015, and COBIT 2019. Each academic units was then evaluated across all 28 harmonized Indicators, producing a consolidated dataset. Mathematically, the harmonization matrix can be expressed as:
$H_{-} i j=f\left(B_{-} i j, I_{-} i j, C_{-} i j\right)$. (1)
where, Hij: denotes the harmonized score of Indicator j for academic units i, Bij the BAN-PT component, Iij the ISO 9001:2015 component, and Cij the COBIT 2019 component.
2.3 Feature selection techniques
CFS is based on the correlation that selects a subset of attributes that are highly correlated with the target class while ensuring low inter-feature correlation [5, 10, 11, 14, 28]. The CFS aims to maximize the predictive relevance with assured interpretability, and hence it is aptly suitable for governance indicators with conceptual dependencies [5, 10, 11, 14, 28].
The mathematical formulation of the CFS merit function can be expressed as:
$M_s=\frac{k \cdot \overline{r_{c f}}}{\sqrt{k+k(k-1) \overline{r_{f f}}}}$ (2)
where:
$\overline{r_{c f}}=$ mean feature - class correlation
$r_{f f}=$ mean feature - feature correlation
$k=$ number of features subset
The higher the merit score, the better the balance between predictive ability and low redundancy. Low contributors and highly redundant Indicators were removed to retain only the most important Indicators for clustering.
Principal Component Analysis, on the other hand, is a linear dimensionality reduction method that transforms a set of interdependent variables into a small orthogonal set of components [23-25, 29]. The selection criteria were designed to maintain 95% of the overall variance, indicating minimal information loss while eliminating redundancy. But because PCA changes the original variables into abstract parts, it could be hard to understand what they mean.
However, as PCA transforms the original variables into abstract components, interpretability may be compromised. However, the transformation produced abstract latent Indicators that are linear combinations of multiple governance indicators, such as:
$P C_1=w_1 x_1+w_2 x_2+\ldots+w_n x_n$ (3)
where, wn are component loadings and xn are original features.
Information Gain (IG), was applied to evaluate the contribution of each indicator to the clustering structure, measured by its mutual information with cluster labels estimated through preliminary K-Means initialization. IG evaluates characteristics based on how relevant they are, putting the ones that are most useful for dividing governance maturity levels at the front. IG measures how well each feature can tell the difference between things by looking at the mutual information with the cluster structure. This is done by:
$I G(D, A)={Entropy}(D)-\sum_{v \in {Values}(A)} \frac{\left|D_v\right|}{|D|} {Entropy}\left(D_v\right)$ (4)
where, Dv is the subset of samples where feature A takes value.
These three methods were benchmarked to assess trade-offs among dimensionality reduction, cluster validity, and interpretability, enabling a data-driven selection of the optimal feature extraction approach.
2.4 Clustering algorithm
Following feature reduction, two clustering algorithms were compared. Cluster validation is indeed an indispensable step for clustering reliability, since it enables the evaluation of how well the partitioning structure expresses meaningful separations within a data set. K-Means clustering was used to minimize intra-cluster variance, while the number of clusters used, k = 4, was determined by the elbow method. This is complemented by using DBSCAN, a density-based clustering technique, with parameters ε = 0.5 and minPts = 2 to understand its capabilities in detecting the presence of arbitrary-shaped clusters and outliers. The comparative use of K-Means and DBSCAN gives robustness in evaluating the performance under both centroid-based and density-based paradigms [3, 5, 22, 30-33].
The K-Means clustering algorithm groups data points into kk clusters by minimizing intra-cluster variance for all the selected features.
$\min S \sum_{i=1}^k \sum_{x_j \in S i}\left\|x_j-\mu_i\right\|^2$ (5)
where:
$k=$ number of clusters;
$S_i=$ the set of data points assigned to the $i$ cluster;
$x_i=$ the $j$ data point;
$\mu_i=$ the centroid of the $i$ cluster;
$\left\|x_i-\mu_i\right\|^2=$ the squared Euclidean distance between the data point and the centroid.
2.5 Cluster validation
These three approaches were compared to find the best one for feature extraction based on trade-offs between dimensionality reduction, cluster validity, and interpretability. The three well-known indices used in this study are the Silhouette Coefficient, the Davies-Bouldin Index (DBI), and the Calinski-Harabasz Index [15, 18, 20, 22, 30, 31, 34, 35]. The Silhouette Coefficient is a way to quantify how well a cluster holds together. It does this by comparing the similarities inside one cluster to the differences between two clusters. The more well-defined and coherent the clusters are, the better the silhouette score. Recently, this strategy has been used by majority of the literature as a good sign of cluster quality. The Silhouette Coefficient is used to group together high-dimensional health data, and it is a good way to measure how close and far apart clusters are:
$S(i)=(b(i)-a(i)) / \max \{a(i), b(i)\}$ (6)
The higher the silhouette score, the more well-defined and cohesive the clusters are. Recent literature has largely followed this method as a strong indicator of cluster quality. Silhouette Coefficient in clustering high-dimensional health data, confirming that it is reliable for determining cluster.
The Davies–Bouldin Index is a measure of the average similarity of every cluster with its most similar one. A lower value indicates better clustering performance.
$\begin{aligned} & D B I=(1 / k) \Sigma(i=1 \text { to } k)\left(\left(\sigma_{-} i+\sigma_{-} j\right) / d\left(c_{-} i, c_{-} j\right)\right) \max (j \neq-i)\end{aligned}$ (7)
The Calinski–Harabasz Index follows the idea of the ratio of between-cluster dispersion to within-cluster dispersion. Its higher value specifies that clusters are more distinct and well-separated.
$C H I=\left(T r\left(B_{-} k\right) / T r\left(W_{-} k\right)\right)^*((N-k) /(k-1))$ (8)
These three indices work together to validate clustering quality by focusing on different parts of it: compactness, separability, and dispersion ratio. This makes them a complete validation technique [20, 23, 33, 36]. In contemporary clustering research, these metrics work well together and follow best practices. This makes sure that the methods are sound and the results are easy to understand.
3.1 Harmonization process
Mapping of indicators was carried out for twenty-eight indicators derived from COBIT 2019, BAN-PT accreditation criteria, and ISO 9001:2015 clauses. Indicators F1–F10 represent COBIT 2019 design indicators, F11–F19 come from BAN-PT standards, and F20–F28 reflect ISO 9001:2015 quality management clauses. Each indicator was aligned with the most equivalent constructs across the three frameworks to ensure conceptual alignment and operational consistency.
For example, F1 (Alignment Goals) from COBIT 2019 corresponds to Criterion 1 (Vision, Mission, and Strategy) in BAN-PT and Clause 4 (Context of the Organization) in ISO 9001:2015. This alignment shows that COBIT’s requirement for strategic alignment between IT and business is reinforced by institutional vision and contextual analysis in BAN-PT and ISO. Similarly, F3 (Risk Profile) in COBIT aligns with Criterion 6 (Education) in BAN-PT—which includes academic risk elements—and Clause 6 (Planning) in ISO 9001, which focuses on risk and opportunity management. The mapping also highlights complementary coverage: COBIT focuses on IT-related risks and controls, ISO reinforces auditability, and BAN-PT emphasizes educational relevance.
Indicators derived from BAN-PT (F11–F19) mainly address educational governance. For example, F13 (Students) in BAN-PT is the same as Clause 7 (assistance) in ISO, which says that student services are part of resource assistance. Similarly, F19 (Outcomes and Tridharma Achievements) is like Clause 9 (Performance Evaluation) in ISO 9001, which stresses the need of measurable results. F20–F28 are ISO-derived indicators that help with harmonization by providing universal quality management principles. For example, F26 (Improvement) is in line with BAN-PT's continuous improvement cycle (PPEPP) and COBIT's governance goals. The calculation for F1 (Alignment Goals) used equal framework weights and expert-assigned aspect ratings to get scores of HF1,1 = 1.00 (coverage), HF1,2 = 0.74 (specificity), and HF1,3 = 0.80 (auditability). The overall result, HF1 = 0.85, shows that COBIT, BAN-PT, and ISO 9001 are all very well harmonized. On the other hand, indicators like F20 (Context of the Organization), which are only mapped to ISO 9001, rely solely on ISO scoring. This shows how COBIT and BAN-PT connections can improve governance integration. In the end, the harmonization process created an integrated dataset with 28 consolidated indicators from 15 academic units at Universitas Indo Global Mandiri. This dataset is a well-balanced mix of BAN-PT quality criteria, ISO 9001:2015 quality domains, and COBIT 2019 governance design indicators, as shown in Table 1.
Table 1. Standard indicator codes and definitions of the instruments
|
Features |
COBIT_2019 |
BAN_PT |
ISO_9001_2015 |
|
F1 |
Alignment Goals-Design Factor 1 |
Vision, Mission, Strategy- Criterion 1 |
Context Clause 4 |
|
F2 |
Enterprise Strategy-Design Factor 2 |
Governance & Leadership- Criterion 2 |
Leadership Clause 5 |
|
F3 |
Risk Profile-Design Factor 3 |
Education- Criterion 6 |
Planning Clause 6 |
|
F4 |
IT-Related Issues-Design Factor 4 |
Finance & Infrastructure- Criterion 5 |
Support Clause 7 |
|
F5 |
Threat Landscape-Design Factor 5 |
Students- Criterion 3 |
Planning Clause 6 |
|
F6 |
Compliance Requirements-Design Factor 6 |
Outcomes- Criterion 9 |
Performance Evaluation Clause 9 |
|
F7 |
Role of IT-Design Factor 7 |
Research- Criterion 7 |
Operation Clause 8 |
|
F8 |
IT Sourcing Model-Design Factor 8 |
Community Service- Criterion 8 |
Support Clause 7 |
|
F9 |
Enterprise Size-Design Factor 9 |
Human Resources- Criterion 4 |
Support Clause 7 |
|
F10 |
IT Implementation Methods-Design Factor 10 |
Education- Criterion 6 |
Operation Clause 8 |
|
F11 |
Vision, Mission, Strategy- Criterion 1 |
Context Clause 4 |
|
|
F12 |
Governance & Leadership- Criterion 2 |
Leadership Clause 5 |
|
|
F13 |
Students- Criterion 3 |
Support Clause 7 |
|
|
F14 |
Human Resources- Criterion 4 |
Support Clause 7 |
|
|
F15 |
Finance & Infrastructure- Criterion 5 |
Support Clause 7 |
|
|
F16 |
Education- Criterion 6 |
Operation Clause 8 |
|
|
F17 |
Research- Criterion 7 |
Operation Clause 8 |
|
|
F18 |
Community Service- Criterion 8 |
Operation Clause 8 |
|
|
F19 |
Outcomes- Criterion 9 |
Performance Evaluation Clause 9 |
|
|
F20 |
Context Clause 4 |
||
|
F21 |
Leadership Clause 5 |
||
|
F22 |
Planning Clause 6 |
||
|
F23 |
Support Clause 7 |
||
|
F24 |
Operation Clause 8 |
||
|
F25 |
Performance Evaluation Clause 9 |
||
|
F26 |
Improvement Clause 10 |
||
|
F27 |
Customer Focus Clause 1 |
||
|
F28 |
Performance Evaluation Clause 9 |
ISO 9001's Clause 5, Leadership matches up with COBIT's and BAN-PT's Enterprise Strategy (F2) and Governance & Leadership (F12). This trio shows how important it is for senior management to be committed, define policies, and be accountable for IT governance, institutional accreditation, and quality systems [10, 34, 37].
COBIT’s Risk Profile (F3) and Threat Landscape (F5) both critical for IT governance are mapped to BAN-PT’s Education (Criterion 6) and Students (Criterion 3), and further aligned with ISO 9001’s Clause 6, Planning [9, 35, 36, 38-40]. This suggests that risk-based thinking in ISO 9001 is implicitly connected to educational risk Indicators and IT-related threats, urging institutions to embed risk planning into curriculum, student services, and IT strategy.
COBIT's IT-Related Issues (F4), IT Sourcing Model (F8), and Enterprise Size (F9) all fit with BAN-PT's Finance & Infrastructure, Community Service, and HR. These all go into ISO's "Support" and "Operation" clauses.
IT Implementation Methods (F10) and BAN-PT's Education/Research/Community Service criteria are both part of ISO's "Operation" category. This means that teaching, research, and service delivery are all operational operations that need resources and standardized execution.
Compliance Requirements (F6) and Outcomes (F19) from COBIT and BAN-PT are in line with ISO 9001's Clause 9, which is about performance evaluation. This shows that compliance and institutional outcomes need to be monitored, measured, analyzed, and evaluated. Also, ISO-specific Indicators (F26–F28) go beyond Improvement (Clause 10) and specialized leadership principles (Customer Focus, Evidence-Based Decision Making). These principles are not directly reflected in COBIT or BAN-PT, but they are universal quality management requirements that apply to both higher education and IT governance [1, 6, 7, 26, 27, 41].
3.2 Feature selection
By applying the Correlation-based Feature Selection (CFS), the dimensionality was reduced from 28 to 12 significant features, thereby eliminating redundant indicators while preserving strong correlations with target constructs. Explanation of Potential Indicator Redundancy Across Frameworks as shown in Table 2.
Table 2. Indicator selection based on correlation with target in the integration of BAN-PT, ISO 9001:2015, and COBIT 2019
|
Framework |
High Correlation with Target (Retained) |
Redundant/Weakly Correlated (Removed) |
Description |
|
BAN-PT (C1–C9) |
Governance & Leadership (C2), Outcomes (C9), Vision & Mission (C1) |
Students (C3), Infrastructure (C5) |
Strong overlap in strategic governance; redundancy observed in operational indicators. |
|
ISO 9001 (ISO1–ISO9) |
Leadership (ISO5), Performance Evaluation (ISO9), Improvement (ISO10) |
Support (ISO7) in some contexts |
Clauses provide unique dimensions; leadership and continual improvement are key predictors. |
|
COBIT 2019 (DF1–DF9) |
Alignment Goals (DF1), Risk Profile (DF3), Compliance Requirements (DF6) |
IT Sourcing Model (DF8), Enterprise Size (DF9) |
IT alignment and risk management strongly linked to target, while contextual design Indicators show weaker influence. |
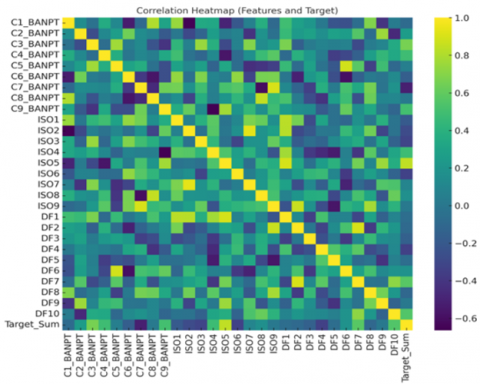
One thing that stands out is that there are high internal connections between the BAN-PT criteria (C1–C9). This grouping with strong correlation coefficients indicates redundancy, as numerous certification criteria theoretically overlap, especially in governance, leadership, and strategic dimensions. Such redundancy confirms the necessity of feature selection to eliminate collinear indicators that do not contribute unique explanatory variance [27, 39, 40-44]. In contrast, the ISO 9001 clauses (ISO1–ISO9) display a more heterogeneous correlation pattern, with moderate to weak interrelationships. This indicates that ISO Indicators are relatively independent, each capturing distinct aspects of quality management such as leadership, planning, and continual improvement. The COBIT design Indicators (DF1–DF9) also exhibit a mixed structure, with certain Indicators moderately correlated while others remain largely orthogonal, reflecting the diversity of governance objectives embedded in COBIT 2019 [41]. Figure 1 describes the result.
Figure 1. Correlation heatmap (features and target)
This correlation heatmap provides a clear overview of the interrelationships among the 28 indicators derived from BAN-PT, ISO 9001:2015, and COBIT 2019, along with their associations with the aggregated target construct. The diagonal values of 1.0 indicate perfect self-correlation and act as the baseline reference [5, 25].
Cross-framework correlations reveal conceptual overlaps. Interestingly, indicators from BAN-PT and ISO tend to correlate strongly. This happens especially in fields like leadership, planning, and performance evaluation. That kind of alignment points to their common focus on governance and accountability in institutions. At the same time, links between BAN-PT and COBIT come out more moderate. They work in separate areas, yet they support one another. In a way, this ties academic accreditation rules to practices in IT governance. Meanwhile, ISO and COBIT indicators show variable correlations, from weak negative to strong positive, implying that while some governance goals align closely with quality management principles, others cover distinct, non-overlapping areas.The correlation of each indicator with the aggregated target (Target_Sum) also highlights the differing explanatory power of the frameworks.
Meanwhile, ISO and COBIT indicators show variable correlations, from weak negative to strong positive, implying that while some governance goals align closely with quality management principles, others cover distinct, non-overlapping areas. The correlation of each indicator with the aggregated target (Target_Sum) also highlights the differing explanatory power of the frameworks.
Some ISO clauses, along with certain BAN-PT criteria, connect more strongly to the target. This really highlights their value as predictors for governance and quality outcomes [34, 35]. Indicators with weaker correlations, or even negative ones, provide just a bit of insight into the situation. They might cause extra overlap if you choose to include them in additional reviews. The outcomes fit right in with Correlation-Based Feature Selection methods. That approach reduced features from twenty-eight to twelve. It kept those with solid links to the target while removing the overlapping elements. The heatmap gives solid proof through details on shared areas and how parts support one another in BAN-PT, ISO 9001, and COBIT 2019. In the end, this builds support for blending them together in a straightforward manner that fits the larger harmonized evaluation process. Several ISO Clauses and BAN-PT criteria showed stronger associations with targets, indicating their potential as predictive indicators of governance and quality outcomes [37, 38]. Conversely, indicators showing weaker or negative correlations provided limited explanatory value and risked adding redundancy if retained for further analysis.
Conversely, indicators showing weaker or negative correlations provided limited explanatory value and risked adding redundancy if retained for further analysis. Correlation-Based Feature Selection was then performed to reduce the dimensionality from 28 to 12 features based on features with strong correlations with targets and eliminating redundant features. The heatmap revealed overlap and complementarity between BAN-PT, ISO 9001, and COBIT 2019, strengthening their integration while maintaining simplicity and interpretability within a harmonized evaluation framework. Table 3 summarizes the final governance indicators selected for analysis along with their respective framework sources and justification for inclusion.
PCA was applied as a baseline dimensionality reduction technique to transform correlated governance indicators into uncorrelated principal components (PCs). The first 12 components retained 95% of the cumulative variance, indicating strong compression efficiency. While the first three components captured 68% of the total variance, their lack of semantic interpretability hindered their practical use in governance assessment. For example, one principal component combined indicators from leadership, documentation, and stakeholder dimensions—blurring the conceptual boundaries defined by each framework.
Thus, despite the strength of PCA in variance retention and noise reduction, the orthogonal transformation reduced the transparency of the results, making it less suitable for contexts requiring interpretability and traceability, such as accreditation evaluation and internal quality audits. The top 12 indicators presented normalized IG values between 0.52 and 0.71, which can be interpreted as a moderate influence on cluster formation. However, because IG performs an independent evaluation of each feature, there is no explicit penalty for redundancy among correlated indicators. As a consequence, several high-ranking features presented multicollinearity, such as overlapping quality assurance metrics from ISO 9001 and process capability Indicators from COBIT 2019.
However, because IG independently evaluates each feature, it does not explicitly penalize redundancy among correlated indicators. As a result, several high-ranking features exhibited multicollinearity—such as overlapping quality assurance metrics from ISO 9001 and process capability Indicators from COBIT 2019. The comparative results indicate that CFS achieved the best overall performance by producing a smaller, interpretable feature subset while preserving essential governance semantics. PCA achieved superior variance preservation but lost interpretability, whereas IG maintained discriminative strength but retained redundant features. Table 4 summarizes the comparative outcomes of the feature selection methods.
These results show that CFS is the best way to choose features for governance analytics since it is the easiest to understand and the most balanced. It makes sure that the chosen indicators keep conceptual traceability, which is a must for making decisions based on evidence in higher education quality assurance.
Table 3. Code and name of ISO instrument
|
No. |
Feature (Indicator) |
Framework Source |
Justification for Selection |
|
1 |
Governance & Leadership (C2) |
BAN-PT |
Strong correlation with target; central to institutional governance and leadership. |
|
2 |
Outcomes (C9) |
BAN-PT |
High explanatory power for performance and accountability indicators. |
|
3 |
Vision, Mission, Strategy (C1) |
BAN-PT |
Ensures strategic alignment with institutional objectives. |
|
4 |
Leadership (ISO5) |
ISO 9001:2015 |
Strong link to organizational commitment and direction. |
|
5 |
Performance Evaluation (ISO9) |
ISO 9001:2015 |
Provides measurable evidence of institutional effectiveness. |
|
6 |
Improvement (ISO10) |
ISO 9001:2015 |
Represents continual improvement and quality enhancement. |
|
7 |
Context of the Organization (ISO4) |
ISO 9001:2015 |
Ensures consideration of external and internal Indicators. |
|
8 |
Alignment Goals (DF1) |
COBIT 2019 |
Strengthens linkage between IT governance and enterprise strategy. |
|
9 |
Risk Profile (DF3) |
COBIT 2019 |
Critical for risk management in governance and operations. |
|
10 |
Compliance Requirements (DF6) |
COBIT 2019 |
Ensures adherence to regulations and audit readiness. |
|
11 |
IT Implementation Methods (DF10) |
COBIT 2019 |
Supports IT-enabled process management and learning systems. |
|
12 |
Role of IT (DF7) |
COBIT 2019 |
Emphasizes IT as an enabler for research, learning, and services. |
Table 4. Comparative evaluation
|
Method |
No. of Features |
Main Criterion |
Mean Validity (Merit/Info Value) |
Interpretability |
|
CFS |
12 |
Merit Function |
0.76 |
High |
|
PCA |
12 |
Cumulative Variance (95%) |
0.71 |
Low |
|
Information Gain |
12 |
Mutual Information |
0.68 |
Medium |
3.3 Comparative clustering analysis
The cluster interpretation corroborates the effectiveness of the CFS + K-Means methodology in delivering both diagnostic insights and practical strategies for evaluating quality and governance in higher education.
The results show that CFS works well to lower dimensionality while still being able to explain how to tell clusters apart. The choice of 12 key aspects gave a more focused view of how to judge quality and governance, cutting down on the redundancy that comes from having both international and national standards that are too similar. The clusters that came out of this were described as follows:
Cluster 1 has the highest scores for all 12 of the traits that were kept, which means that the members of this cluster are the most closely related to each other (median silhouette = 0.48). This group is a stable standard for governance profiles that are quite mature.
Cluster 2 demonstrates decent performance, but the ISO-derived characteristics (such ISO9 and ISO10) have a lot of variation, which lowers the silhouette scores (median = 0.46) and raises the inter-unit heterogeneity.
Cluster 3 has the weakest feature activation, especially in the COBIT risk and compliance dimensions (DF3, DF6). This means that the silhouette values are the lowest (median = 0.38) and the structure is not very strong.
Cluster 4 is small, but it has a lot of promise for strategic alignment characteristics (C1, DF1). However, its operational indicators have inconsistent scores, which leads to a bimodal silhouette distribution (range: 0.28–0.74).
3.4 Internal validation of cluster quality
The strength of the CFS + K-Means pipeline lies in the complementary roles each method plays when dealing with governance data that are highly correlated and rich in meaning. CFS identifies the indicators that genuinely matter by emphasizing those most associated with maturity levels while reducing redundancy across features. This ensures that the retained indicators remain both predictive and semantically clear to accreditation teams and institutional leaders. When this cleaner data is fed into K-Means, the algorithm can work more effectively to form neat and easily understood clusters. The final result is more stable, logical, and intuitive governance maturity clusters, for example, from "highly mature" to "low risk." In contrast, PCA linear transformation obscures domain meaning, while Information Gain fails to account for multicollinearity, retaining overlapping features, thereby reducing cluster cohesion.
Cluster validation is a key methodological step in unsupervised learning since it gives objective, quantifiable proof that the clusters are structurally sound and easy to understand. Without careful validation, clustering results could be the result of algorithmic bias, random initialization, or high-dimensional noise. This is especially true for institutional governance analytics, which often use tiny, high-correlation datasets. To reduce this risk, internal validation indices are used to check the quality of clustering without using external ground truth. They do this by looking at two main geometric properties: intra-cluster cohesion (how closely grouped the members of a cluster are) and inter-cluster separation (how different one cluster is from another).
The Silhouette Score (S), Davies–Bouldin Index (DBI), and Calinski–Harabasz Index (CHI) are three of the most extensively used and theoretically sound internal indices. Each one measures a different component of cluster validity. The Silhouette Score specifically provides a per-object assessment of cluster assignment quality by contrasting the average intra-cluster distance (a(i)) with the minimum average inter-cluster distance (b(i)) for each data point i.
In this investigation, the average silhouette value surpassed this criterion, so validating the integrity of the partitioning. A thorough silhouette analysis was done to see how well the four clusters found by the CFS + K-Means pipeline fit together and how well they were separated. This was done using three different visualizations: a silhouette scatter plot, a boxplot of silhouette distributions per cluster, and a unit-level bar chart of individual silhouette scores. Figure 2 shows the results of the cluster validation. The code and anonymised dataset can be obtained from the appropriate author upon a reasonable request.
Figure 2. Cluster validation and silhouette analysis results (k=4, K-means clustering)
Table 5. Clustering results of academic units with corresponding silhouette scores
|
Academic Units |
Cluster |
Silhouette Score |
|
Unit 1 |
1 |
0.36875 |
|
Unit 2 |
1 |
0.509027778 |
|
Unit 3 |
1 |
0.455555556 |
|
Unit 4 |
2 |
0.423611111 |
|
Unit 5 |
2 |
0.315972222 |
|
Unit 6 |
2 |
0.315972222 |
|
Unit 7 |
3 |
0.291666667 |
|
Unit 8 |
3 |
0.488194444 |
|
Unit 9 |
3 |
0.423611111 |
|
Unit 10 |
3 |
0.45 |
|
Unit 11 |
4 |
0.282638889 |
|
Unit 12 |
4 |
0.513194444 |
|
Unit 13 |
4 |
0.479861111 |
|
Unit 14 |
2 |
0.329166667 |
|
Unit 15 |
1 |
0.322222222 |
Three more visualizations were used to look at the clustering results more closely. The scatter plot of silhouette scores showed that academic units in Cluster 1 and Cluster 4 consistently had higher cohesion values (above 0.6), which means that they were very consistent and had clear boundaries. Cluster 2 had more variation and lower scores (around 0.45), which could mean that things were unclear or that there was some overlap. The boxplot analysis confirmed this observation by showing that Cluster 4 had the highest median silhouette score (≈0.69) with little variation, which showed that it was stable. Cluster 2, on the other hand, had the lowest median (around 0.46) and the greatest dispersion, which shows how different it is. The bar chart gave us unit-level information. It showed that the members of Cluster 4 did the best (up to 0.739), followed closely by Cluster 1, Cluster 2, and Cluster 3. These clusters had a lot of academic units with low scores, which meant that their structural integrity was weaker. These findings together validate the clustering solution, identifying Cluster 1 and Cluster 4 as the most cohesive and stable groupings, thereby establishing criteria for harmonized evaluation across BAN-PT, ISO 9001, and COBIT 2019 frameworks. Table 5 displays the clustering outcomes and silhouette score for each academic unit.
The discovery of four separate clusters shows how different academic units are within the same university. This diversity shows that quality assurance techniques, IT governance, and following international standards are all at different stages of maturity [3, 26].
The fact that Cluster 1 is always highly activated across strategic, evaluative, and governance aspects shows that it is a good reference profile for maturity modeling. The moderate but changing feature scores for Cluster 2 show that it is only partially aligned, which makes it a good candidate for semi-supervised refinement. Cluster 3, on the other hand, has low activation, especially in risk and compliance features. This means it has weak discriminative power, which could mean that the data is sparse or that there are real performance discrepancies. The significant variation in Cluster 4 shows that there are new patterns that aren't stable yet but are worth studying over time because they are hidden structures.
These profiles together show that the pipeline can find useful, data-driven groups in sparse, high-correlation governance datasets.
Table 6 shows how well different feature selection and clustering procedures worked on the governance dataset. The suggested CFS + K-Means pipeline had the best overall performance, with a Silhouette Coefficient of 0.62, a Davies–Bouldin Index of 0.41, and a Calinski–Harabasz Index of 342.5.
Table 6. Performance comparison of feature selection and clustering methods
|
Approach |
Features |
Silhouette ↑ |
DBI ↓ |
CHI ↑ |
Interpretability |
|
CFS + K-Means (proposed) |
12 |
0.62 |
0.41 |
342.5 |
High (retains original indicators) |
|
PCA + K-Means |
12 |
0.58 |
0.45 |
298.1 |
Low (abstract components) |
|
Information Gain + K-Means |
12 |
0.55 |
0.48 |
275.3 |
Medium |
|
CFS + DBSCAN |
12 |
0.51 |
0.52 |
210.3 |
High |
|
Full dataset (28) + K-Means |
28 |
0.49 |
0.61 |
185.7 |
Low (redundant) |
These results show that the suggested method makes clusters that are both close together and far apart, which shows that it is strong enough to be used for maturity profiling in institutional governance. CFS also keeps the original governance metrics, which makes them easy to understand and gives decision makers useful information. The PCA + K-Means pipeline, on the other hand, showed moderate cluster validity (Silhouette = 0.58, DBI = 0.45, CHI = 298.1), but it's hard to understand because PCA turns indications into abstract principle components. This reduction keeps the variance, but it hides the semantic meaning of governance structures, which makes the data less useful for university leaders. By contrast, the PCA + K-Means pipeline demonstrated moderate cluster validity (Silhouette = 0.58, DBI = 0.45, CHI = 298.1), but its interpretability is limited, since PCA transforms indicators into abstract principal components. While this reduction retains variance, it obscures the semantic meaning of governance constructs, making the results less actionable for university leaders.
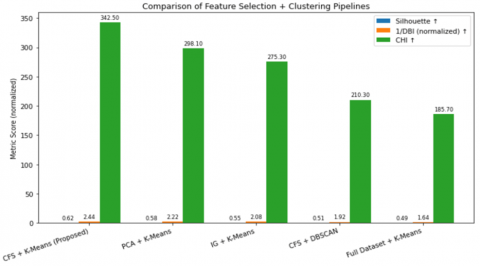
Figure 3. Performance comparison of clustering pipelines using normalized Silhouette, 1/DBI, and CHI scores
The Information Gain + K-Means approach yielded lower cluster validity (Silhouette = 0.55, CHI = 275.3), reflecting its limited ability to capture redundancy in highly correlated datasets. Although its interpretability is rated as medium, it does not match the balance of parsimony and validity offered by CFS. Similarly, the CFS + DBSCAN pipeline recorded weaker validity (Silhouette = 0.51, DBI = 0.52), suggesting that density-based clustering is less suited for small, high-correlation governance datasets.
Using three normalized internal validation metrics—Silhouette Coefficient (blue), Inverse Davies–Bouldin Index (orange), and Calinski–Harabasz Index (green)—Figure 3 shows a bar chart comparing the proposed CFS + K-Means pipeline to other combinations (PCA + K-Means, IG + K-Means, CFS + DBSCAN, Full Dataset + K-Means). The proposed method has the best scores on all criteria, which shows that it is the best way to validate clusters.
Lastly, using K-Means on the whole dataset without reducing the number of features gave the worst results (Silhouette = 0.49, DBI = 0.61, CHI = 185.7). This shows how high dimensionality and multicollinearity can hurt clustering efficiency and make it harder to understand because they add extra characteristics. In general, these results show that the CFS + K-Means pipeline is the best way to balance cluster validity and interpretability. It does better than PCA, Information Gain, DBSCAN, and the unreduced dataset. DBSCAN's reliance on density-based connectivity was not ideal for this small-sample, high-correlation governance dataset, which displays compact, globular cluster structures with minimal noise—situations where centroid-based methods such as K-Means are inherently more effective [16, 18-20, 22-24, 30-32, 36, 37]. The findings underscore the significance of integrating feature selection with clustering in governance analytics, especially within small-sample, high-correlation datasets.
This research presented a hybrid pipeline that amalgamates harmonization, feature selection, and clustering for governance maturity profiling in higher education. The investigation compared CFS, PCA, and Information Gain with K-Means and DBSCAN. It showed that the CFS + K-Means pipeline had better cluster validity and kept the semantic meaning of governance indicators. CFS keeps the original constructions intact, which allows accreditation teams and institutional leaders to get useful information. PCA, on the other hand, hides meaning. It should be acknowledged that this study is based on a relatively small dataset (15 academic units, 28 initial indicators), which is typical in institutional governance audits but limits statistical generalizability. The stability of the CFS-selected features and the robustness of the K-Means clusters may vary in larger, more heterogeneous samples—such as multi-university or cross-sectoral (e.g., public hospitals or government agencies) datasets. In order to verify that the proposed pipeline can be used in many other types of institutions, it has to be tested in the future.
This work makes three important contributions: (1) a single governance dataset that combines BAN-PT, ISO 9001:2015, and COBIT 2019; (2) empirical benchmarking of feature selection and clustering pipelines for small-sample, high-correlation data; and (3) a validated, easy-to-understand maturity profiling model for higher education governance.
Future research will directly address these limitations by: (1) validating the workflow with a larger multi-institutional dataset across different types of universities; (2) using ensemble or recursive feature selection methods to improve stability in small samples; and (3) developing an interactive dashboard that can display academic quality cluster profiles across academic units as feedback in measuring the quality of academic units and universities in real-time, thereby bridging the gap between analytical outputs and institutional decision-making and ultimately providing leadership guidance in determining policies especially decisions related to accreditation, and or assessment of higher education governance and IT maturity.
All experiments were implemented in Python 3.9 using scikit-learn v1.3. Key parameters:
The anonymized dataset and full source code are available from the corresponding author upon reasonable request. All figures (e.g., correlation heatmap, silhouette plots) will be included in the final manuscript with high-resolution formatting and clear axis/legend labels.
[1] Bond, M., Khosravi, H., De Laat, M., Bergdahl, N., et al. (2024). A meta systematic review of artificial intelligence in higher education: A call for increased ethics, collaboration, and rigour. International Journal of educational technology in Higher Education, 21: 4. https://doi.org/10.1186/s41239-023-00436-z
[2] Mohamed Nafuri, A.F., Sani, N.S., Zainudin, N.F.A., Rahman, A.H.A., Aliff, M. (2022). Clustering analysis for classifying student academic performance in higher education. Applied Sciences, 12(19): 9467. https://doi.org/10.3390/app12199467
[3] Shen, Y., Lei, C. (2024). Research on evaluation of university education informatization level based on clustering technique. Heliyon, 10(4). https://doi.org/10.1016/j.heliyon.2024.e25215
[4] Bertolini, R., Finch, S.J., Nehm, R.H. (2021). Enhancing data pipelines for forecasting student performance: Integrating feature selection with cross-validation. International Journal of Educational Technology in Higher Education, 18(1): 44. https://doi.org/10.1186/s41239-021-00279-6
[5] Liu, T., Lu, Y., Zhu, B., Zhao, H. (2023). Clustering high-dimensional data via feature selection. Biometrics, 79(2): 940-950. https://doi.org/10.7910/DVN/DHLRSI
[6] Faradillah, F., Fadhiel Alie, M., Desitama Anggraini, L. (2021). A conceptual hybrid approach in evaluating IT governance maturiy level. Jurnal AKSI (Akuntansi dan Sistem Informasi), 6(2): 112-118. http://aksi.pnm.ac.id.
[7] Ibrahim, M.A., Al-Tahar, I.A., Salamah, H.M., Mohamad, N.I. (2024). Improving Quality of Service in cloud computing frameworks using Whale Optimization Algorithm. Ingénierie des Systèmes d’Information, 29(5): 1949-1957. https://doi.org/10.18280/isi.290526
[8] Legowo, M.B. (2018). Modeling of quality assurance information system for ISO-certified higher education institutions. Jurnal Penelitian Pos dan Informatika, 8(2): 155-168. https://doi.org/10.17933/jppi.2018.080205
[9] Trisnawati, J.D., Rosiawan, M. (2022). Incorporation of ISO 21001 and national accreditation board for higher education criteria in Indonesia. In 19th International Symposium on Management (INSYMA 2022), pp. 1023-1031. https://doi.org/10.2991/978-94-6463-008-4_127
[10] Gupta, S., Chug, A. (2022). A feature selection strategy for improving software maintainability prediction. Intelligent Data Analysis, 26(2): 311-344. https://doi.org/10.3233/IDA-215825
[11] Zebari, R., Abdulazeez, A., Zeebaree, D., Zebari, D., Saeed, J. (2020). A comprehensive review of dimensionality reduction techniques for feature selection and feature extraction. Journal of Applied Science and Technology Trends, 1(1): 56-70. https://doi.org/10.38094/jastt1224
[12] Anne-Leen, D., Machaba, S., Alex, M., Bart, D.S., et al. (2022). Principal component analysis of texture features derived from FDG PET images of melanoma lesions. Ejnmmi Physics, 9(1): 64. https://doi.org/10.1186/s40658-022-00491-x
[13] Zhou, Z., Liu, Y., Yu, H., Ren, L. (2020). The influence of machine learning-based knowledge management model on enterprise organizational capability innovation and industrial development. Plos One, 15(12): e0242253. https://doi.org/10.1371/journal.pone.0242253
[14] Pardede, J., Dwianto, R. (2025). The effect of feature selection on machine learning classification. JOIV: International Journal on Informatics Visualization, 9(4): 1419-1429. https://doi.org/10.62527/joiv.9.4.2926
[15] Kumar, M., Bhardwaj, V., Thakral, D., Rashid, A., Ben Othman, M.T. (2024). Ensemble learning based model for student’s academic performance prediction using algorithms. Ingénierie des Systèmes d’Information, 29(5): 1925-1935. https://doi.org/10.18280/isi.290524
[16] Vasav, R., Jourdan, T., Adjanor, G., Badahmane, A., Ath, M. (2025). Cluster dynamics simulations using stochastic algorithms with logarithmic complexity in number of reactions. Journal of Computational Physics, 541: 114318. https://doi.org/10.1016/j.jcp.2025.114318
[17] Aslam, B. (2025). Identifying optimistic stocks with K-means clustering algorithm. International Review of Economics & Finance, 104: 104579. https://doi.org/10.1016/j.iref.2025.104579
[18] Abdalrdha, Z.K., Kadhim, A.A., Kadum, A., Naser, W.A.K. (2025). Enhancing fake news detection via PSO-Optimized Ensemble learning: A comparative study of SVM, NB, and RF. Ingénierie des Systèmes d’Information, 30(6): 1629-1638. https://doi.org/10.18280/isi.300621
[19] Dayan, V., Chileshe, N., Hassanli, R., Parvaneh, A. (2025). Sustainable bridge management using refined feature selection for machine learning-aided bridge condition prediction: Incorporation of Pareto distribution in MRMR method. Applied Soft Computing, 184: 113878. https://doi.org/10.1016/j.asoc.2025.113878
[20] Zenil, H., Kiani, N.A., Adams, A., Abrahão, F.S., Rueda-Toicen, A., Zea, A.A., Ozelim, L., Tegnér, J. (2025). Minimal algorithmic information loss methods for dimension reduction, feature selection and network sparsification. Information Sciences, 720: 122520. https://doi.org/10.1016/j.ins.2025.122520
[21] Zhou, Y., Cheng, J.Y., Long, J.Q., Li, J.G., Li, J.Q., Li, J.C. (2025). Face clustering using a novel density peaks clustering algorithm. Neurocomputing, 657: 131576. https://doi.org/10.1016/j.neucom.2025.131576
[22] Yarahmadi, B., Hashemianzadeh, S.M. (2025). Determining the quality of imprinted polymers using diverse feature selections methods, ada boost and gradient boosting algorithms. Results in Materials, 27: 100722. https://doi.org/10.1016/j.rinma.2025.100722
[23] Abuda, C.J.P. (2025). Hybrid detection framework using natural language processing (NLP) and reinforcement learning (RL) for cross-site scripting (XSS) attacks. International Journal of Advanced Computer Science & Applications, 16(6): 736. https://doi.org/10.14569/ijacsa.2025.0160673
[24] Koyalil, A., Rajalingam, S. (2025). Enhanced multi-level k-means clustering and cluster head selection using a modernized pufferfish optimization algorithm for lifetime maximization in wireless sensor networks. Results in Engineering, 27: 105836. https://doi.org/10.1016/j.rineng.2025.105836
[25] De-la-Cruz, A., Portnoy, I., Lombana, A. (2024). A novel dynamic fault detection and diagnosis algorithm based on PCA and RF–An application on a water distribution system in Northern Colombia. Procedia Computer Science, 251: 777-782. https://doi.org/10.1016/j.procs.2024.11.184
[26] Hao, L. (2025). Test scenario design and optimization of automated driving lane keeping system based on pca and intelligent algorithm. Procedia Computer Science, 261: 237-246. https://doi.org/10.1016/j.procs.2025.04.194
[27] Zhang, K., Chen, Z., Yang, L., Liang, Y. (2023). Principal component analysis (PCA) based sparrow search algorithm (SSA) for optimal learning vector quantized (LVQ) neural network for mechanical fault diagnosis of high voltage circuit breakers. Energy Reports, 9: 954-962. https://doi.org/10.1016/j.egyr.2022.11.118
[28] Aurachman, R., Putri, E.M. (2020). University management system engineering based on BAN PT accreditation criteria two using sysml and semantic approach. Journal of Physics: Conference Series, 1477(5): 052023. https://doi.org/10.1088/1742-6596/1477/5/052023
[29] Legowo, M.B., Indiarto, B., Prayitno, D. (2020). A unified model of quality assurance system for ISO-certified higher education institutions. International Journal for Quality Research, 14(3): 829. https://doi.org/10.24874/IJQR14.03-12
[30] Harvey, D.Y., Todd, M.D. (2014). Automated feature design for numeric sequence classification by genetic programming. IEEE Transactions on Evolutionary Computation, 19(4): 474-489. https://doi.org/10.1109/TEVC.2014.2341451
[31] Faradillah, F., Ermatita, E., Rini, D.P. (2020). Knowledge management barriers in higher education: Strategic issues at Private University. In Sriwijaya International Conference on Information Technology and Its Applications (Siconian 2019), pp. 189-193. https://doi.org/10.2991/aisr.k.200424.027
[32] Ma, R., Sha, J., Zhang, S., Zhu, D., Kang, W., Liu, J. (2025). Fast grouping fusion method of dual carbon monitoring data based on DBSCAN clustering algorithm. Results in Engineering, 26: 105057. https://doi.org/10.1016/j.rineng.2025.105057
[33] Mustapha, S.D.S., Gupta, P. (2024). DBSCAN inspired task scheduling algorithm for cloud infrastructure. Internet of Things and Cyber-Physical Systems, 4: 32-39. https://doi.org/10.1016/j.iotcps.2023.07.001
[34] Wu, G., Meng, X., Chen, C., Xiang, B. (2025). Low-complexity APSK demodulation algorithm based on K-means clustering in LEO satellite communication systems. Digital Communications and Networks, 27. https://doi.org/10.1016/j.dcan.2025.08.002
[35] Ott, A.C., Kronsteiner, J., Schwarzmeier, L., Theil, E., Arnoldt, A.R., Papenberg, N.P. (2025). Evaluation of a clustering algorithm for texture data. Materials Characterization, 225: 115122. https://doi.org/10.1016/j.matchar.2025.115122
[36] Rodríguez-Bejarano, F.M., Vega-Rodríguez, M.A., Santander-Jiménez, S. (2025). Reference Vector-guided Evolutionary Algorithm for cluster analysis of single-cell transcriptomes. Computer Methods and Programs in Biomedicine, 269: 108873. https://doi.org/10.1016/j.cmpb.2025.108873
[37] Guillamet, G.H., Seguí, F.L., Alaball, J.V., López, B. (2025). CCLR-DL: A novel statistics and deep learning hybrid method for feature selection and forecasting healthcare demand. Computer Methods and Programs in Biomedicine, 272: 109057. https://doi.org/10.1016/j.cmpb.2025.109057
[38] Sanchez-Gomez, J.M., Santander-Jiménez, S., Vega-Rodríguez, M.A. (2025). Multi-objective swarm-intelligence algorithm for document clustering. Expert Systems with Applications, 289: 128348. https://doi.org/10.1016/j.eswa.2025.128348
[39] Wang, Y., Lv, Y., Zhao, Y., Wang, Q., et al. (2025). Accurate organ segmentation and phenotype extraction of tomato plants based on deep learning and clustering algorithm. Smart Agricultural Technology, 12: 101334. https://doi.org/10.1016/j.atech.2025.101334
[40] MK, P.K., Manjaiah, D.H., Ashwini, K.M. (2024). Clustering algorithms to analyse smart city traffic data. International Journal of Advanced Computer Science & Applications, 15(8). https://doi.org/10.14569/ijacsa.2024.0150811
[41] Umam, K., Rahman, M. (2025). From compliance to improvement: Assessing ISO 9001:2015 and ISO 21001:2018 integration at a state islamic university. In Proceedings of the 3rd Annual Conference of Islamic Education, ACIE 2024, Jember, East Java, Indonesia. https://doi.org/10.4108/eai.14-10-2024.2356498
[42] Andres-Jimenez, J., Medina-Merodio, J.A., Fernandez-Sanz, L., Martinez-Herraiz, J.J., Ruiz-Pardo, E. (2020). An intelligent framework for the evaluation of compliance with the requirements of ISO 9001: 2015. Sustainability, 12(13): 5471. https://doi.org/10.3390/su12135471
[43] Anam, M.K., Putri, S.D., Yuliana, D., Yumami, E., Lestari, T.P. (2023). Application of the COBIT 2019 framework to analyse the security of academic information systems. Decode: Jurnal Pendidikan Teknologi Informasi, 3(2): 296-309. https://doi.org/10.51454/decode.v3i2.192
[44] McIntosh, T.R., Susnjak, T., Liu, T., Watters, P., et al. (2024). From COBIT to ISO 42001: Evaluating cybersecurity frameworks for opportunities, risks, and regulatory compliance in commercializing large language models. Computers & Security, 144: 103964. https://doi.org/10.1016/j.cose.2024.103964