Ahyar Supani![]() | Siti Nurmaini*
| Siti Nurmaini*![]() | Radiyati Umi Partan
| Radiyati Umi Partan![]() | Bhakti Yudho Suprapto
| Bhakti Yudho Suprapto![]() | Yuli Andriani
| Yuli Andriani![]()
© 2025 The authors. This article is published by IIETA and is licensed under the CC BY 4.0 license (http://creativecommons.org/licenses/by/4.0/).
OPEN ACCESS
Manual stenosis interpretation in X-ray Coronary Angiography (XCA) is often subjective and prone to high inter-observer variability, primarily due to the small diameter of coronary arteries. Moreover, current automatic detection methods remain inadequate in addressing the wide variability in stenosis shapes and sizes. This study proposes a deep learning-based approach to enhance segmentation performance by focusing on the stenosis area through region-based cropping. The proposed method evaluates three CNN architectures—ResNet34, UNet, and Residual UNet—for a binary stenosis segmentation task using 100x100-pixel cropped patches. Residual UNet achieved the best performance, with 99.22% accuracy, 88.25% IoU, 87.82% precision, 86.89% recall, and an F1-score of 86.78%. These results highlight the potential of binary segmentation in reducing inter-observer variability and improving CAD diagnostic support, particularly in resource-constrained environments. Residual UNet also reduces reliance on manual interpretation.
binary stenosis segmentation, X-ray coronary angiography, residual UNet, ResNet34, UNet, CNN architecture
Artificial Intelligence (AI) has demonstrated reliable capabilities that play a pivotal role in modern society [1-3], offering solutions with a high likelihood of achieving desired outcomes [4]. The integration of AI into various domains continues to expand, with significant applications in infrastructure [5], governance [6], agriculture [7], and healthcare [8]. Organizations and companies increasingly adopt AI technologies to enhance decision-making processes by analyzing vast amounts of data through algorithmic approaches such as Machine Learning (ML). Leveraging neural networks, ML can extract critical features from data to construct models [9-11] that generate actionable knowledge, thereby supporting both institutional and individual activities.
In the healthcare sector, Artificial Intelligence (AI) has been widely applied across various domains, including medical diagnosis, treatment planning, drug discovery, and disease research [12]. One area that continues to attract significant research interest is coronary artery disease (CAD), a leading cause of sudden death and a persistent global health challenge. Recent studies have demonstrated the potential of Machine Learning (ML) in predicting CAD [13]. The primary pathological basis of CAD is the narrowing of the coronary arteries, a condition referred to as stenosis [14]. Stenosis is a critical clinical marker for diagnosing CAD, typically evaluated based on the degree of arterial narrowing [15, 16]. Stenosis can occur along either the left or right coronary arteries, leading to reduced blood flow and abnormal myocardial wall motion due to atypical arterial vibrations [17]. Early detection of stenosis plays a critical role in preventing complications, such as stroke and other cardiovascular events [18]. However, individuals with insignificant stenosis—classified within the minimal to moderate narrowing categories—often remain asymptomatic [19]. In such cases, screening is typically conducted using X-ray coronary angiography (XCA) through catheterization, where Physician Visual Assessment (PVA) remains the clinical gold standard for evaluating stenosis severity.
Nonetheless, several challenges hinder accurate assessment. Coronary arteries are relatively small, with an average diameter of approximately 3–4 mm [20], making precise visual evaluation difficult. This challenge is further compounded in stenotic regions where the arterial diameter is reduced [21]. Although Quantitative Coronary Angiography (QCA) devices are designed to offer more accurate and objective measurements, they are prohibitively expensive and rely on manual, resource-intensive procedures. Moreover, the evaluation of stenosis in dynamic XCA video frames introduces additional complexity due to cardiac motion and inter-individual anatomical variation. These factors contribute to the ambiguity and inconsistency in stenosis interpretation. Despite the existence of several AI-based approaches, many still fall short of the performance levels required for clinical deployment [22]. Therefore, the development of improved and reliable stenosis detection methods remains a pressing need.
To date, the application of Machine Learning (ML) continues to be extensively studied and developed for the identification of coronary artery disease (CAD). To improve model performance, various studies have implemented data preprocessing, feature selection, and optimization techniques. For example, Abdar et al. [23] normalized categorical and numerical attributes, performed feature selection, and eliminated redundant features using Genetic Algorithms and Particle Swarm Optimization (PSO). Similarly, Shahid et al. [15] employed a hybrid PSO-based Extreme Learning Machine (PSO-ELM) for CAD diagnosis, incorporating the Fisher algorithm for feature selection to enhance model accuracy.
Joloudari et al. [24] proposed a feature ranking-based method to select significant predictive features, thereby improving classification performance. Kwankye and Dadzie [25] utilized the Synthetic Minority Oversampling Technique (SMOTE) to address class imbalance, applied one-hot encoding to categorical features, and handled missing values and outliers to optimize model learning. Zhang et al. [26] also adopted SMOTE along with Adaptive Synthetic Sampling (ADASYN) to balance the dataset, and evaluated performance using the eXtreme Gradient Boosting (XGBoost) algorithm.
Sayadi et al. [27] focused on feature selection to enhance model performance, evaluating the results across various algorithms including Decision Tree, Deep Learning, Logistic Regression, Random Forest, Support Vector Machine (SVM), and XGBoost. Gupta et al. [28] addressed data quality issues by eliminating missing or duplicate entries and applied a standard scaler to normalize data values on a common scale, which is useful for identifying and handling non-zero (non-null) values within the dataset.
Supani et al. [13] handled missing values through data duplication, converted categorical data into numerical format using one-hot encoding, and standardized numerical data using a standard scaler. Additionally, they performed hyperparameter tuning for each model using the Grid Search (GS) algorithm to optimize performance. In a subsequent study, Supani et al. [29] applied similar preprocessing steps—data duplication for missing values, scaling for numeric features, and one-hot encoding for categorical variables—across two evaluated models: XGBoost and K-Nearest Neighbors (KNN). To optimize these models, Grid Search combined with 3-fold cross-validation was implemented.
Numerous studies have been conducted to enhance the performance of Machine Learning (ML) models for the diagnosis of CAD. However, these models still face limitations in fully addressing the challenges of CAD identification, particularly when relying on cardiac health screening data in tabular form. In contrast, stenosis images obtained from XCA are considered the gold standard for CAD diagnosis [30, 31].
Traditional ML approaches also present several drawbacks. These include the need for multiple preprocessing steps, such as manual feature extraction and selection [32, 33], as well as data augmentation procedures that are often labor-intensive and time-consuming [34]. The structured and limited nature of tabular datasets further complicates the development of robust models, often requiring extensive hyperparameter tuning to achieve satisfactory performance [35-38]. These factors contribute to delays in generating actionable insights for clinical decision-making.
To address the limitations of conventional ML methods, recent research has increasingly turned to Deep Learning (DL) approaches for medical image analysis and outcome prediction [39]. Notable examples include coronary artery segmentation [14, 40-43] and stenosis classification [44, 45], which demonstrate the potential of DL to streamline the diagnostic process and improve accuracy.
Currently, the application of Deep Learning (DL) for stenosis analysis in the context of CAD identification has been explored in several studies. For instance, Au et al. [46] addressed the Quantitative Coronary Angiography (QCA) task by characterizing right coronary artery stenosis through a three-step process: localization, segmentation, and classification. The localization output was segmented, and the resulting outputs were classified using a regression model with a 70% threshold to determine the presence of significant stenosis.
Chen et al. [40] proposed a method to enhance segmentation performance by filtering the coronary tree and integrating the original coronary artery image with a vessel map. This enriched input was fed into a 3D multichannel UNet model to better capture the tubular structure of coronary arteries. Similarly, Zreik et al. [16] extracted the coronary artery centerline to generate multi-planar reformatted (MPR) images. These MPR images were then annotated based on three categories: no stenosis, stenosis <50%, and stenosis >50%.
Wu et al. [44] introduced a sequence-frames-per-second (seq-fps) module designed to preserve the temporal consistency of sequential XCA frames, which effectively reduced false positives and improved stenosis detection accuracy. Meanwhile, Ovalle-Magallanes et al. [30] developed synthetic artificial data to enhance model generalization. They applied the “optimal cut and fine-tuned layer” method, evaluating 20 different configurations per layer within a transfer learning framework. Three fine-tuning strategies were explored: training on real data only, artificial data only, and a combination of both, each yielding promising results.
Rodrigues et al. [22] proposed a method for detecting stenosis based on view angles in XCA. The detected stenosis regions were highlighted using bounding boxes on the region of interest, utilizing the RetinaNet model. In a different approach, Moon et al. [45] recognized stenosis by extracting key frames from right coronary artery video sequences. They applied a self-attention module for classification, focusing on stenosis with ≥50% narrowing, and visualized the specific locations of the stenotic lesions.
Zhao et al. [19] performed coronary artery segmentation by generating a probability map, which was then fused with the original image and an edge-enhanced version. These three channels were input into a multi-input and multi-scale (MIMS) UNet model to produce the final segmentation output. Furthermore, Zreik et al. [31] conducted fractional flow reserve (FFR) estimation using coronary computed tomography angiography (CCTA). They integrated the coronary artery tree with the left ventricular (LV) myocardium and applied a convolutional autoencoder (CAE) to characterize both anatomical structures.
Chen et al. [47] investigated the detection of coronary artery stenosis in X-ray coronary angiography using a convolutional neural network (CNN) with temporal fusion, which integrates convolution and attention modules. The results showed that this fusion strategy significantly improved performance in distinguishing stenosis (P < 0.05), achieving an accuracy of 88.4%, a recall of 86.3%, and a specificity of 90.2%.
Despite recent advances, existing deep learning-based studies on automated stenosis detection have yet to achieve optimal effectiveness and efficiency, particularly for early diagnosis of coronary artery disease (CAD). Therefore, further research and development of deep learning approaches for automated stenosis analysis using X-ray coronary angiography remain essential. These efforts are crucial not only to enhance diagnostic accuracy and clinical applicability but also to address the challenge of interobserver variability through automated methods.
This paper aims to produce a high-performance binary stenosis segmentation model for detecting and analyzing stenosis in X-ray coronary angiography by testing three architectures: Resnet34, UNet, and Residual UNet on coronary artery stenosis dataset after cropping on the stenosis area. The private stenosis dataset, obtained from two hospitals in Indonesia, is used to validate the experimental results. All three models are trained using identical hyperparameters to ensure fair comparison. The study targets binary segmentation of stenosis into two classes: normal (narrowing <50%) and abnormal (narrowing ≥50%) [48], with a balanced distribution between the two. The primary contribution of this work lies in the comprehensive evaluation of standard Convolutional Neural Network (CNN) architectures for the task of stenosis segmentation. This approach enables a more streamlined and practical implementation of CNNs for detecting stenosis contours in X-ray coronary angiography. The key novelties and contributions of this study are summarized as follows:
We structure the rest of this paper as follows: Section 2 explains the methodology used in conducting the research more clearly; for example, stenosis image preprocessing in X-ray coronary angiography. Explanation of segmentation models: ResNet34, UNet, and residual UNet. Section 3 presents the results and discussion in tables and graphs for each experiment of the model and discusses the results by comparing them with other studies. Finally, section 4 presents a conclusion, which explains the findings generated by the models and presents one best model.
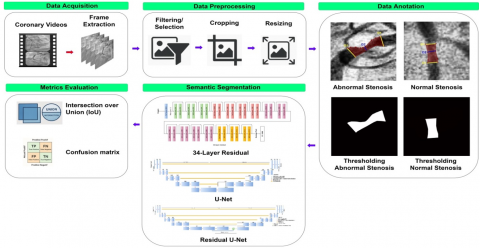
This section outlines the stages of the research, beginning with the collection, selection, and validation of coronary artery stenosis data. It then describes the pre-processing procedures applied to the stenosis images, the design of the proposed model architecture, and the evaluation of the experimental results. The workflow is illustrated in Figure 1.
2.1 Collection of raw data
Coronary artery data is difficult to obtain and is not yet widely available to the public. During the raw data collection phase, a total of 242 coronary artery stenosis videos were collected from 30 patients diagnosed with coronary artery disease (CAD) at two hospitals in Palembang, Indonesia, between January 2022 and December 2022. These videos were categorized by their sources based on the severity of stenosis, including 94 videos from 14 patients with stenosis less than 50%, classified as non-significant narrowing (normal), and 148 videos from 16 patients with stenosis greater than 50%, classified as significant narrowing (abnormal). Additionally, 31 other videos were prepared as unseen data, consisting of 19 videos from 9 patients with stenosis greater than 50% and 12 videos from 8 patients with stenosis less than 50%.
Figure 1. Workflow of binary stenosis segmentation
2.2 Video to image conversion
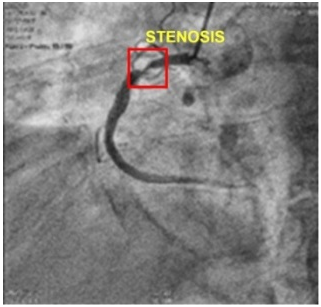
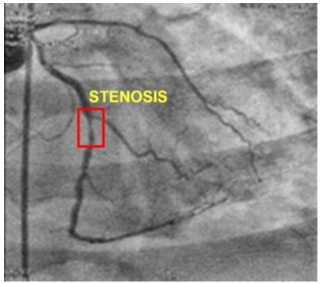
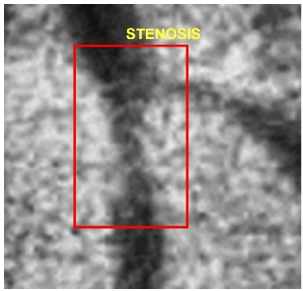
X-ray coronary angiography was produced with a resolution of 512x512 pixels, where the vessel segment affected by the lesion (stenosis) is highlighted with a red rectangular box in Figure 2(a) for the abnormal case and Figure 2(b) for the normal case. This conversion process resulted in a total of 1,400 frames for training and testing data, consisting of 700 normal and 700 abnormal frames. Meanwhile, unseen data was collected separately, comprising 403 frames in total, including 173 normal and 230 abnormal frames.
(a) Abnormal coronary artery stenosis
(b) Normal coronary artery stenosis
Figure 2. Coronary artery stenosis with 512×512 px
2.3 Pre-processing
Preprocessing is the initial step in preparing stenosis images for analysis, involving a cropping operation. The primary objective of this stage is to center the area of stenosis within the frame, thereby enhancing the focus on the region of interest through a square cropping approach [49-51], in order to obtain equal height and width dimensions, resulting in a well-balanced stenosis area [52-54]. The theoretical foundation of the cropping technique is based on a set of mathematical expressions defined in Eq. (1) to (4) [55].
In this context, let $\mathcal{P}$ denote a collection of data elements (e.g., pixels), and $\mathcal{N}$ represent a neighborhood system. For each pair of neighboring elements $\{\mathrm{p}, \mathrm{q}\}$ in $\mathcal{P}$, a binary vector $A=\left(A_1, \ldots, A_{\mathrm{p}}, \ldots, A \_|\mathcal{P}|\right)$ is defined, where $A_{\mathrm{p}}$ indicates whether pixel $p$ belongs to the object or the background. This vector $A$ represents the segmentation result. The overall quality of the segmentation is evaluated by a cost function $\mathrm{E}(\mathrm{A})$, which is used to optimize the distinction between the stenotic region and the background.
${Min} \, E(A)=\lambda . R(A)+B(A)$ (1)
where:
$R(A)=\sum_{p \in \mathcal{P}} R_p\left(A_p\right)$ (2)
$B(A)=\sum_{\{\mathrm{p}, \mathrm{q}\} \in \mathcal{N}} B_{\{\mathrm{p}, \mathrm{q}\}} . \delta\left(A_p, A_q\right)$ (3)
And
$\left\{\begin{array}{l}\delta\left(A_p, A_q\right)=1 \,\, { if } \,\, A_p \neq A_q \\ \delta\left(A_p, A_q\right)=0 \,\, { otherwise }\end{array}\right.$ (4)
The coefficient λ ≥ 0 in Eq. (1) specifies the relative importance of the regional property associated with R(A) versus the property associated with B(A). The regional term R(A) assumes that the respective penalties for assigning p pixels to the object and background, corresponding to the given Rp(object) and Rp(background), are. The goal is to compute the global minimum of Eq. (1) among all segmentations.
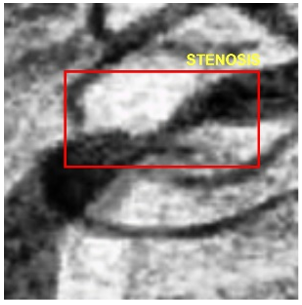
The stenosis cropping process was performed using a square crop method with the Microsoft Paint Tool. The original coronary artery image, with a resolution of 512×512 pixels, was manually cropped in stenosis area to a 100×100-pixel [56], referred to as a stenosis patch. From several cropping trials of the stenosis area, the size of 100x100 pixels was found to be the most appropriate for the model to interpret. The stenosis patch is shown in Figure 3(a) for abnormal stenosis and Figure 3(b) for normal stenosis, where the stenosis is indicated by a red square box in each figure.
(a) Abnormal 100×100 px
(b) Normal 100×100 px
Figure 3. A patch of stenosis with 100×100 px
2.4 The annotation of segmentation
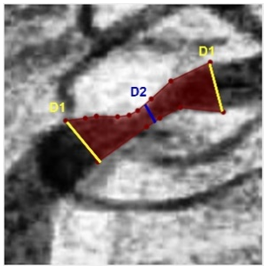
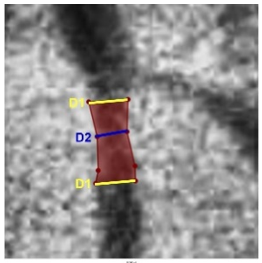
The annotation of the stenosis area was carried out by manually delineating contours around regions of reduced arterial diameter using the LabelMe Tool. This process is illustrated in Figure 4(a) for abnormal stenosis and Figure 4(b) for normal stenosis. The annotated contours correspond to two classification categories based on the degree of arterial narrowing: abnormal stenosis (≥ 50%) and normal stenosis (< 50%). These annotations serve as ground truth masks for training and evaluating the segmentation models.
Following the stenosis contour annotation process, a thresholding technique was applied to the annotated regions to generate binary masks. This process resulted in a white region representing the stenosis area and a black background for all other areas. The outcomes of this binary segmentation are illustrated in Figure 5(a) for abnormal stenosis and Figure 5(b) for normal stenosis. These thresholded masks were subsequently used as ground truth labels for training and validating the segmentation models.
(a) Annotation of abnormal stenosis contours
(b) Annotation of normal stenosis contours
Figure 4. Annotation of stenosis contours
(a) Abnormal stenosis thresholding
(b) Normal stenosis thresholding
Figure 5. Stenosis thresholding results
Table 1. Summary of stenosis dataset after split
|
Classes |
Training |
Testing |
Unseen |
|
Normal |
557 |
142 |
173 |
|
Abnormal |
563 |
135 |
170 |
|
Total |
1120 |
277 |
403 |
After annotating the 1,400 datasets and 403 unseen data samples, the annotated dataset was randomly divided using Python source code, allocating 80% for training and 20% for testing. The training set was used to train the segmentation models, while the testing set served to validate the models' performance during development. In addition, the unseen dataset was employed to assess the models’ ability to generalize to new, previously unencountered stenosis patterns and sizes. During the validation process, three testing samples were found to be undetected by the model and were therefore excluded from the analysis. The complete distribution of the datasets is presented in Table 1.
2.5 The proposed CNN architecture
2.5.1 Residual network (ResNet34)
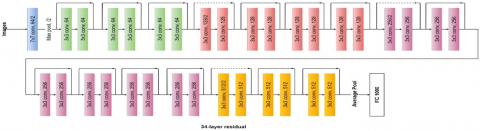
ResNet34 is a convolutional neural network (CNN) architecture designed based on the concept of residual learning, which incorporates residual blocks to facilitate more effective feature extraction. The primary purpose of using residual blocks is to address the vanishing gradient problem [57], thereby improving training efficiency and overall model accuracy [58]. As illustrated in Figure 6, the proposed ResNet34 architecture follows the original residual network design, where skip connections (also known as identity shortcuts) are introduced between convolutional layers [58, 59]. These connections enable the network to learn residual functions with reference to the input layer, rather than learning unreferenced functions directly. The ResNet34 model consists of 34 convolutional layers organized in residual blocks, making it well-suited for deep feature learning tasks such as stenosis segmentation in coronary artery images.
2.5.2 UNet
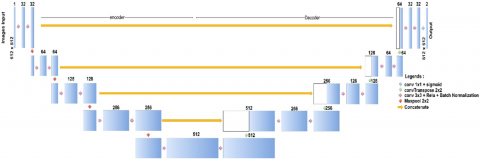
UNet is a convolutional neural network architecture designed primarily for semantic segmentation tasks, particularly in biomedical image analysis. It is characterized by a symmetric structure consisting of an encoder (contracting path) on the left, a decoder (expanding path) on the right, and a bridge that connects the two. The encoder is composed of four computational blocks, each followed by a max pooling layer, which progressively reduces the spatial dimensions while increasing the feature depth. The decoder mirrors this structure, using four transposed convolutions (ConvTranspose) to upsample the feature maps, and includes four skip connections that concatenate feature maps from the encoder to preserve spatial information. Each convolutional layer in the network is followed by a Rectified Linear Unit (ReLU) activation function and Batch Normalization to enhance convergence and stability during training. In the final layer, a 1×1 convolution is applied to map the resulting 64-component feature vectors to the desired output segmentation map. Overall, the UNet architecture comprises 23 convolutional layers, as illustrated in Figure 7 [60].
2.5.3 Residual UNet
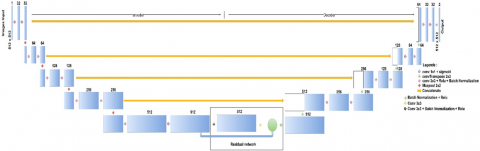
Residual UNet is an enhanced variant of the original UNet architecture that incorporates elements of residual learning to improve segmentation performance and training efficiency. The key modification lies in the integration of a residual block, based on the basic block of the residual network (ResNet), within the bridge section that connects the encoder and decoder paths. Specifically, this residual block is inserted after the 512-channel convolutional operations, allowing the network to retain deep features while addressing potential issues such as vanishing gradients and degradation in deep networks. This architectural enhancement increases the total number of convolutional layers from 23 (in the original UNet) to 25 convolutional layers in Residual UNet, as illustrated in Figure 8 [61]. By leveraging residual connections, the model benefits from improved feature propagation and better convergence behavior during training, making it more robust in handling complex segmentation tasks such as coronary artery stenosis localization.
Figure 6. Proposed ResNet34 architecture [59]
Figure 7. The proposed UNet architecture [60]
Figure 8. The proposed residual UNet architecture [61]
2.6 Evaluation metrics
This subsection aims to evaluate the results of each model using the evaluation metrics of accuracy, IoU, precision, recall, and F1-score to compare the performance of each model evaluating on the same dataset. The Eqs. (5) to (9) are to calculate these evaluation metrics [13, 29].
$Accuracy=\frac{T P+T N}{T P+T N+F N+F P}$ (5)
$I o U=\frac{T P}{T P+F N+F P}$ (6)
$Precision=\frac{T P}{T P+F P}$ (7)
$Recall=\frac{T P}{T P+F N}$ (8)
$F_1 \, score =\frac{2 \times T P}{2 \times+F P+F N}$ (9)
where,
TP= True Positive; TN = True Negative; FP = False Positive; FN = False Negative.
3.1 Results
Initial experiments were conducted on one model using randomly selected hyperparameter settings, including batch size, learning rate, and number of epochs. The best performance was observed with a batch size of 64, a learning rate of 10-4, and 300 training epochs. These optimal settings were then applied to the other models for consistency. The results showed that all three models achieved promising performance metrics. Accuracy scores were particularly high, while the other four metrics—IoU, precision, recall, and F1-score—also demonstrated strong performance. Importantly, no 'Not a Number' (NaN) values were encountered, indicating the validity of all metric scores. A summary of these results is presented in Table 2.
Table 2. Summary of performance metrics of three segmentation models
|
Models |
Performance Metrics (%) |
||||
|
Acc. |
IoU |
Prec. |
Rec. |
F1 |
|
|
Resnet34 |
99.14 |
87.47 |
85.50 |
87.24 |
85.88 |
|
UNet |
99.14 |
87.45 |
83.33 |
88.58 |
85.83 |
|
Residual UNet |
99.22 |
88.25 |
87.82 |
86.89 |
86.78 |
Notes: Acc: accuracy, IoU: intersection over union, Prec.: precision, Rec.: Recall, F1: F1-score
The three models achieved the following performance scores: Accuracy: ResNet34 and UNet both achieved 99.14%, while Residual UNet slightly outperformed them with 99.22%. IoU: Residual UNet achieved the highest IoU at 88.25%, followed by ResNet34 at 87.47%, and UNet at 87.45%. Precision: Residual UNet again led with 87.82%, compared to 85.50% for ResNet34 and 83.33% for UNet. Recall: UNet achieved the highest recall at 88.58%, followed by ResNet34 at 87.24%, and Residual UNet at 86.89%. F1-score: Residual UNet obtained the highest F1-score of 86.78%, closely followed by ResNet34 at 85.88% and UNet at 85.83%. These results highlight Residual UNet’s overall superior performance, particularly in accuracy, precision, IoU, and F1-score.
It is noteworthy that the precision and recall scores across the three models do not differ significantly. Residual UNet exhibits nearly identical precision and recall values, suggesting a balance between false positives and false negatives, with true positives being the dominant prediction outcome. In contrast, UNet shows a higher recall than precision, indicating a higher number of false positive predictions compared to false negatives.
In the experiment, none of the three models produced Not a Number (NaN) values, indicating that all metric scores are valid. Among the evaluated performance metrics, Residual UNet achieved the highest scores in four key metrics: accuracy, Intersection over Union (IoU), precision, and F1-score. Meanwhile, UNet obtained the highest recall. Based on these results, Residual UNet demonstrates superior overall performance compared to the other models.
For the unseen data experiments, the performance results of the models are presented in Table 3. The accuracy scores were 98.80%, 98.76%, and 98.89% for ResNet34, UNet, and Residual UNet, respectively. IoU scores were 83.15% for ResNet34, 81.97% for UNet, and 83.73% for Residual UNet. In terms of precision, ResNet34 achieved 78.45%, UNet 80.37%, and Residual UNet 81.33%. The recall scores were 83.32% for ResNet34, 77.72% for UNet, and 81.90% for Residual UNet. Finally, the F1-scores were 79.87%, 77.39%, and 80.50% for ResNet34, UNet, and Residual UNet, respectively.
Notably, only Residual UNet achieved scores above 80% across all performance metrics, indicating strong generalization to unseen data. In contrast, ResNet34 and UNet exhibited more variation in metric scores. Based on these results, Residual UNet demonstrates superior overall performance, particularly in accuracy, IoU, precision, and F1-score.
Table 3. Summary of the performance of three segmentation models for unseen data
|
Models |
Performance Metrics (%) |
||||
|
Acc. |
IoU |
Prec. |
Rec. |
F1 |
|
|
Resnet34 |
98.80 |
83.15 |
78.45 |
83.32 |
79.87 |
|
UNet |
98.76 |
81.97 |
80.37 |
77.72 |
77.39 |
|
Residual UNet |
98.89 |
83.73 |
81.33 |
81.90 |
80.50 |
Acc.: accuracy, IoU: intersection over union, Prec.: precision, Rec.: Recall, F1: F1-score
In addition to the quantitative performance metrics used to evaluate model effectiveness, graphs of training and testing accuracy, as well as training and testing loss, were presented. These visualizations provide insight into the learning dynamics and generalization capabilities of each model throughout the training process, further substantiating the performance claims and demonstrating the robustness of the proposed architectures.
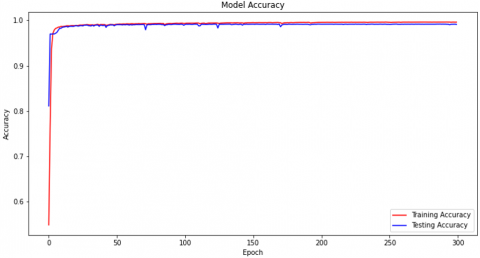
The train and test accuracy graphs generated by the ResNet34 model are shown in Figure 9. At the initial point (epoch 0), the train accuracy graph increases sharply directly past the value of 0.95, then gradually continues to increase until it approaches the accuracy value of 0.9914 at the 50th epoch. After that, the train accuracy graph tends to be stable from the 50th to the 300th epoch, maintaining an accuracy score above 0.9914. Meanwhile, the test accuracy graph starts from a value close to 0.85, then experiences a sharp spike with small fluctuations until it reaches a score of 0.9914 at around the 50th epoch. The test accuracy graph then shows stability with very small fluctuations and remains consistent until the 300th epoch, maintaining an accuracy value at 0.9914. Visually, the difference between the train and test accuracy graphs is very small, indicating that the model does not experience overfitting and is able to generalize well to the test data.
The train loss and test loss graphs for the ResNet34 model are shown in Figure 10. Both the train and test loss graphs start at values above 0.9. As the number of epochs increases, both graphs show a consistent decrease, indicating that the model has successfully minimized the error during the training process. Stability begins to appear around the 50th epoch, where the loss values on the train and test graphs tend to converge. The train loss graph remains stable until the 300th epoch, while the test loss graph also shows a stable trend, although there are some slight fluctuations. Overall, the pattern of loss decreases and stabilization indicates that the ResNet34 model has successfully learned effectively from the training data and is able to maintain good performance on the test data without showing any significant indication of overfitting.
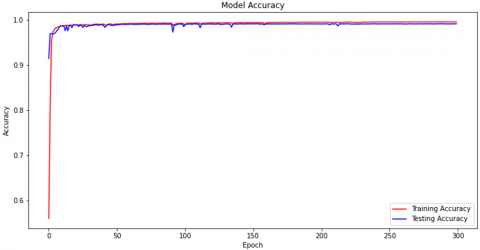
The training and testing accuracy graphs for the UNet model are shown in Figure 11. At the initial epoch (epoch 0), the training accuracy graph starts at around 0.5, while the testing accuracy graph starts at around 0.8. Both graphs then experience a sharp increase, where the training accuracy exceeds a score of 0.9914 and the testing accuracy reaches the same value, namely 0.9914. After reaching that point, both graphs show stability from around the 10th epoch to the 300th epoch. The difference between the training and testing accuracy graphs at the 300th epoch is very small, indicating that the model does not experience overfitting and is able to generalize well to previously unseen test data.
Figure 9. Train and test accuracy graph for ResNet34
Figure 10. Train and test loss graph for ResNet34
Figure 11. Training and testing accuracy graph for UNet
Figure 12. Training and testing loss graphs for UNet
Figure 13. Training and testing accuracy graphs for residual UNet
Figure 14. UNet training and testing residual loss graphs
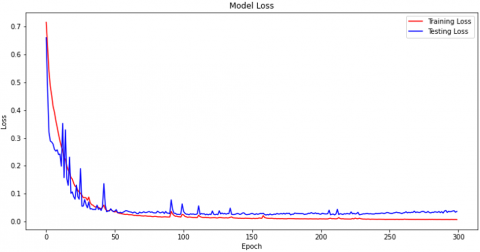
The training and testing loss graphs for the UNet model are shown in Figure 12. The training loss graph starts from a value slightly above 0.7, while the testing loss graph starts from a value slightly below 0.7. As the number of epochs increases, both graphs show a gradual decrease. The training loss graph decreases consistently until around the 50th epoch and reaches a value range between 0.0 and 0.1, then remains stable until the 300th epoch. Meanwhile, the testing loss graph also experiences a gradual decrease until reaching a value range between 0.0 and 0.1 at the 50th epoch. However, there is a short spike that occurs around the 70th epoch. After the spike, the graph stabilizes again and maintains a low and consistent loss value until the 300th epoch. Overall, the pattern of the decrease and stabilization of the loss graphs in the UNet model indicates that the model is able to learn effectively and maintain good performance on the test data, with only minor fluctuations that are not significant to the overall performance.
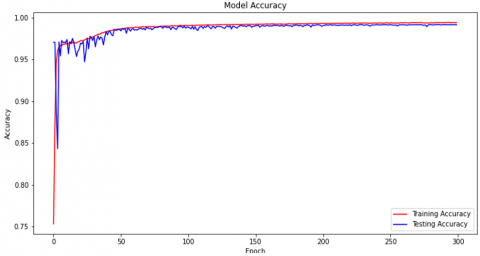
The training and testing accuracy graphs for the Residual UNet model are shown in Figure 13. At the beginning of training (epoch 0), the training accuracy graph starts at a range of between 0.5 and 0.6, then increases sharply to approach a value above 0.9922. Meanwhile, the testing accuracy graph starts at around 0.9 and also shows an increase until it reaches a score of around 0.9922. Both graphs then show very good stability until the 300th epoch, where the training accuracy graph remains slightly above 0.9922 and the testing accuracy graph remains at 0.9922. Visually, the difference between the training and testing accuracy graphs at the 300th epoch is very small, indicating that the model does not experience overfitting. This also shows that Residual UNet is able to learn the shape and size of stenosis features well, including on data that has never been seen before.
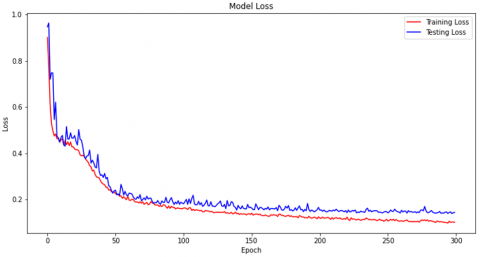
The performance of the training and testing loss graphs for the Residual UNet model is shown in Figure 14. The training loss graph starts from a value of around 0.7 and gradually decreases until it reaches a range between 0.0 and 0.1 at around the 50th epoch. After that, the training loss graph remains stable and maintains that value until the end of training at the 300th epoch. Meanwhile, the testing loss graph also starts from a value close to 0.7 and shows a gradual decrease until it reaches a range between 0.0 and 0.1. Although there is a slight fluctuation during epochs 0 to 50, the testing loss graph then stabilizes and maintains that value until the 300th epoch. The difference between the training and testing loss graphs at the 300th epoch is very small, with a range of around 0.01. This indicates that the Residual UNet model has very good generalization capabilities and does not show any indication of overfitting and is able to maintain consistent performance on both training and testing data.
3.2 Discussion
To contextualize and differentiate the performance achievements of the proposed models, this study includes a comparative analysis with previous research, as presented in Table 4. AlOthman et al. [62] focused on coronary artery visualization and feature extraction using convolutional neural networks (CNNs) for coronary artery disease (CAD) detection. Their model achieved precision and recall scores of 92% and 96%, respectively. However, their study did not report accuracy, Intersection over Union (IoU), or F1-score.
In another study, Gao et al. [63] employed an ensemble approach for coronary artery segmentation in X-ray coronary angiography, utilizing filter-based features with Gradient Boosted Decision Trees (GBDT) and Deep Forest classifiers. The GBDT model achieved an average F1-score of 87.4%, an area under the receiver operating characteristic curve (AUROC) of 94.7%, sensitivity of 90.2%, and specificity of 99.2%. The Deep Forest model reported an F1-score of 86.7%, AUROC of 95.0%, sensitivity of 86.7%, and specificity of 99.3%. Notably, this study did not provide accuracy, IoU, or precision metrics.
Table 4. Comparison of stenosis studies with other studies
|
Authors |
Study Methods and Models |
Performance Results (%) |
|
AlOthman et al. [62] |
Visualizing coronary arteries and extracting features with high spatial resolution using CNN for CAD detection. |
precision and recall are 92% and 96%, respectively. |
|
Gao et al. [63] |
Performing ensemble coronary artery with filter-based features for segmentation, which is fed to GBDT and deep forest classifier |
F1-score 87.4%, AUROC 94.7%, sensitivity 90.2%, and specificity 99.2% for GBDT, F1 score 86.7%, AUROC 95%, sensitivity 86.7%, and specificity 99.3% for deep forest classifier. |
|
Eschen et al. [64] |
Performing coronary artery cine loop for right/left artery classification, which is fed to 3D CNN. |
ROC-AUC 90.3% |
|
Wang et al. [65] |
visualizing coronary artery through an online interface and localizing and classifying stenosis by system using a CNN. |
accuracy 88.9%, recall 85.4%, mAP 87.5%, dan F1-score 87.1%. |
|
Abedin et al. [66] |
Full coronary artery segmentation using U-Net, with DenseNet121 (pretrained weights) as the encoder and a Self-Organizing Neural Network as the decoder |
Accuracy 98.96%, IoU 82.52%, precision 90.10%, sensitivity 90.64%, and F1-score 90.35% |
|
Our approach |
Cropping in stenosis areas, which is fed to ResNet34, UNet, and Residual UNet. |
Residual UNet excels with accuracy 99.22%, IoU 88.25%, precision 87.82%, recall 86.89%, and F1-score 86.78%. |
Eschen et al. [64] developed a method for classifying right or left coronary arteries—or other categories—using coronary artery cine loops with manual annotation. Their model achieved a receiver operating characteristic–area under the curve (ROC-AUC) of 90.3%. However, the study did not report other commonly used performance metrics such as accuracy, Intersection over Union (IoU), precision, recall, or F1-score.
Wang et al. [65] investigated the integration of stenosis localization and classification on coronary angiography images using a web-based system that relies on angiographic image assessment. A total of 1,606 angiography images were tested using a CNN, which achieved an accuracy of 88.9%, a recall of 85.4%, a mean Average Precision (mAP) of 87.5%, and an F1-score of 87.1%.
Abedin et al. [66] investigated full segmentation of coronary arteries using UNet by implementing DenseNet121 with pretrained weights as the encoder and a self-organizing neural network (Self-ONN) as the decoder to replace conventional convolution. The results achieved were an accuracy of 98.96%, IoU of 82.45%, precision of 90.10%, sensitivity of 90.64%, and an F1-score of 90.35%.
In contrast, our study focuses on improving model performance for stenosis detection and coronary artery disease (CAD) identification through multiple experimental models. We evaluated three models—ResNet34, UNet, and Residual UNet—on their ability to detect coronary artery stenosis. Each stenosis region was cropped as a 100×100 pixel patch, annotated, and used for training and testing the models.
All three models demonstrated strong performance, with Residual UNet emerging as the best-performing model. The presence of skip connections between the encoder and decoder enables the model to overcome the vanishing gradient problem, thereby helping to prevent overfitting. Residual UNet achieved 99.22% accuracy, 88.25% IoU, 87.82% precision, 86.89% recall, and 86.78% F1-score. Although ResNet is also equipped with skip connections, its performance did not surpass that of Residual UNet. ResNet matched UNet in terms of accuracy but fell short on the other performance metrics. Unlike previous studies that did not report accuracy or IoU values, our approach successfully achieved very high accuracy and consistently strong performance across all metrics—on both test data and unseen data. These findings highlight the effectiveness and generalizability of the proposed segmentation strategy in detecting stenosis.
This study presented the evaluation of three binary segmentation models on a cropped coronary artery stenosis dataset and identified the most effective model for detecting and segmenting stenosis. Among the models tested, the Residual UNet outperformed the others, achieving the highest performance on validation data with an accuracy of 99.22%, IoU of 88.25%, precision of 87.82%, recall of 86.89%, and F1-score of 86.78%. It also demonstrated the ability of generalization on unseen data, achieving an accuracy of 98.89%, IoU of 83.73%, precision of 81.33%, recall of 81.90%, and F1-score of 80.50%. While these results were promising, further improvements are necessary, particularly in addressing multiclass segmentation with imbalanced datasets and expanding the model to support object detection and classification. Enhancing the model in these directions will enable a more comprehensive stenosis analysis system that can identify, segment, and classify different types of lesions. Ultimately, this research contributes to advancing diagnostic support tools, especially in resource-limited settings where access to cardiologists or advanced medical infrastructure is limited. The proposed model holds strong potential for integration into hospital computer software systems to support early diagnosis, reduce mortality, and improve patient care.
This study still has limitations regarding the amount of data, the sources of the data, and potential bias in the cropping process. Future work will involve a more in-depth investigation into detecting complex and diverse stenosis patterns across various hospital datasets, in order to develop a more robust and generalizable model, despite the challenges in acquiring such data.
We would like to thank all our colleagues and members of the Intelligent System Research Group (ISysRG), Faculty of Computer Science, Universitas Sriwijaya. We also sincerely appreciate Dr. Alpian, Sp.PD-KKV, for granting permission to use his patient video data.
[1] Alkhairi, P., Windarto, A.P. (2023). Classification analysis of back propagation-optimized CNN performance in image processing. Journal of Systems Engineering and Information Technology, 2(1): 8-15. https://doi.org/10.29207/joseit.v2i1.5015
[2] Windarto, A.P., Herawan, T., Alkhairi, P. (2024). Early detection of breast cancer based on patient symptom data using naive bayes algorithm on genomic data. In Artificial Intelligence, Data Science and Applications. ICAISE 2023. Lecture Notes in Networks and Systems, vol 837. Springer, Cham. https://doi.org/10.1007/978-3-031-48465-0_64
[3] Windarto, A.P., Herawan, T., Alkhairi, P. (2024). Prediction of kidney disease progression using K-means algorithm approach on histopathology data. In Artificial Intelligence, Data Science and Applications. ICAISE 2023. Lecture Notes in Networks and Systems, vol 837. Springer, Cham. https://doi.org/10.1007/978-3-031-48465-0_66
[4] Akkus, Z., Cai, J., Boonrod, A., Zeinoddini, A., Weston, A.D., Philbrick, K.A., Erickson, B.J. (2019). A survey of deep-learning applications in ultrasound: Artificial intelligence–powered ultrasound for improving clinical workflow. Journal of the American College of Radiology, 16(9): 1318-1328. https://doi.org/10.1016/j.jacr.2019.06.004
[5] Abdel-Kader, M.Y., Ebid, A.M., Onyelowe, K.C., Mahdi, I.M., Abdel-Rasheed, I. (2022). in infrastructure projects—Gap study. Infrastructures, 7(10): 137. https://doi.org/10.3390/infrastructures7100137
[6] Medaglia, R., Gil-Garcia, J.R., Pardo, T.A. (2023). Artificial intelligence in government: Taking stock and moving forward. Social Science Computer Review, 41(1): 123-140. https://doi.org/10.1177/08944393211034087
[7] Liu, X., Ghazali, K.H., Shah, A.A. (2022). Sustainable oil palm resource assessment based on an enhanced deep learning method. Energies, 15(12): 4479. https://doi.org/10.3390/en15124479
[8] Wen, Z., Huang, H. (2022). The potential for artificial intelligence in healthcare. Journal of Commercial Biotechnology, 27(4): 217-224. https://doi.org/10.5912/jcb1327
[9] Hassan, A.M., Nelson, J.A., Coert, J.H., Mehrara, B.J., Selber, J.C. (2023). Exploring the potential of artificial intelligence in surgery: Insights from a conversation with ChatGPT. Annals of Surgical Oncology, 30(7): 3875-3878. https://doi.org/10.1245/s10434-023-13347-0
[10] Qin, F., Gu, J. (2023). Artificial intelligence in plastic surgery: Current developments and future perspectives. Plastic and Aesthetic Research, 10(1). https://doi.org/10.20517/2347-9264.2022.72
[11] Oh, S., Kim, J.H., Choi, S.W., Lee, H.J., Hong, J., Kwon, S.H. (2019). Physician confidence in artificial intelligence: An online mobile survey. Journal of Medical Internet Research, 21(3): e12422. https://doi.org/10.2196/12422
[12] Liu, P.R., Lu, L., Zhang, J.Y., Huo, T.T., Liu, S.X., Ye, Z.W. (2021). Application of artificial intelligence in medicine: An overview. Current Medical Science, 41(6): 1105-1115. https://doi.org/10.1007/s11596-021-2474-3
[13] Supani, A., Andriani, Y., Oktavianti, E. (2023). The tuning of machine learning models for the classification of cardiovascular disease. In 2023 6th International Conference of Computer and Informatics Engineering (IC2IE), Lombok, Indonesia, pp. 381-384. https://doi.org/10.1109/IC2IE60547.2023.10331436
[14] Kong, B., Wang, X., Bai, J., Lu, Y., Gao, F., Cao, K., Xia, J., Song, Q., Yin, Y. (2020). Learning tree-structured representation for 3D coronary artery segmentation. Computerized Medical Imaging and Graphics, 80: 101688. https://doi.org/10.1016/j.compmedimag.2019.101688
[15] Shahid, A.H., Singh, M.P., Roy, B., Aadarsh, A. (2020). Coronary artery disease diagnosis using feature selection based hybrid extreme learning machine. In 2020 3rd International Conference on Information and Computer Technologies (ICICT), San Jose, CA, USA, pp. 341-346. https://doi.org/10.1109/ICICT50521.2020.00060
[16] Zreik, M., Van Hamersvelt, R.W., Wolterink, J.M., Leiner, T., Viergever, M.A., Išgum, I. (2018). A recurrent CNN for automatic detection and classification of coronary artery plaque and stenosis in coronary CT angiography. IEEE Transactions on Medical Imaging, 38(7): 1588-1598. https://doi.org/10.1109/TMI.2018.2883807
[17] Samanta, P., Pathak, A., Mandana, K., Saha, G. (2019). Classification of coronary artery diseased and normal subjects using multi-channel phonocardiogram signal. Biocybernetics and Biomedical Engineering, 39(2): 426-443. https://doi.org/10.1016/j.bbe.2019.02.003
[18] Hurskainen, M., Tynkkynen, J., Eskola, M., Hernesniemi, J. (2022). Incidence of stroke and mortality due to stroke after acute coronary syndrome. Journal of Stroke and Cerebrovascular Diseases, 31(12): 106842. https://doi.org/10.1016/j.jstrokecerebrovasdis.2022.106842
[19] Zhao, C., Tang, H., McGonigle, D., He, Z., et al. (2022). Development of an approach to extracting coronary arteries and detecting stenosis in invasive coronary angiograms. Journal of Medical Imaging, 9(4): 044002-044002.
[20] Muneeb, M., Nuzhat, N., Niazi, A.K., Khan, A.H., Chatha, Z., Kazmi, T., Farhat, S. (2023). Assessment of the dimensions of coronary arteries for the manifestation of coronary artery disease. Cureus, 15(10): e46606. https://doi.org/10.7759/cureus.46606
[21] Pathak, A., Samanta, P., Mandana, K., Saha, G. (2020). Detection of coronary artery atherosclerotic disease using novel features from synchrosqueezing transform of phonocardiogram. Biomedical Signal Processing and Control, 62: 102055. https://doi.org/10.1016/j.bspc.2020.102055
[22] Rodrigues, D.L., Menezes, M.N., Pinto, F.J., Oliveira, A.L. (2021). Automated detection of coronary artery stenosis in X-ray angiography using deep neural networks. arXiv preprint arXiv:2103.02969. https://doi.org/10.48550/arXiv.2103.02969
[23] Abdar, M., Książek, W., Acharya, U.R., Tan, R.S., Makarenkov, V., Pławiak, P. (2019). A new machine learning technique for an accurate diagnosis of coronary artery disease. Computer Methods and Programs in Biomedicine, 179: 104992. https://doi.org/10.1016/j.cmpb.2019.104992
[24] Joloudari, J.H., Hassannataj Joloudari, E., Saadatfar, H., Ghasemigol, M., Razavi, S.M., Mosavi, A., Nabipour, N., Shamshirband, S., Nadai, L. (2020). Coronary artery disease diagnosis; ranking the significant features using a random trees model. International Journal of Environmental Research and Public Health, 17(3): 731. https://doi.org/10.3390/ijerph17030731
[25] Kwakye, K., Dadzie, E. (2021). Machine learning-based classification algorithms for the prediction of coronary heart diseases. arXiv preprint arXiv:2112.01503. https://doi.org/10.48550/arXiv.2112.01503
[26] Zhang, S., Yuan, Y., Yao, Z., Wang, X., Lei, Z. (2022). Improvement of the performance of models for predicting coronary artery disease based on XGBoost algorithm and feature processing technology. Electronics, 11(3): 315. https://doi.org/10.3390/electronics11030315
[27] Sayadi, M., Varadarajan, V., Sadoughi, F., Chopannejad, S., Langarizadeh, M. (2022). A machine learning model for detection of coronary artery disease using noninvasive clinical parameters. Life, 12(11): 1933. https://doi.org/10.3390/life12111933
[28] Gupta, C., Saha, A., Reddy, N.S., Acharya, U.D. (2022). Cardiac disease prediction using supervised machine learning techniques. Journal of Physics: Conference Series, 2161(1): 012013. https://doi.org/10.1088/1742-6596/2161/1/012013
[29] Supani, A., Nurmaini, S., Partan, R.U., Suprapto, B.Y. (2024). The classification of coronary artery disease using a machine learning approach: A preliminary study. In Proceedings of the 7th FIRST 2023 International Conference on Global Innovations (FIRST-ESCSI 2023), 232: 4.
[30] Ovalle-Magallanes, E., Avina-Cervantes, J.G., Cruz-Aceves, I., Ruiz-Pinales, J. (2020). Transfer learning for stenosis detection in X-ray coronary angiography. Mathematics, 8(9): 1510. https://doi.org/10.3390/math8091510
[31] Zreik, M., Hampe, N., Leiner, T., Khalili, N., et al. (2021). Combined analysis of coronary arteries and the left ventricular myocardium in cardiac CT angiography for detection of patients with functionally significant stenosis. Medical Imaging 2021: Image Processing, 11596: 394-401. https://doi.org/10.1117/12.2580847
[32] Akella, A., Akella, S. (2021). Machine learning algorithms for predicting coronary artery disease: Efforts toward an open source solution. Future science OA, 7(6): FSO698. https://doi.org/10.2144/fsoa-2020-0206
[33] Barbierato, E., Gatti, A. (2024). The challenges of machine learning: A critical review. Electronics, 13(2): 416. https://doi.org/10.3390/electronics13020416
[34] Gracia Moisés, A., Vitoria Pascual, I., Imas González, J.J., Ruiz Zamarreño, C. (2023). Data augmentation techniques for machine learning applied to optical spectroscopy datasets in agrifood applications: A comprehensive review. Sensors, 23(20): 8562. https://doi.org/10.3390/s23208562
[35] Litjens, G., Kooi, T., Bejnordi, B.E., Setio, A.A.A., Ciompi, F., Ghafoorian, M., van der Laak, J.A.W.M., van Ginneken, B., Sánchez, C.I. (2017). A survey on deep learning in medical image analysis. Medical Image Analysis, 42: 60-88. https://doi.org/10.1016/j.media.2017.07.005
[36] Simon, S., Kolyada, N., Akiki, C., Potthast, M., Stein, B., Siegmund, N. (2023). Exploring hyperparameter usage and tuning in machine learning research. Papers on Tuning, 50(75): 100.
[37] Ilemobayo, J., Durodola, O., Alade, O., Awotunde, O.J., Olanrewaju, A. T., Falana, O., Ogungbire, A., Osinuga, A., Ogunbiyi, D., Ifeanyi, A., Odezuligbo, I.E., Edu, O.E. (2024). Hyperparameter tuning in machine learning: A comprehensive review. Journal of Engineering Research and Reports, 26(6): 388-395. https://doi.org/10.9734/jerr/2024/v26i61188
[38] Elgeldawi, E., Sayed, A., Galal, A.R., Zaki, A.M. (2021). Hyperparameter tuning for machine learning algorithms used for Arabic sentiment analysis. Informatics, 8(4): 79. https://doi.org/10.3390/informatics8040079
[39] Zhou, H., Yu, X., Alhaskawi, A., Dong, Y., et al. (2022). A deep learning approach for medical waste classification. Scientific Reports, 12(1): 2159. https://doi.org/10.1038/s41598-022-06146-2
[40] Chen, Y., Lin, Y., Wang, C., Lee, C., Lee, W., Chen, C. (2019). Coronary artery segmentation in cardiac CT angiography using 3D multi-channel U-net. arxiv.org/abs/1907.12246. https://doi.org/10.48550/arXiv.1907.12246
[41] Gharleghi, R., Adikari, D., Ellenberger, K., Ooi, S.Y., et al. (2022). Automated segmentation of normal and diseased coronary arteries–the ASOCA challenge. Computerized Medical Imaging and Graphics, 97: 102049. https://doi.org/10.1016/j.compmedimag.2022.102049
[42] Wang, Q., Xu, L., Wang, L., Yang, X., Sun, Y., Yang, B., Greenwald, S.E. (2023). Automatic coronary artery segmentation of CCTA images using UNet with a local contextual transformer. Frontiers in Physiology, 14: 1138257. https://doi.org/10.3389/fphys.2023.1138257
[43] Lalinia, M., Sahafi, A. (2024). Coronary vessel segmentation in x-ray angiography images using edge-based tracking method. Sensing and Imaging, 25(1): 32. https://doi.org/10.1007/s11220-024-00481-6
[44] Wu, W., Zhang, J., Xie, H., Zhao, Y., Zhang, S., Gu, L. (2020). Automatic detection of coronary artery stenosis by convolutional neural network with temporal constraint. Computers in Biology and Medicine, 118: 103657. https://doi.org/10.1016/j.compbiomed.2020.103657
[45] Moon, J.H., Cha, W.C., Chung, M.J., Lee, K.S., Cho, B.H., Choi, J.H. (2021). Automatic stenosis recognition from coronary angiography using convolutional neural networks. Computer Methods and Programs in Biomedicine, 198: 105819. https://doi.org/10.1016/j.cmpb.2020.105819
[46] Au, B., Shaham, U., Dhruva, S., Bouras, G., Cristea, E., MD, A.L., Coppi, A., Warner, F., Li, S.X., Krumholz, H. (2018). Automated characterization of stenosis in invasive coronary angiography images with convolutional neural networks. arXiv preprint arXiv:1807.10597. https://doi.org/10.48550/arXiv.1807.10597
[47] Chen, M., Wang, S., Liang, K., Chen, X., Xu, Z., Zhao, C., Yuan, W., Wan, J., Huang, Q. (2025). Intraoperative stenosis detection in X-ray coronary angiography via temporal fusion and attention-based CNN. Computerized Medical Imaging and Graphics, 122: 102513. https://doi.org/10.1016/j.compmedimag.2025.102513
[48] Li, Y., Yoshimura, T., Horima, Y., Sugimori, H. (2024). A preprocessing method for coronary artery stenosis detection based on deep learning. Algorithms, 17(3): 119. https://doi.org/10.3390/a17030119
[49] Mishra, B.K., Thakker, D., Mazumdar, S., Neagu, D., Gheorghe, M., Simpson, S. (2020). A novel application of deep learning with image cropping: A smart city use case for flood monitoring. Journal of Reliable Intelligent Environments, 6(1): 51-61. https://doi.org/10.1007/s40860-020-00099-x
[50] Wang, S., Sun, G., Zheng, B., Du, Y. (2021). A crop image segmentation and extraction algorithm based on mask RCNN. Entropy, 23(9): 1160. https://doi.org/10.3390/e23091160
[51] Widianti, L.W., Sudiro, S.A., Madenda, S., Harlan, J. (2020). Cropping method on grayscale images for periapical radiographs of human teeth. IOP Conference Series: Materials Science and Engineering, 879(1): 012114. https://doi.org/10.1088/1757-899X/879/1/012114
[52] Ennab, M., Mcheick, H. (2025). Advancing AI interpretability in medical imaging: A comparative analysis of pixel-level interpretability and Grad-CAM models. Machine Learning and Knowledge Extraction, 7(1): 12. https://doi.org/10.3390/make7010012
[53] Wang, B., Si, H., Fu, H., Gao, R., Zhan, M., Jiang, H., Wang, A. (2023). Content-aware image resizing technology based on composition detection and composition rules. Electronics, 12(14): 3096. https://doi.org/10.3390/electronics12143096
[54] Dickman, E., Diefenbach, P. (2024). Directorial editing: A hybrid deep-learning approach to content-aware image retargeting and resizing. Electronics, 13(22): 4459. https://doi.org/10.3390/electronics13224459
[55] Kakaei, S. (2021). Automatic image cropping and semantic object selection. Journal of Applied Intelligent Systems and Information Sciences, 2(2): 22-32. https://doi.org/10.22034/jaisis.2021.307161.1035
[56] Pravitasari, A.A., Iriawan, N., Almuhayar, M., Azmi, T., Irhamah, I., Fithriasari, K., Purnami, S.W., Ferriastuti, W. (2020). UNet-VGG16 with transfer learning for MRI-based brain tumor segmentation. TELKOMNIKA (Telecommunication Computing Electronics and Control), 18(3): 1310-1318. http://doi.org/10.12928/telkomnika.v18i3.14753
[57] Sun, J., Yang, S., Gao, X., Ou, D., Tian, Z., Wu, J., Wang, M. (2023). Masa-segnet: A semantic segmentation network for polsar images. Remote Sensing, 15(14): 3662. https://doi.org/10.3390/rs15143662
[58] Hasanah, S.A., Pravitasari, A.A., Abdullah, A.S., Yulita, I.N., Asnawi, M.H. (2023). A deep learning review of resnet architecture for lung disease Identification in CXR Image. Applied Sciences, 13(24): 13111. https://doi.org/10.3390/app132413111
[59] Supani, A., Andriani, Y., Saputra, H., Joni, A.B., Alfian, D., Taqwa, A. (2023). Enhancing deeper layers with residual network on CNN architecture: A review. In 6th FIRST 2022 International Conference (FIRST-ESCSI-22), Atlantis Press, pp. 449-457. https://doi.org/10.2991/978-94-6463-118-0_46
[60] Nova, R., Nurmaini, S., Partan, R.U., Putra, S.T. (2021). Automated image segmentation for cardiac septal defects based on contour region with convolutional neural networks: A preliminary study. Informatics in Medicine Unlocked, 24: 100601. https://doi.org/10.1016/j.imu.2021.100601
[61] Nechaev, D., Zhizhin, M., Poyda, A., Ghosh, T., Hsu, F.C., Elvidge, C. (2021). Cross-sensor nighttime lights image calibration for DMSP/OLS and SNPP/VIIRS with residual U-net. Remote Sensing, 13(24): 5026. https://doi.org/10.3390/rs13245026
[62] AlOthman, A.F., Sait, A.R.W., Alhussain, T.A. (2022). Detecting coronary artery disease from computed tomography images using a deep learning technique. Diagnostics, 12(9): 2073. https://doi.org/10.3390/diagnostics12092073
[63] Gao, Z., Wang, L., Soroushmehr, R., Wood, A., Gryak, J., Nallamothu, B., Najarian, K. (2022). Vessel segmentation for X-ray coronary angiography using ensemble methods with deep learning and filter-based features. BMC Medical Imaging, 22(1): 10. https://doi.org/10.1186/s12880-022-00734-4
[64] Eschen, C.K., Banasik, K., Dahl, A.B., Chmura, P.J., Bruun-Rasmussen, P., Pedersen, F., Køber, L., Engstrøm, T., Bøttcher, M., Winther, S., Christensen, A.H., Bundgaard, H., Brunak, S. (2025). Automated stenosis estimation of coronary angiographies using end-to-end learning. The International Journal of Cardiovascular Imaging, 41(3): 441-452. https://doi.org/10.1007/s10554-025-03324-x
[65] Wang, T., Su, X., Liang, Y., Luo, X., Hu, X., Xia, T., Ma, X., Zuo, Y., Xia, H., Yang, L. (2024). Integrated deep learning model for automatic detection and classification of stenosis in coronary angiography. Computational Biology and Chemistry, 112: 108184. https://doi.org/10.1016/j.compbiolchem.2024.108184
[66] Abedin, A.J.M., Sarmun, R., Mushtak, A., Ali, M.S.B.M., Hasan, A., Suganthan, P.N., Chowdhury, M.E. (2025). Enhanced coronary artery segmentation and stenosis detection: Leveraging novel deep learning techniques. Biomedical Signal Processing and Control, 109: 108023. https://doi.org/10.1016/j.bspc.2025.108023