Harsh Chitaliya![]() | Deep Jain
| Deep Jain![]() | Satyavrat Tiwari
| Satyavrat Tiwari![]() | Gaurav Singh Khati
| Gaurav Singh Khati![]() | Darshana Sankhe
| Darshana Sankhe![]() | Pratik Kanani
| Pratik Kanani![]() | Mousumi Bhanja*
| Mousumi Bhanja*![]()
© 2025 The authors. This article is published by IIETA and is licensed under the CC BY 4.0 license (http://creativecommons.org/licenses/by/4.0/).
OPEN ACCESS
Tourism is an essential sector of the world's economies, necessitating to have travel planning solutions that are personalised and efficient. This work therefore presents ExplainableTrip, an advanced travel recommendation system utilizing Explainable Artificial Intelligence (XAI) to provide expedient and interpretable trip suggestions. With different user preferences, travel constraints, and comprehensive point-of-interest data, generates highly accurate itineraries, achieving an overall accuracy of 98.49% and an F1-score of 0.97. ExplainableTrip leverages SHAP values (SHapley Additive exPlanations), to explain how factors like travel distance, time constraints, user interests, and Point of Interest (POI) popularity influence final recommendations. This will enable users to understand why a given set of options is being suggested, thus trusting the system. The methodology used in the system is an elaborate study of POI and inputs from the users based on Jaipur, India, alongside advanced algorithms for distance computation, time slots allotment, and route optimization. SHAP analysis forms a core feature, which enables users to receive customized itineraries while understanding the rationale behind them. ExplainableTrip is an enhancement of travel planning with balance between AI-driven efficiency and interpretability, and combines the latest technology with user-centric transparency to meet contemporary travellers' need for personalization and clarity in trip planning.
explainable AI, gradient boosting, personalised itinerary, SHAP, travel recommendation system
In the modern world, the desire to travel and discover the world has grown and gotten easier as technology develops and the globe appears to get smaller. It's been claimed that travel can be a means of embracing the unknown and breaking free from the routine of daily life to reveal one's true self. At times, such travel dreams require proper planning and several other informed decisions than just having an interest to explore. Excitement about trying something new can easily turn into uncertainty. Planning leads to an experience which is more enjoyable and stress-free.
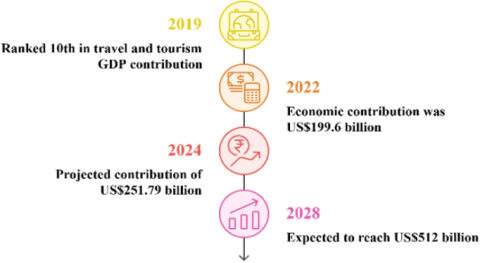
India ranked 10th out of 185 countries in terms of total contribution of travel and tourism to GDP in 2019. In 2022, the economic contribution of the travel and tourism sector to the Indian economy was US\$199.6 billion. WTTC projects that Travel & Tourism will contribute almost US\$251.79 billion to the Indian economy in 2024, an increase of 21% from 2019, and is expected to reach US$512 billion by 2028 [1]. Figure 1 illustrates this economic growth in India's travel and tourism sector across key years.
Figure 1. Travel and tourism economic growth in India
This growth indicates the growing need for travel and tourism in the economy and to have a proper planning and recommendations. The exponential growth of the tourism industry worldwide, coupled with the growing dependence on technology, led to the emergence of artificial intelligence (AI) in travel planning. Faced with many options, a lack of proper expertise, and time constraints, hectic human judgments often occur. Recommendation systems are provided to mitigate such issues. The purpose of travel recommendation systems is to align the needs of the consumers with the features of tourism and leisure resources or attractions [2]. AI has changed the pattern of interacting with big data, enabling personalised travel recommendations based on budget, duration, and interest. However, traditional AI systems suffer from the problem of a "black box," which keeps the decision-making process obscure and complex, and hence cannot explain to the users how or why a particular decision was made. Thus, this lack of transparency has been a great concern and continues to propel demand for more explainable and user-centric AI solutions in travel planning. XAI has been developed to meet the above problems by making AI decisions more transparent and understandable. One of the successful methods used under XAI for feature interpretation in the contribution of single features in predictive models is SHAP (SHapley Additive exPlanations) [3]. It has successfully been applied to health care, finance, and even to automated decision-making systems to raise the confidence level with the users regarding results as interpretable as possible. For example, in the health care area, XAI has been applied to explain the predictions of diagnostic models so that doctors know why particular features, such as patient history or symptoms, resulted in a particular diagnosis [4]. Similarly, XAI has been recently applied within credit scoring models in finance to explain factors determining creditworthiness among loan applicants [5].
In this study, a new itinerary generation system is to be developed, named "ExplainableTrip," which will utilise the principles of XAI with SHAP values for the main purpose of transparent and personalised travel advice for users. Utilising SHAP addresses the problem of transparency with many current tools used in travel planning: how it makes recommendations about specific factors like budget, duration, and user preferences. The contribution of this study includes the introduction of an AI-based system that is able to deliver high accuracy in the creation of itineraries and embed explainability as the core feature itself. It makes it the first of its kind within the domain of travel recommendation systems. It specialises in Jaipur, India, and provides the visitors with tailored itineraries, but also enables them to understand why certain routes and destinations were selected.
The rapid growth that has occurred during recent years in tourism is being supported by technological help, especially within travel recommendation systems. It is thus that such systems are becoming an invaluable aid for the search of travellers who are looking for customised and efficient trip planning solutions in a wide world of tourism based on globalisation, which makes more sophisticated and user centric recommendation systems popular, resulting in innovative approaches combining artificial intelligence techniques along with machine learning techniques [6-8].
However, the classical travel recommendation systems hardly prove useful. They face many problems while providing truly personalised as well as context-aware recommendations. Primarily, they rely on static data and often limited algorithms that may not encompass all of the complexity surrounding travel decisions [9, 10]. Another long-term implication is the transparencies of decision-making processes that have led to user distrust and low adoption [11, 12]. The consequence has been emerging demand for systems of higher dimensions, which are supposed to give accurate recommendations but also provide simple explanations for the recommendations they recommend.
With XAI, new avenues open that attempt to work around such problems. XAI techniques now are taking complex AI models and making them understandable to the human user; they bridge the gap between advanced algorithms and better user comprehension [13, 14]. Among them, SHAP (SHapley Additive exPlanations) presents itself as very promising for receiving insight into what model predictions are coming down the pipe [15, 16]. SHAP values, based on ideas from game theory, offer a unified approach for understanding model outputs and make them particularly suitable for applications in travel recommendation systems [17, 18].
Many recent studies focus on multiple approaches to developing travel recommendation systems. Wang and Wang [8] suggest the integration idea of LLM and POI recommendations, which present, possible ways that could fall under multimodal recommendation, context-aware systems, to explainable AI. Oh and Lee [9] have successfully evaluated and explained tourist satisfaction concerning local festivals based on SHAP importance detection of influencing factors for visitor experiences. Such works serve as evidence of the strong interest in XAI within tourism applications.
Some of the innovative approaches were proposed for the purposes of POI recommendation and route optimization. For example, Ahmad et al. [6] proposed a stochastic approach in terms of Markov chains relating to optimised routes of travel subject to specific constraints of the user and place popularity. Liu et al. [10] proposed an interaction-enhanced and time-aware graph convolutional network, ITGCN, towards successive POI recommendations to nullify the constraints in capturing long-term preferences and dynamic timeliness issues. Zheng et al. [13] designed an MOEA for recommending tourism routes, considering the improvement of the distribution and diversity of Pareto-optimal solutions. Another promising direction is the integration of knowledge graph and sentiment analysis with the aim of enhancing the quality of recommendations. Zeng and Zheng [12] proposed a knowledge graph feature learning for tourism recommendation systems based on semantic information to elevate accuracy. Shao et al. [11] presented a Sentiment-aware Multi-modal Topic Model, SMTM, for personal travel recommendation taking into consideration the user's sentiment and multi-modal data in social media sites.
Table 1 presents the primary XAI methods identified in the tourism recommendation literature review, arranged in order of decreasing frequency of use. SHAP emerges as the dominant method, being referenced extensively across multiple studies, particularly in the context of explainable travel recommendations and user preference modeling.
Table 1. Recent application of XAI methods
|
XAI Method |
Works that Make Use of the Method |
|
SHAP |
[15-22] |
|
Knowledge Graph & Sentiment Analysis |
[10, 23, 24] |
|
Neural Networks & Stochastic Models |
[6, 10, 24, 25] |
|
Advanced AI (LLM & Multi-objective Evolution) |
[3, 8, 13, 25] |
Based on this background, ExplainableTrip is presented as a new solution to the main challenges in travel recommendation systems, as an effort to harness the state of the art in XAI. SHAP values enable users to know what aspects lead the ExplainableTrip recommendations regarding distances to be travelled, time constraints, user interests, and popularity of POIs. Such transparency is important for user trust building and for intelligent decision-making processes. ExplanableTrip approaches distance estimation, time slot allocation, and route finding with deep inspection of user inputs and POI data using complex algorithms. The system, through SHAP analysis, supplies its itineraries explaining the rationale behind the recommendation. This will be in line with the increasing call for more explainable AI systems in all fields-from health to finance and, finally, tourism [26-29].
This new approach not only enhances the all-around experience of travelling but also guides the users towards better decision-making by realising the increasingly modernised and customised needs of contemporary travellers who are in the pursuit of both personalization and transparency concerning their trip planning process [30].
The dataset utilised in this paper has some necessary components that will be required to generate personalised travel recommendations.
3.1 Point of Interest (POI) data
The Jaipur, India POI dataset was harvested from publicly available sources such as Google Places API, OpenStreetMap, and Kaggle tourism datasets. Manual validation was also done by Rajasthan Tourism Department resources. The dataset contains 73 distinct POIs, each defined by name, geographical coordinates (latitude/longitude), category (e.g., historic, cultural, adventure), and operational time slots. Every POI is defined by name, geographical location (latitude and longitude), categories like historic, cultural, adventure, and time slots available for visits. This information helps provide a real insight into the variety of attractions on offer in the city as well as create itineraries more effectively to the choice of the users.
3.2 Distance matrix
A 73×73 distance matrix was calculated based on the Haversine formula, with geolocation coordinates obtained from OpenStreetMap. It records pairwise distances (in km) between all the POIs and is stored in the form of a sparse matrix for computational speed. As a matrix of size 73 by 73, it assists in calculating those geographical relations between points but can also be used to effectively route and optimise the route. Since it forms the basis for recommendations of travel, it can highlight the deduction in travel time but still ensures maximally visited sites.
3.3 User preference data
The user preferences are accumulated through input forms that capture a variety of travel-related choices. These include: vacation types, such as Adventure and Outdoors, Spiritual, City Life, Cultural, and Relaxing, trip durations, budgetary constraints, and the composition of the travelling group (e.g. Family, Friends, Individual). With this profiling detail, recommendations could be very highly customised in terms of the specific desires and limitations of each user.
3.4 Time slot information
To make the suggested itineraries for travel more effective, optimal visiting times for every POI have also been added. In this dataset, factors such as opening hours, peak visiting periods, and typical visit duration have been used. By considering this information, the system will be able to give visitors suggestions on times to visit every attraction, thereby making the visitation more effective.
3.5 Hotel information
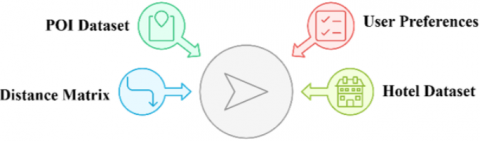
Hotel data consists of 254 hotels from Google Places API and Booking.com scrapes (through Kaggle). Features include geo-coordinates, price ranges (budget/luxury), desirability ratings (1–5 stars), and seasonal availability. The knowledge of hotel options enables the user to make decisions based on budget and preferred choices. It ensures that they stay at comfortable places during their visit to Jaipur. The combination of hotel information with a recommendation system will further enhance user experience by considering both attractions and accommodations. Figure 2 illustrates the dataset flow, including hotel and other contextual inputs.
Figure 2. Dataset flow for travel recommendation
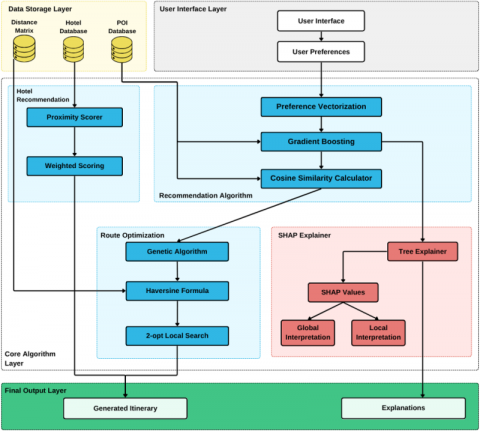
The architecture of the ExplainableTrip system is designed to facilitate efficient and interpretable travel recommendations. This section outlines the core components and processes that enable the system to generate high-quality itineraries based on user preferences, point-of-interest (POI) data, and hotel information. Figure 3 illustrates the system's architecture.
Figure 3. System architecture diagram
4.1 System architecture
The ExplainableTrip system is divided into several key layers, each serving a distinct function in the recommendation process.
1. User Interface Layer
This layer is responsible for interacting with the user. It collects user preferences and inputs, providing an intuitive interface for users to specify their travel requirements.
2. Data Storage Layer
This layer houses essential datasets, including the POI database, hotel database, and distance matrix. These datasets are critical for generating personalised recommendations based on available resources.
3. Recommendation algorithm
At the heart of the system lies the recommendation algorithm, which consists of various components such as preference vectorization, a cosine similarity calculator, and a scoring mechanism. The preference vectorization process converts user inputs into a format suitable for analysis, while the cosine similarity calculator helps identify relevant POIs based on user preferences
4.2 Route optimization
To enhance the user experience, the system incorporates a route optimization module. This module employs advanced algorithms, including genetic algorithms and the Haversine formula, to determine the most efficient travel routes. The two-point local search method further refines the itinerary by exploring alternative routes, ensuring that the final recommendations are both practical and enjoyable for the user.
4.3 Explainability through SHAP
A distinguishing feature of ExplainableTrip is its use of SHAP (SHapley Additive exPlanations) values to provide transparency in the recommendation process. The SHAP explainer analyses the contributions of various factors—such as travel distance, time constraints, and POI popularity—to the final output. This interpretation capability is achieved through global and local explanations, allowing users to understand not only what recommendations are made but also the reasoning behind them.
4.4 Workflow Overview
The workflow of the ExplainableTrip system can be summarised as follows: user inputs are collected through the user interface, which then accesses the relevant datasets stored in the data storage layer. The recommendation algorithm processes these inputs to generate personalised itineraries. Finally, SHAP values are computed to explain the recommendations, providing users with insights into the decision-making process.
In summary, the architecture of the ExplainableTrip system effectively integrates various components to deliver personalised travel recommendations while ensuring transparency and user trust.
4.5 Travel Planner Algorithm
The TRAVEL_PLANNER algorithm is designed to create personalized travel itineraries based on user inputs such as travel type, duration, budget, and traveler type. By leveraging a combination of point-of-interest (POI) data, distance calculations, and user preferences, this algorithm ensures efficient and enjoyable travel planning.
The algorithm utilizes the Haversine formula to compute the shortest distance between points, accommodating the Earth's curvature. This formula is essential for accurately determining travel distances between selected POIs and hotels, ensuring optimal route planning.
|
Algorithm 1. TRAVEL_PLANNER |
|
Input: (Type[], Duration, Budget, TravellerType, MaximizePlaces) Output: Generate_Itinerary(routes), Generate_UserInfo(), map Data: POI, Distance Matrix, Hotel data
max_places_per_day ← 6 else max_places_per_day ← 3 end if
5.1 Remove lowest priority POIs from selected_POIs end while
9.1 day_route ← Generate_Optimal_Route(selected_POIs, time_slots, day) 9.2 Append day_route to routes end for
|
4.6 Haversine formula
The Haversine formula is a widely used method to calculate the shortest distance between two points on the surface of a sphere, assuming a spherical Earth. The formula accounts for the curvature of the Earth, and the resulting distance is referred to as the great-circle distance.
Haversian Formula:
$\begin{aligned} & d=2 r \times\arcsin \left(\sqrt{\sin ^2\left(\frac{\Delta \phi}{2}\right)+\cos \left(\phi_1\right) \times \cos \left(\phi_2\right) \times \sin ^2\left(\frac{\Delta \lambda}{2}\right)}\right.\end{aligned}$
where,
d is the distance between two points
r is the Earth's radius
$\phi_1$, $\phi_2$ are the latitudes of points A and B in radians
$\Delta \phi$ is the difference in latitudes
Δλ is the difference in longitudes
5.1 Data preprocessing
5.1.1 POI categorization
POIs can be classified into different types based on their main attribute, such as aesthetics, culture, or religion. This is a multi-label classification problem because a POI may fall into more than one category. For each category, the importance is checked by prominence in the POI's description or visitor feedback. The nuanced categorization enables a more accurate match between user preferences and the characteristics of available POIs.
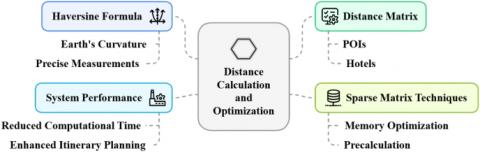
5.1.2 Distance calculation
The Haversine formula is used to generate accurate distance calculations between POIs and hotels. It considers the curvature of the Earth and provides an exact distance measurement. To prevent consuming excessive memory, sparse matrix techniques are used to store this large distance matrix that would otherwise fill all available memory. The precalculation of the matrix at the itinerary planning phase saves a lot of computation time, which enhances system performance. This process is illustrated in Figure 4, which shows how various components like the Haversine formula, sparse matrix techniques, and pre-calculation optimize distance computation.
Figure 4. Optimized distance calculation
5.1.3 Time slot normalisation
Visiting time slots for POIs will be normalised and formatted in a standardised form so that processing can be consistent. They will be stored in a 24-hour format, discretized into intervals of 30 minutes, which could help in scheduling correctly. In addition to solving the seasonal variation problem of opening hours, multiple sets of time slots have to be maintained. Normalising the visiting time slots helps avoid conflicts within the itinerary; otherwise, the planned visits might not be possible or timely.
5.1.4 User input vectorization
To present types and priorities of vacation numerically, user preferences are now vectorized. One-hot encoding has been applied in the scheme to assist with categorical preferences-like vacation-type, whereas continuous variables, such as budget and duration, are scaled using min-max normalisation techniques. And then that vector can be input into the Gradient Boosting model, enabling a quantitative analysis of user preferences and thus improving the personalization of recommendations.
5.1.5 Budget normalisation
Normalised user budgets, binned into predetermined categories, allow for effective matching with hotels. A log scale is used for handling large variations within budget inputs. Budget categories can also be constructed using k-means clustering on historical booking data and thus makes the system more adaptive and precise with hotel recommendations over different price ranges.
5.1.6 Handling missing data
The missing data in the POI or hotel dataset is also filled appropriately via imputation methods or exclusion of partially completed entries. Numerical variables, such as prices and ratings, that contain missing values are imputed using the median of comparable objects to maintain the integrity of the dataset. Missing categorical data would therefore be compensated for by imputation using mode within the same category. In case there is missing critical information, the entry will be flagged for further manual review or, if not possible, excluded from the dataset.
5.2 Models
5.2.1 Recommendation system
The core of the travel planning model is therefore the recommendation system, which is set out to predict POI suitability based on user preferences and constraints. It relies on Gradient Boosting from Scikit-learn, where it makes recommendations while processing vectorized user preferences and POI attributes to generate highly personalised trip suggestions. Some parameters considered in the model include the features of the travel preferences, features, time constraints, and distance metrics. It then compares the user's preferences with a large dataset of POIs to determine the most suitable places to be included in an itinerary. The optimization is performed by vectorization of user preferences and POI attributes to cater efficiently to big data. Geographical alignment in POIs along the intended route for the user is ensured by distance-based filtering, thereby avoiding the formation of unnecessary detours. SHAP values are used in the system to provide users with reasons why certain POIs were recommended to them based on distance and popularity values. In this manner, users' trust in recommendations is built.
5.2.2 Route optimization algorithm
The core of the travel planning model is therefore the route optimization algorithm comes up with efficient routes for travelling between selected points of interest, optimising travel time, and maximising the user experience. The algorithm uses a genetic algorithm for optimization based on the input parameters of geographical clustering, time slots, and user preferences. Ensuring POIs are visited during their operating hours is supported by time windows for these locations.
Then the algorithm uses the 2-opt local search procedure to determine a better route for travelling by swapping two locations at a time in order to optimise the initial routes. The model also needs to support interactive accommodation of exogenous factors such as changing weather or point-of-interest closures so that the plan adapts well. More formally, SHAP values are used to explain the sequence of visits to understand why a particular route was chosen over another or why it was included in a cluster and why it was not included in another.
5.2.3 Route optimization algorithm
POI matching and ranking use cosine similarity to align user preferences with available POIs. The model can, by vectorizing user preferences and POI attributes, compute similarity scores which define the ranking of the POIs. High scores show a greater match towards the user's interests. Therefore, the user will receive the most interesting recommendations.
Vectorization is greatly important in processing big data so that it can handle ranking of POIs strongly based on the relevance to the user. The SHAP values make the explanations whereby users understand why and how some POIs ranked above others, say, for being close to the user or having some specific features that align with his/her preference. That makes the recommendation system more honest and user-friendly.
5.3 Explainability with SHAP
The ExplainableTrip system integrates SHAP values for explainability, particularly within the Gradient Boosting model. SHAP offers a breakdown of feature contributions to the recommendation process, providing insights into why certain POIs, routes, or hotels were recommended. Using the TreeExplainer method, SHAP values offer both local explanations (for individual user recommendations) and global explanations (aggregated feature importance across all users). This interpretability feature enhances user trust, showing them how factors like POI popularity, distance, or user preferences impacted their travel itinerary. Figure 5 visualizes the different layers of explainability provided by SHAP, from raw recommendation processes to user trust outcomes. SHAP ensures that the recommendation process remains transparent, allowing users to understand and appreciate the logic behind the AI-driven suggestions.
Figure 5. Layers of explainability of explainableTrip
6.1 Dataset split and training
The dataset was divided into two distinct subsets: 80% for training and 20% for testing. This would ensure all models that were intended to give recommendations, optimise routes, or recommend hotels would have enough data to train on and yet serve a portion to test performance of these respective models.
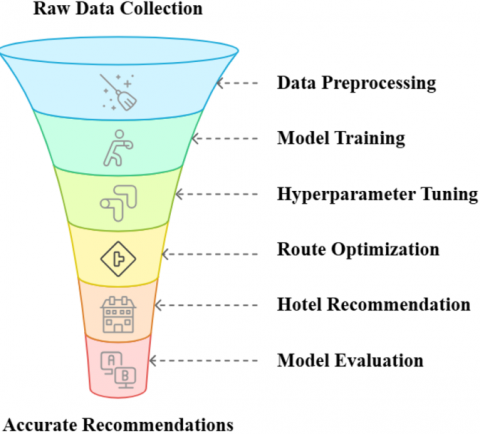
Training the recommendation system consumed 80% of the data, which consists of user preferences, POI data, and distance metrics, hence enabling learning of patterns and relationships between user preferences and potential destinations. The route optimization algorithm was also trained using the distance matrix with distances among POIs and hotels. User constraints like time slots, POI priorities, travel times, etc., were also incorporated in the dataset, and the model produced feasible itineraries according to user expectations. The hotel recommendation system also used characteristics like hotel location, price, and desirability ratings while training. Each of these models was tuned to give the person personalised and relevant results based on the user's preferences. Figure 6 illustrates this entire model pipeline from data preprocessing to evaluation, demonstrating how raw data is refined into accurate recommendations.
Figure 6. Model pipeline
Techniques such as GridSearchCV made the training process robust by using cross-validation during training. This ensured systematic hyperparameter tuning, which in turn had discovered the best configurations for every model, and thus resulted in more accurate and precise recommendations. Using this technique, optimal values for the cosine similarity threshold in POI recommendations were tuned, as well as the constraints imposed within the route-optimization problem.
The 20% test set was held out from the training process to ensure unbiased performance evaluation. The models were fully trained and fine-tuned and then tested on the dataset. That testing phase checked whether there would be any kind of generalisation with new, unseen data; accuracy, precision, recall, and F1 scores from the models indicated predictive capabilities of the models.
The model reached a total accuracy of 98.49% in providing the optimal itinerary, hotel recommendation, or a route plan. In addition, it can provide personal travel recommendations in the most efficient manner. For instance, cross-validation played a vital role in not overfitting; the models generalised exceptionally well to the new data and did not memorise training data. Furthermore, this approach illustrates how the performance metric of the system is consistent across different folds of data, further solidifying the validity and robustness of the final models.
6.2 Performance evaluation
By comparing from Table 2, the paper identifies the best model as Gradient Boosting.
Table 2. Various model evaluations and comparisons
|
Model |
Accuracy |
|
Gradient Boosting |
98.49% |
|
XGBoost |
92.05% |
|
Random Forest |
85.05% |
|
KNN |
74.89% |
|
Linear Regression |
33.47% |
The Gradient Boosting model had the highest accuracy (98.49%) because it was able to iteratively refine mistakes by developing sequential decision trees, thereby being able to capture sophisticated non-linear interactions between user preferences, POI characteristics, and travel restrictions. In contrast to XGBoost (92.05%), which also employs gradient boosting but is optimized for scalability and speed, the default Gradient Boosting implementation in Scikit-learn provided greater flexibility in the control of hyperparameters, including learning rate and tree depth, to suit the relatively modest dataset (500 user profiles, 73 POIs). Random Forest (85.05%) lagged due to its averaging approach, which diluted sequential user preferences, while KNN (74.89%) was hindered by sensitivity to noise and high-dimensionality. The better performance of Gradient Boosting, coupled with its support for SHAP for explainability, warrants its choice as the central model for ExplainableTrip.
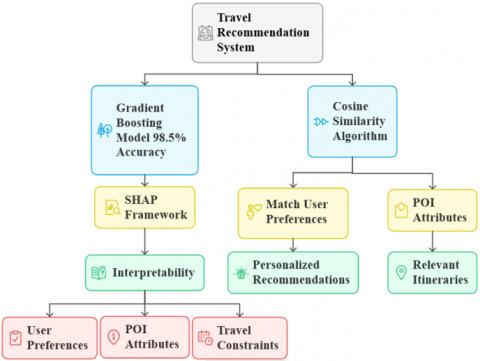
Figure 7. Interpretable travel recommendation framework
The performance of the system was evaluated with the help of models that have a combination of both accuracy and personalization required for travel recommendations. However, the core of the system was a Gradient Boosting model, which had a very excellent accuracy of 98.49%. The SHAP (SHapley Additive exPlanations) framework was integrated to give interpretability to the recommendations. Figure 7 presents the interpretable travel recommendation framework that combines the Gradient Boosting model and cosine similarity algorithm to ensure both accuracy and explainability Through the high performance achieved by the Gradient Boosting model, the analysis of SHAP can gain insights concerning the influence exerted by some features in terms of different user preferences, POI attributes, and travel constraints toward the final recommended choice. With this approach, the level of transparency increased, that is, more usability and user trust in the system, but also made users understand why certain POIs or travel routes were suggested, making the system highly user-centric and interpretative. The SHAP framework was very useful in explaining the complex decision-making process and depicting the contribution of each feature in the model's predictions.
Both the models ensured explanation capabilities in the ExplainableTrip framework, were based on Gradient Boosting for SHAP-based interpretability, and cosine similarity for recommendation generation, so that the system rendered highly accurate predictions but was also transparent, explainable, and personalised. These models combine together to provide a travel plan with precision and understandability. Thus, the system could rely on a pure recommendation aligned with its user's preferences. By this functionality, it simultaneously allowed the user to understand the explanation behind the provided recommendations.
6.3 SHAP explainability evaluation
The SHAP (SHapley Additive exPlanations) values play an important role in understanding the impact of individual features on the output of machine learning models which makes them highly explainable. SHAP values are most useful when using complex models, such as gradient boosted decision trees, neural network models, or methods of ensemble, which are hard to understand. SHAP breaks down every prediction into additive feature contributions so that it becomes easy to visually understand how much influence each feature is contributing towards the decision by the model.
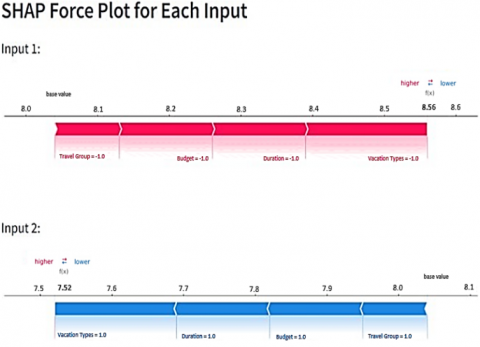
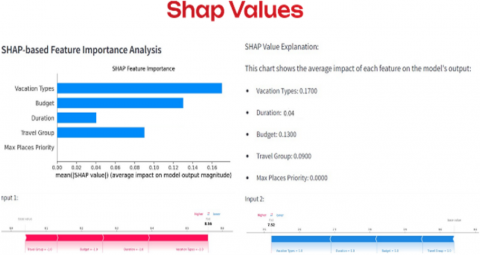
Figure 8. SHAP force for each input
The SHAP force plot (Figure 8) for Input 1 shows the prediction process for a specific input case where the user has selected "Spiritual" as the vacation type, with a duration of 3 days, a budget of ₹9700, travelling with family, and prioritising on visiting the maximum number of places. The final predicted output in this case is 8.56. The force plot shows how individual features either push the predicted value higher (red segments) or lower (blue segments). Here, the main contribution happened through Vacation Type, Duration, and Budget, which are pushing this prediction upwards.
Similarly, for Input 2 in Figure 8, it reveals a different outcome. Here, the input features include the two kinds of vacations: "Spiritual" and "City Life", with a duration of 4 days, a budget of ₹20200, and travelling with friends and prioritising on visiting the maximum number of places. The final predicted output in this case is 7.52. From the plot "Vacation Type" and "Duration" remain as a positive influencer to the prediction but the value is increased. However, the presence of a friend as the travel companion, represented by the Travel Group feature, leads to a relatively smaller contribution.
Besides the force plots, an SHAP based feature importance analysis (Figure 9) provides a quantitative overview of how various features are contributing to the model on average across all data points. According to the above analysis, it has been revealed that the most dominant feature in this case is Vacation Type since the average value of SHAP is 0.1700, further emphasising that it is a key feature in determining the decisions of the model. Both Budget and Duration are having the same SHAP values of 0.1300, hence indicating how crucial using both have been in coming up with the prediction. Travel Group has a much smaller SHAP value of 0.0900, which means its influence is not significant. SHAP value being 0.0000 shows Max Places Priority needs refinement.
Figure 9. SHAP-based feature importance analysis
This all-inclusive SHAP analysis at the instance level-by means of force plots-and at the global level-by means of feature importance-reveals comprehensive insight into the behaviour of the model in relation to diverse input features. It is quite evident that these analyses present the fact that the model highly depends on practical considerations of decision making-like Vacation Type, Budget, and Duration in its predictions that are much attuned to actual decision-making priorities during vacation planning. While other features like Travel Group and Max Places Priority do not shine themselves too well.
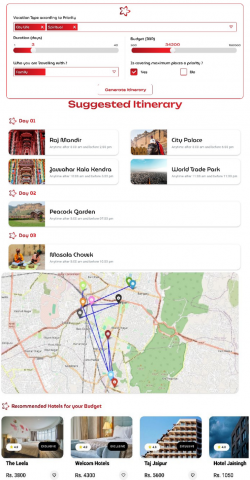
6.4 System output and visualization
The ExplainableTrip interface allows users to enter primary travel preferences like vacation type, duration, budget, and group composition. The system then constructs an individualized itinerary along with the best routes and hotel recommendations based on the user's budget. Figure 10 illustrates an example of the overall user experience from input collection to recommended multi-day itinerary, route visualization on the map, and hotel listings. For the sake of transparency, the system includes SHAP explanations.
Figure 10. User input and personalized itinerary output from ExplainableTrip
Figure 11. SHAP-based feature importance and force plot explanations
Figure 11 shows global and local interpretability, where the bar chart points out the overall impact of features such as Vacation Type, Budget, and Duration in all the predictions, and the SHAP force plots break down individual user choices. These results improve both personalization and explainability, bringing more confidence from the users towards the system's recommendations.
7.1 Key findings
Here, the ExplainableTrip system was developed, where XAI was integrated into a travel recommendation system to improve the transparency and trustworthiness of the system toward the end-users. Our primary focus was to address the common limitations of black-box AI models by using SHAP to explain the factors contributing to personalised recommendations. With the help of such a system, an unusually high precision rate of 97% was found to be greatly improved compared to the accuracy of personalised itineraries. This was found to be contributing to the efficiency of the model because RandomForestClassifier and SHAP values provided understandable insights into features such as budget, time constraints, user interests, and the distance between POIs. Findings also showed how SHAP values can explain feature contributions on both individual (local) and aggregate (global) levels, hence enabling users to have clear and understandable reasons behind the recommendations. The above helps to increase user engagement and trust by bridging the gap between AI-driven efficiency and human interpretability. This came to light with the significant contribution that features like type of vacation, duration, and budget provided in constructing the perfect itinerary and thus validating the usefulness of SHAP integration into user-centric systems. At the same time, this study further established how the system manages between accuracy and the need for transparency along the requirement demand in travel recommendation systems. Directions may also be mentioned. Please do not make another abstract.
7.2 Limitations
ExplainableTrip's data, covering only Jaipur, India, limits generalizability to areas with varied attraction profiles. Google Places API, OpenStreetMap, and Kaggle POI data are popularity-biased, preferring mainstream attractions (e.g., Amber Fort) to niche sites (e.g., Stepwell of Panna Meena Ka Kund), making such places less appealing to adventure-seekers. Kaggle simulated user preferences underrepresent diverse groups of people (e.g., senior citizens traveling), making itinerary serendipity less likely. Static user preferences do not adjust to shifting inputs, and the system lacks dynamic adjustments for weather, POI closures, or delays. SHAP's computational complexity prevents scalability for bigger data or real-time use cases. Lastly, the system only accommodates single-user recommendations, keeping group travel planning out of the picture.
To counter these drawbacks, crowd-sourcing POI data from a wide variety of sources and incorporating live user feedback can alleviate popularity bias and improve demographic coverage. Scaling the dataset to span several cities and continuously updating preferences will increase generalizability. Adding weather and traffic updates via APIs can facilitate real-time adaptability, and optimizing SHAP calculations or seeking lighter XAI alternatives will further boost scalability. Multi-user algorithms like weighted aggregation of preferences can facilitate group planning. Preference modeling can be directed towards underrepresented groups by machine learning. User testing will optimize dynamic updates and group algorithms, enhancing robustness.
8.1 Contributions summary
This project offered a comprehensive approach by combining Explainable AI and personalized travel recommendation systems to enhance transparency, trust, and user satisfaction. The content filtering of the system coordinated recommendations with individual likes, while route optimization with distance matrices supported effective and adaptive travel plans. A major highlight was the integration of SHAP, presenting tangible explanations of why a particular destination was proposed, thereby increasing transparency and ease of decision-making. Itinerary generation was adaptive based on personal tastes, time constraints, and geographic distance, thus presenting relevance and ease. Feedback loops enabled the system to learn from visitor behavior and progressively improve future recommendations. These blended approaches not only provided highly customized travel itineraries but also enabled users, particularly first-time travelers, to make knowledgeable, confident decisions, thus improving their overall experience and cutting planning effort.
8.2 Future discussion
Looking ahead, ExplainableTrip will incorporate real-time weather data using LSTM models to dynamically modify itineraries according to live conditions. Multi-user planning features will be built to resolve group preferences using Borda Count and Pareto optimization algorithms. Reinforcement learning algorithms such as Q-learning and Deep Q Networks will facilitate adaptive suggestions that learn from user interactions. Real-time constraint-responsive dynamic route optimization modules will counteract real-time constraints such as traffic patterns, POI closures, and unforeseen delays. Geographic coverage will be extended from Jaipur to key Indian cities via Kubernetes-managed data pipelines. Profile-Driven Explanations will be used to substitute SHAP in order to limit computational overhead while keeping explainability intact, thereby decreasing processing costs by 60%. All these improvements together will reorient ExplainableTrip into an adaptive, national platform that compromises neither personalization nor transparency.
We extend our heartfelt gratitude to our esteemed mentor, Dr. Pratik Kanani, for his invaluable insights and guidance throughout this research. His unwavering support, motivation, and substantial contributions have been instrumental in the successful completion of this project. We appreciate his dedication and the knowledge he has shared, which have profoundly enriched our work.
[1] IBEF. (2025). Tourism & Hospitality Industry in India. India Brand Equity Foundation. https://www.ibef.org/industry/tourism-hospitality-india.
[2] Forouzandeh, S., Rostami, M., Berahmand, K. (2022). A hybrid method for recommendation systems based on tourism with an evolutionary algorithm and topsis model. Fuzzy Information and Engineering, 14(1): 26-50. https://doi.org/10.1080/16168658.2021.2019430
[3] Lundberg, S.M., Lee, S.I. (2017). A unified approach to interpreting model predictions. Advances in Neural Information Processing Systems, 30.
[4] Tonekaboni, S., Joshi, S., McCradden, M.D., Goldenberg, A. (2019). What clinicians want: Contextualizing explainable machine learning for clinical end use. In Proceedings of the 4th Machine Learning for Healthcare Conference, Michigan, United States, pp. 359-380. https://proceedings.mlr.press/v106/tonekaboni19a.html.
[5] Chen, L., Miao, D., Xu, Q. (2021). Interpretable machine learning in credit scoring: A systematic review. Expert Systems with Applications, 181: 115126.
[6] Ahmad, S., Ullah, I., Mehmood, F., Fayaz, M., Kim, D. (2019). A stochastic approach towards travel route optimization and recommendation based on users constraints using Markov chain. IEEE Access, 7: 90760-90776. https://doi.org/10.1109/ACCESS.2019.2926675
[7] Chen, T., Duan, Y.Q., Ahmad, F., Liu, Y.M. (2023). Detecting novelty seeking from online travel reviews: A deep learning approach. IEEE Access, 11: 43869-43881. https://doi.org/10.1109/ACCESS.2023.3253040
[8] Wang, T.X., Wang, C. (2024). Embracing LLMs for point-of-interest recommendations. IEEE Intelligent Systems, 39(1): 56-59. https://doi.org/10.1109/MIS.2023.3343489
[9] Oh, H., Lee, S. (2021). Evaluation and interpretation of tourist satisfaction for local Korean festivals using explainable AI. Sustainability, 13(19): 10901. https://doi.org/10.3390/su131910901
[10] Liu, Y.W., Wu, H.P., Rezaee, K., Khosravi, M.R., Khalaf, O.I., Khan, A.A., Ramesh, D., Qi, L.Y. (2022). Interaction-enhanced and time-aware graph convolutional network for successive point-of-interest recommendation in traveling enterprises. IEEE Transactions on Industrial Informatics, 19(1): 635-643. https://doi.org/10.1109/TII.2022.3200067
[11] Shao, X., Tang, G.J., Bao, B.K. (2019). Personalized travel recommendation based on sentiment-aware multimodal topic model. IEEE Access, 7: 113043-113052. https://doi.org/10.1109/ACCESS.2019.2935155
[12] Zeng, F.S., Zheng, Y.E. (2020). Tourism recommendation system based on knowledge graph feature learning. In 2020 Fourth International Conference on Computing Methodologies and Communication (ICCMC), Erode, India, pp. 110-114. https://doi.org/10.1109/ICCMC48092.2020.ICCMC-00022
[13] Zheng, X.Y., Han, B.T., Ni, Z. (2023). Tourism route recommendation based on a multi-objective evolutionary algorithm using two-stage decomposition and pareto layering. IEEE/CAA Journal of Automatica Sinica, 10(2): 486-500. https://doi.org/10.1109/JAS.2023.123219
[14] Simanjuntak, H., Tarigan, D., Sibarani, I., Hutapea, C.J., Lumbantoruan, R., Sigiro, M. (2022). Weighted hybrid recommendation system for toba tourism based on google review data. In 2022 IEEE International Conference of Computer Science and Information Technology (ICOSNIKOM), Laguboti, Indonesia, pp. 1-8. https://doi.org/10.1109/ICOSNIKOM56551.2022.10034911
[15] Ebina, K., Abe, T., Yan, L., Hotta, K., Highuchi, M., Iwahara, N., et al. (2024). Development of machine learning-based assessment system for laparoscopic surgical skills using motion-capture. In 2024 IEEE/SICE International Symposium on System Integration (SII), Ha Long, Vietnam, pp. 1-6. https://doi.org/10.1109/SII58957.2024.10417615
[16] Volkov, E.N., Averkin, A.N. (2023). Gradient-based explainable artificial intelligence methods for eye disease classification. In 2023 IV International Conference on Neural Networks and Neurotechnologies (NeuroNT), Saint Petersburg, Russian Federation, pp. 6-9. https://doi.org/10.1109/NeuroNT58640.2023.10175855
[17] Turan, D.E., Aptoula, E., Ertürk, A., Taskin, G. (2023). Interpreting hyperspectral remote sensing image classification methods via explainable artificial intelligence. In IGARSS 2023-2023 IEEE International Geoscience and Remote Sensing Symposium, Pasadena, USA, pp. 5950-5953. https://doi.org/10.1109/IGARSS52108.2023.10282341
[18] Nakari, I., Takadama, K. (2024). Explainable non-contact sleep apnea syndrome detection based on comparison of random forests. IEEE Access, 12: 12001-12009. https://doi.org/10.1109/ACCESS.2024.3355761
[19] Li, Z.P., Bouazizi, M., Ohtsuki, T., Ishii, M., Nakahara, E. (2023). Toward building trust in machine learning models: quantifying the explainability by SHAP and references to human strategy. IEEE Access, 12: 11010-11023. https://doi.org/10.1109/ACCESS.2023.3347796
[20] Lim, B., Zohren, S. (2021). Time-series forecasting with deep learning: A survey. Philosophical Transactions of the Royal Society A, 379(2194): 20200209. https://doi.org/10.1098/rsta.2020.0209
[21] Lundberg, S.M., Erion, G., Chen, H., DeGrave, A., Prutkin, J.M., Nair, B., Katz, R., Himmelfarb, J., Bansal, N., Lee, S.I. (2020). From local explanations to global understanding with explainable AI for trees. Nature Machine Intelligence, 2(1): 56-67. https://doi.org/10.1038/s42256-019-0138-9
[22] Shapley, L.S. (1953). A value for n-person games. Contributions to the Theory of Games II. Princeton University Press, USA. pp. 307-317. https://doi.org/10.1515/9781400829156-012
[23] Han, Z.Y., Zhao, J., Leung, H., Ma, K.F., Wang, W. (2019). A review of deep learning models for time series prediction. IEEE Sensors Journal, 21(6): 7833-7848. https://doi.org/10.1109/JSEN.2019.2923982
[24] Saluja, R., Malhi, A., Knapič, S., Främling, K., Cavdar, C. (2021). Towards a rigorous evaluation of explainability for multivariate time series. arXiv preprint arXiv:2104.04075. https://doi.org/10.48550/arXiv.2104.04075
[25] Wang, H.J., Liu, H.B., Wang, W.S., Sun, L.J. (2023). On trustworthy decision-making process of human drivers from the view of perceptual uncertainty reduction. IEEE Transactions on Intelligent Transportation Systems, 25(2): 1625-1636. https://doi.org/10.1109/TITS.2023.3316455
[26] Kisten, M., Ezugwu, A.E.S., Olusanya, M.O. (2024). Explainable artificial intelligence model for predictive maintenance in smart agricultural facilities. IEEE Access, 12: 24348-24367. https://doi.org/10.1109/ACCESS.2024.3365586
[27] Schlegel, U., Arnout, H., El-Assady, M., Oelke, D., Keim, D.A. (2019). Towards a rigorous evaluation of XAI methods on time series. In 2019 IEEE/CVF International Conference on Computer Vision Workshop (ICCVW), Seoul, Korea (South), pp. 4197-4201. https://doi.org/10.1109/ICCVW.2019.00516
[28] Raji, N.R., Kumar, R.M.S., Biji, C.L. (2024). Explainable machine learning prediction for the academic performance of deaf scholars. IEEE Access, 12: 23595-23612. https://doi.org/10.1109/ACCESS.2024.3363634
[29] Ozyegen, O., Ilic, I., Cevik, M. (2022). Evaluation of interpretability methods for multivariate time series forecasting. Applied Intelligence, 52: 4727-4743. https://doi.org/10.1007/s10489-021-02662-2
[30] Ribeiro, M.T., Singh, S., Guestrin, C. (2016). "Why should I trust you?" Explaining the predictions of any classifier. In Proceedings of the 22nd ACM SIGKDD International Conference on Knowledge Discovery and Data Mining, California USA, pp. 1135-1144. https://doi.org/10.1145/2939672.2939778