Soraya Nasser*![]() | Ghalem Belalem
| Ghalem Belalem![]() | Saïd Mahmoudi
| Saïd Mahmoudi![]()
© 2025 The authors. This article is published by IIETA and is licensed under the CC BY 4.0 license (http://creativecommons.org/licenses/by/4.0/).
OPEN ACCESS
Leukocytes, another name for white blood cells, or WBCs, are essential components of our immune system, playing a crucial role in protecting our bodies from infection and disease. When we look at immune disorders and bacterial infections, we see that lymphocytes play a central role in the adaptive immune response, while neutrophils are essential in the fight against bacterial infections, and basophils are involved in allergic and inflammatory reactions. When one of these three types of white blood cell (WBC) is affected, it can have a variety of consequences for the immune system and the body's overall health, leading to serious illnesses such as AIDS, leukemia and severe allergic reactions such as anaphylaxis. The diagnosis of some disorders can benefit greatly from the segmentation of the white blood cell nucleus. Analysis of cell morphology, in particular the shape and size of the nucleus in microscopic images, can provide indications of a cell's state of health. In this work, we suggest a fully automatic method for segmenting the nuclei of the three types of WBC (neutrophils, lymphocytes, basophils) using a convolutional neural network named WCSegNet based on the Unet architecture consisting of residual convolution blocks activated by the LeakyRlu activation function. Our technique succeeded in segmenting the cell nucleus and classifying microscopic images according to their type. The results obtained are encouraging, with precision scores in excess of 0.90.
white blood cells (WBC), nucleus segmentation, UNet, ResNet
Leukocytes referred to as white blood cells or WBCs, are essential immune system cells that shield the body from illness and infection. WBC nuclei analysis can reveal important details about the genesis, function, and activation state of these cells. many diseases can be diagnosed by examining cell nucleus features alone. Macawile et al. [1] explain how an aberrant range of specific white blood cells can lead to several severe disorders, including cancer, bacterial infections, and acquired immune deficiency syndrome.
Furthermore, physical and quantitative descriptors such as the morphology, texture, and color of WBCs play a critical role in the diagnosis of many blood-related diseases, some of which can be fatal if left untreated in time [2].
According to the study by Li et al. [3], the rapid detection of any deviation in leukocyte populations is crucial for the clinical detection of Burkitt lymphoma and acute promyelocytic leukemia, as it allows for early diagnosis and treatment. However, this task is complex, time-consuming, laborious, and subject to subjective variability by clinicians, requiring significant expertise. Hence, there is a growing demand for the development of automated systems capable of detecting leukocytes with high precision.
The integration of automatic segmentation and classification techniques into medical diagnostic tools has significantly improved the accuracy and speed of diagnosis. These techniques overcome the limitations of traditional manual methods, such as inter-observer variability and the lengthy analysis time. With automation, clinicians can focus more on therapeutic decision-making, thus enhancing the efficiency of the care process.
In radiology, artificial intelligence (AI) is not only used to detect anomalies; it also helps quantify disease progression [4], assess treatment response [5], and predict patient outcomes [6]. For instance, in cancer treatment, AI can measure tumor size and growth over time, providing crucial information for treatment planning [7].
Nucleus segmentation allows for the isolation and analysis of individual nuclei, facilitating the study of their morphological characteristics and genetic content. However, this task presents challenges, especially due to variations in image intensity, overlapping nuclei, and noise present in the images. Therefore, manual segmentation of images is impractical and time-consuming for pathologists [8]. As a result, computer-assisted approaches for analyzing medical images have proven to be faster and more consistent over the last few decades [9, 10].
Various techniques have been developed to segment microscopic images of white blood cells (WBCs) using shallow algorithms. Zhang et al. [11] and Liu et al. [12] employed the k-means clustering algorithm to segment WBCs in blood smear images based on pixel similarity. Thresholding was used in the approaches by some studies [13, 14]. Another approach described by Biswas and Ghoshal [15] combines a blood cell detection algorithm that uses a Sobel filter in the frequency domain for edge detection with a watershed transformation for threshold estimation. Additionally, Ghosh et al. [16] and Chaira [17] utilized fuzzy models for this task.
The study by Arslan et al. [18] defines two transformations and effectively applies them in a marker-controlled watershed method to employ color and shape information for segmentation. In addition, Gautam and Bhadauria [19] propose a method for segmenting nuclei from blood smear images using Otsu's thresholding technique. This is applied after contrast stretching, histogram equalization, and a minimum filter to reduce noise and enhance nucleus brightness. Mathematical morphology is then used to eliminate non-WBC components. Although each traditional classifier has had its share of successes, many limitations persist among them. Among the methods mentioned, some have demonstrated their effectiveness when the color of white blood cells (WBC) is distinct from that of red blood cells and platelets.
However, they can run into difficulties when the cell regions of interest (ROIs) show large variations in color, size, and shape [20]. However, the most prevalent drawback in the numerous works done before deep learning became popular is that features are created by hand using prior knowledge, which might not be reliable enough in every circumstance.
A remarkable improvement in the results of segmenting and classifying WBCs has been marked by the advent of techniques using convolutional neural networks (CNNs).
When we explore the literature on white blood cell (WBC) segmentation and classification, we find that methods based on UNet, ResNet, and RCNN are the most popular and produce good results. LeukocyteMask, for instance, is a leukocyte localization and segmentation technique that was introduced by Fan et al. [20]. This technique trains a deep convolutional neural network supervisor with pixel-level prior data and then uses ResNet-inspired residual blocks to pinpoint the leukocyte region of interest (ROI). This approach has given good results in segmenting the nucleus and cytoplasm of WBCs. In addition, Agrawal et al. [21] suggested the K-Means clustering technique together with a segmentation strategy based on the pairing of the Otsu adaptive threshold and the Gaussian distribution. A convolutional neural network is used to classify the retrieved features (CNN). Although the work produced good results, the method used presents certain limitations in terms of efficiency. Indeed, it relies on a three-step process: preprocessing, segmentation, and feature extraction, followed by classification using a CNN. This complex workflow is not only time-consuming but also resource-intensive.
In the study by Banik et al. [22], a WBC nucleus segmentation method was developed using color space conversion and the k-means algorithm. Using the location of the segmented nucleus as a guide, this technique isolates the white blood cells from the surrounding blood smear image. Furthermore, the idea of mixing the characteristics of the first and last convolutional layers and propagating the input image to the convolutional layer has been combined to create a novel convolutional neural network (CNN) model. This study, evaluated in the same context as the study by Agrawal et al. [21], presents similar drawbacks, involving multiple steps before reaching the CNN. Although the proposed CNN demonstrates significantly lower computational complexity compared to the four state-of-the-art CNN models, the process still includes detecting and localizing the WBC, cropping the localized regions, and subsequently feeding the cropped WBC to the CNN for training. This multi-step workflow is not only time-consuming and resource-intensive but also increases the overall complexity of the method. In the study [23], A two-phase hybrid multi-level approach is introduced to effectively categorize four WBC groupings. At the first level, a Faster R-CNN network is used for the identification of the WBC region of interest, as well as for the separation of mononuclear from polymorphonuclear cells. Second-level subclasses are recognized by two parallel convolutional neural networks with MobileNet structure after they have been split apart. This study achieved very good performance metrics, with average accuracy, precision, recall, and F-score of 98.4%, making it a promising tool for clinical and diagnostic laboratories. However, the use of CNN models such as Faster R-CNN and MobileNet presents significant limitations in terms of resources. Although these models are effective, they are extremely costly to train and deploy, requiring substantial hardware resources, which may limit their adoption in clinical environments where efficiency and resource economy are crucial. On the other hand, Metlek [24] proposes CellSegUNet, a hybrid segmentation model with an attention block that draws inspiration from residual UNet models and UNet's benefits. The CellSegUNet model, developed for cell nuclei segmentation, is a method based on deep learning algorithms, incorporating residual, attention, multiplication, and difference modules, as well as a min pooling layer and an output layer. Although the encoder and decoder blocks are similar to those of the classical UNet architecture, their internal structure differs significantly, notably through the use of residual structures applied both in series and in parallel. It was found that a high number of nodes in the same layer could negatively impact both the success and the cost of the process. Therefore, an attention module was proposed in the study. The model produced good results in terms of Dice, Jaccard, and accuracy, exceeding 95% on some datasets, but required a high number of epochs, reaching up to 175 epochs.
Alharbi et al. [25] also suggest a novel model that segments leukocytes from blood samples using ResNet and UNet networks for feature extraction. The author used a preprocessing phase involving standardization and normalization of the images, calculating the global mean and standard deviation for each image. This step ensures that pixel values are brought to a comparable scale, facilitating faster and more stable model training, the work achieved high scores such as IoU and precision, both exceeding 95%. Finally, Das et al. [26] have designed two models to recognize and differentiate myeloma cells from non-myeloma cells. For recognition, a Mask-Recurrent Convolutional Neural Network was used to extract the region of interest, Efficient Net B3 was employed for training. The model achieved 95% accuracy.
Additionally, the VGG architecture was utilized by Afshin et al. [27], while the Inception model was employed by Xia et al. [28].
Different works have used various CNN architectures to detect malaria. Kundu et al. [29] examine current developments in machine learning methods for the identification and detection of malaria in images. Furthermore, a thorough comparison of several machine-learning techniques is provided.
Yildirim and Çinar [30] identified the many types of white blood cells (eosinophils, lymphocytes, monocytes, and neutrophils) using CNNs trained on the Kaggle dataset, including AlexNet, ResNet50, DenseNet201, and GoogleNet. Both before and after the Gaussian and median filters were applied, the classification was performed.
DenseNet201 was used by Çinar and Yildirim [31] to categorize malaria images as either parasitized or healthy. Two filters were applied to the original dataset: a Gaussian filter and an average filter. When applying the DenseNet201 architecture to data filtered using the Gaussian filter, the greatest accuracy rate of 97.83% was achieved.
Based on the aforementioned research and our analysis of its positive and negative aspects, we present this research paper with the main objective of developing a medical diagnostic system targeted at specific conditions, such as bacterial infections and immune disorders. To achieve this goal, we focus on the segmentation and detection of neutrophil, lymphocyte, and basophil nuclei, which we consider to be the most suitable approach.
The choice to focus on neutrophils, basophils, and lymphocytes for segmentation is justified by both medical and technical reasons:
Medical Reason: A detailed analysis of neutrophils, basophils, and lymphocytes provides crucial information for clinicians:
- Diagnosis and monitoring of infections: Neutrophils are essential for identifying bacterial infections, while lymphocytes are important for tracking viral infections.
- Evaluation of allergies and chronic inflammation: Basophils, involved in the inflammatory response, are valuable indicators for allergic reactions.
- Immune status monitoring: Lymphocytes play a critical role in the overall immune response, and their analysis helps diagnose immune deficiencies or cancers.
By focusing on these specific cells, healthcare professionals can gain a better understanding of the patient's immune system, assess disease progression, and appropriately adjust treatments. This information is crucial for managing infections, monitoring immunocompromised patients, and detecting blood-related diseases [32, 33].
Technical Reason: The marked differences between the nuclei of neutrophils, basophils, and lymphocytes, especially in terms of shape and background coloration, present a major challenge for achieving robust segmentation. These variations make segmentation more complex, requiring advanced techniques to properly distinguish each cell type and ensure precise analysis.
It is essential that this segmentation is fully automatic, without any human intervention.
In this paper, we propose an automatic segmentation method to establish a multiple classification process. Our approach detects the three types of white blood cells (neutrophils, basophils, and lymphocytes) and segments their nuclei by assigning a color to each type. To achieve this, we used deep learning applied to a labeled blood database, via an Unet CNN architecture composed of convolution blocks and residual blocks, which we named “WCSegNet”. This modular and reusable approach enables us to create efficient and accurate network architectures.
We provide a detailed description of the dataset and the proposed architecture.
2.1 Data set
To evaluate our method in terms of robustness and accuracy we have used three databases DataSet1 “Jiangxi”, DataSet2 “CellaVision”, and DataSet2 “BCISC”. We selected these three datasets for our tests because they differ greatly from one another in terms of backdrop, cell shape, image color, and other characteristics that help us assess how resilient the suggested method is.
Dataset 1: “Jiangxi” was acquired from Jiangxi Tecom Science Corporation, China [34]. It has 300 120 × 120 WBC images with a color depth of 24 bits, showing 176 neutrophils, 22 eosinophils, 1 basophil, 48 monocytes, and 53 lymphocytes. Using an N800 D motorized autofocus microscope and a Motic Moticam Pro 252A optical microscope camera, the images in Dataset 1 were captured.
Dataset 2: “CellaVision” consists of 100 color, 300 × 300 images of various cell types (30 neutrophils, 12 eosinophils, 3 basophils, 18 monocytes, and 37 lymphocytes) that were gathered from the CellaVision blog (//blog.cellavision.com [34]. In contrast to dataset 1, cell images are often purple and may contain a large number of red blood cells surrounding white blood cells.
Dataset 3: “BCISC” was gathered by Fan et al. [20] with assistance from the Fujian Province's Third People's Hospital. It consists of two directories: the first has 268 images of individual white blood cells (51 neutrophils, 54 eosinophils, 56 basophils, 54 monocytes, and 53 lymphocytes) that are sized 256 × 256 and have been labeled by pathologists; the second has five sub-directories that are sized 2048 × 1538 and include 50 neutrophils, 49 eosinophils, 49 basophils, 48 monocytes, and 50 lymphocytes.
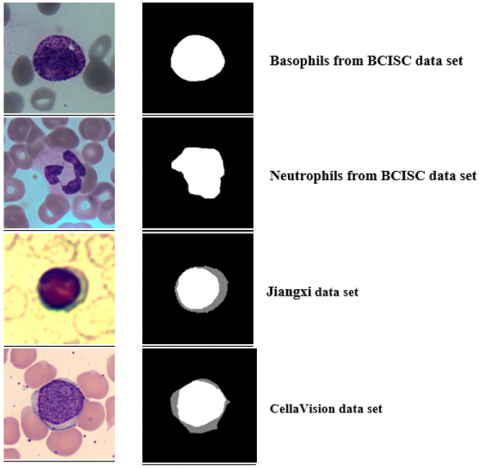
As previously mentioned, we aim to develop a system for the automatic segmentation of neutrophil, lymphocyte, and basophil nuclei. To this end, we have a set of images comprising 307 neutrophil images, 193 lymphocyte images, and 53 basophil images. All these images have been resized to a size of (120 × 120). Figure 1 shows some samples from the cohorts mentioned.
Figure 1. Some samples of: BCISC (Row 1 & 2), Jiangxi (Row 3), and Cella Vision (Row 4), show the original images (left) alongside their segmentations (right)
2.2 Data augmentation
The process of data augmentation involves applying various distortions to the original images, such as brightness change, zoom, and rotation [20]. In our situation, the datasets used with annotations are relatively small in comparison to computer vision standards, and finding new, large datasets with annotations is difficult and occasionally impossible. To get beyond these restrictions, data augmentation is required.
The techniques applied in this augmentation are as follows:
The total number of images increased tenfold thanks to data augmentation, reaching over 5000 blood microscopic images, including 3007 neutrophils, 1930 lymphocytes and 530 basophils. In Figure 2, we present some examples of augmented images.
Figure 2. Data augmentation examples of: Jiangxi (Row 1), CellaVision (Row 2), BCISC (Row 3 & 4), Column 1 to 6 are the original image, and corresponding "rotation_range": 40, "width_shift_range": 0.2, "shear_range": 0.2, "zoom_range": 0.2, and "horizontal_flip", respectively
2.3 Proposed CNN model
We have developed a multi-class convolutional neural network based on the U-Net architecture developed by Ronneberger et al. [35]. This is essential to extract more features and facilitate learning due to the diversity of the databases used, taken under different imaging and staining conditions by various medical microscopies.
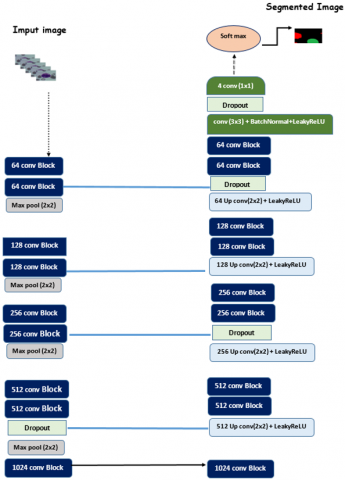
This network incorporates a modular architecture (Figure 3) that employs “Conv-Block” residual blocks (Figure 4) in both the encoder and decoder paths, inspired by ResNet [36]. Residual blocks help alleviate the problem of gradient disappearance and facilitate deep learning by improving the flow of information across layers. This approach enables the systematic assembly of network architectures.
Compared to architectures like U-Net, FCN, SegNet, Mask R-CNN, Attention Res-UNet, nnUNet, and ResUNet, our approach offers a better balance between network depth, segmentation accuracy, and the ability to recover fine details while avoiding gradient degradation [37]. This makes it an optimal choice for sensitive medical tasks such as WBC segmentation, where precision is crucial for reliable diagnosis and monitoring. On the other hand, Mask R-CNN is better suited for object detection and segmentation of multiple instances, but it is complex and resource-intensive. For a task such as WBC segmentation, which requires precise extraction of individual cell boundaries in a homogeneous context, ResUNet is more efficient.
However, SegNet performs worse at recovering fine details compared to U-Net or ResUNet because it does not use direct skip connections between the encoder and decoder. As a result, it may be less accurate for complex structures such as white blood cells, which require precise boundary differentiation [38].
Figure 3. Architecture of WCSegNet the network detects nucleus of WBC’s. ConvBlock: Residual block, Maxpool: max pooling, (#x#x): size of the filter, LeakyRelu: Leaky Rectified Linear Unit, #filters number, the blue lines represent the concatenation (-)
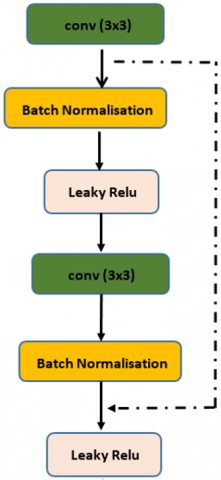
Figure 4. The architecture of residual block: → add connection
2.3.1 The encoding path
The encoder path consists of ten “Conv-Block” residual convolution blocks (Figure 4), each two followed by a max pooling layer (2 × 2). Each residual block consists of two convolution blocks (3 × 3). The first convolution block uses a LeakyReLU activation (Eq. (1)), while the second block uses no activation. Both convolution blocks have a stride of 1 and auto padding (same), and a residual connection is established by summing the input tensor with the output of the second convolution block. Finally, a LeakyReLU activation is applied. The first two residual blocks use 64 filters, the next two use 128 filters, then 256 filters, and finally 1024 filters are applied.
The choice of this filter sequence also contributes to optimizing training efficiency. Using 64 and 128 filters in the initial layers facilitates faster convergence, as these layers are less computationally demanding. The subsequent increase to 512 and 1024 filters is justified by the need to capture more complex features essential for accurate segmentation. Evaluations with either fewer or more filters could have been explored. For instance, using 32, 64, 256, and 512 filters might have limited the model's ability to capture intricate features, while opting for 128, 256, 1024, and 2048 filters would have significantly increased computational demands and potentially led to overfitting.
It is important to note that the Leaky ReLU activation function is a variant of the Rectified Linear Unit (ReLU) activation function, designed to address some of the issues inherent in ReLU. The ReLU function returns zero for all negative input values, which can result in the problem of "dead neurons" [39].
Eq. (1) defines the small slope that this function introduces for negative values.
$f(x)=\max (\alpha * x, x)$ (1)
In such cases, certain neurons cease to contribute to the learning process because they receive zero gradients, effectively preventing them from updating during training. In contrast, Leaky ReLU mitigates this problem by introducing a small slope (a small positive value, typically ranging from 0.01 to 0.1) for negative inputs. As a result, neurons still have a slight activation even for negative input values, allowing them to continue contributing to the learning process. This approach helps prevent the vanishing gradient problem, thereby enhancing training stability and accelerating model convergence [40]. Consequently, many researchers have adopted this activation function, as evidenced by the studies cited in references [22, 41].
A dropout layer was applied after the second residual “512 conv-block” which helps prevent over-fitting by preventing neurons from over-cooperating and making the model acquire stronger, more general features [42].
2.3.2 The decoding path
This path corresponds to the construction of part of the decoder in the U-Net architecture. It comprises four up-sampling layers (2×2) used to perform an upsampling operation, increasing the spatial size of the tensor by multiplying each dimension by 2. Next, two conv-block layers are applied, using 512, 256, 128, and 64 filters respectively. Two dropout layers are inserted in the middle of the path to regularize the model. Next, four concatenation layers are applied, followed by a convolution layer (3×3) with batch normalization, LeakyReLU activation, and a dropout layer. Finally, a final convolution layer (3×3) is applied to define the model's output layer. This 2D convolution uses a (1×1) size kernel on the network output, reducing the number of channels to 4, corresponding to the classes in the stained nucleus of (neutrophils, basophils, and lymphocytes) and the background. Activation is set to 'SoftMax', a method commonly used for multiclass classification tasks as it converts raw scores into probabilities for each class.
The model is configured with the Adam optimizer, while the loss function used is the categorical cross-entropy, adapted to multiclass classification problems, which can be calculated as follows:
$-\sum_{c=1}^M y_{0, c} \log \left(p_{0, c}\right)$ (2)
•M: number of classes.
•y: binary indicator (0 or 1) if class label c is the correct classification for observation o.
•p: predicted probability observation o is of class c.
2.3.3 The bottleneck layer
Two Conv-Blocks (3 × 3) with 1024 feature maps for each make up this layer.
2.4 Training
The CNN model was trained on an NVIDIA GeForce GTX 1050 GPU and implemented in TensorFlow using the Keras library with CuDNN 5.1. The system utilized an Intel Core i7 processor, 32 GB of RAM, and Windows 10. The training was performed using stochastic gradient descent with a mini-batch size of 16 images and an initial learning rate of 10-4.
2.5 Experiment
The network has been trained on a dataset comprising over 5,000 microscopic images of size (120 × 120) pixels, including data augmentation to improve diversity and learning robustness. These images are divided into three distinct subsets, each accompanied by its corresponding annotations. The first subset contains images of basophils, while the second is dedicated to neutrophils, and the third contains lymphocytes. This distribution is intended to facilitate further classification after segmentation. Each pixel of the segmented image is colored according to its membership of the corresponding subset: the background is black, basophils are represented in green, neutrophils in red, and lymphocytes in blue.
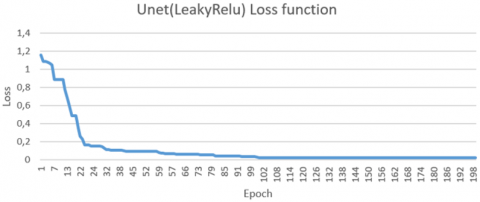
We separated the test and training sets in an 80:20 ratio, accordingly. Figures 5 and 6, respectively, demonstrate the trend in categorical cross-entropy loss for the training sets learned with Unet using LeakyRelu and WCSegNet.
Figure 5. Network convergence of UNet (LeakyRelu) during training
Figure 6. Network convergence of WCSegNet during training
We evaluated our experiments on three databases (Jiangxi, CellaVision, BCISC). To obtain a quantitative assessment of the model's performance, we subjected the segmentation results to a series of different tests: precision, Dice, and IuO (intersection over union), and accuracy. The evaluation metrics are calculated as follows:
The precision represents the proportion of positive predictions that the model correctly identifies.
$Precision=\frac{\mathrm{TP}}{\mathrm{TP}+\mathrm{FP}}$ (3)
In essence, accuracy measures the overlap between two samples and is expressed as the number of correct predictions out of the total number of guesses.
$Accuracy=\frac{T P+T N}{T P+T N+F P+F N}$ (4)
The Dice coefficient, which was initially created for binary data, is the harmonic mean of sensitivity and accuracy and may be computed as follows:
$Dice=\frac{2 T P}{2 T P+F P+F N}$ (5)
The Intersection over Union (IoU) similarity metric is utilized to assess the precision of object segmentation algorithms, by dividing the intersection by the union of the predicted and ground truth pixel sets.
$I o U( intersection \, over \, union )=\frac{T P}{T P+F P+F N}$ (6)
o True positives (TP) represent white cell pixels that are accurately detected within areas where ground truth indicates the presence of white cells.
o False positives (FP) are white cell pixels incorrectly identified outside areas where ground truth does not show the presence of white cells.
o True negatives (TN) are background pixels correctly identified outside areas where the ground truth does not show the presence of white cells.
o False negatives (FN) are background pixels that are incorrectly identified inside areas where the ground truth shows the presence of white cells.
As suggested by the equations above, a high Dice coefficient, close to 1, indicates a strong match between model predictions and actual masks, while a low coefficient, close to 0, indicates a limited match. Accuracy measures the proportion of pixels predicted as belonging to a specific class that corresponds to that class. High accuracy reflects the accurate classification of pixels overall. The precision is a number between 0 and 1, where 1 represents the best possible score and denotes the accuracy of all positive predictions, while 0 denotes the accuracy of none of the positive predictions. Conversely, the IoU is 0 if there is no overlap at all between the prediction set and the actual set. The IoU is 1 if there is a perfect overlap between the prediction and actual sets. The closer the IoU is to 1, the more precise the segmentation.
Table 1. Accuracy, Precision, Dice coefficient (Dice), and mean Intersect of Union (mIoU), from Unet with Relu, Unet with Leaky Relu, Fan et al. [20], Banik et al. [22], Alharbi et al. [25] and the proposed method respectively on, Jiangxi and Cella Vision data set
|
Data Set |
Method |
Accuracy |
Precision |
Dice |
mIoU |
|
Jiangxi |
Unet (Relu) |
0.9605 |
0.9191 |
0.8991 |
0.8788 |
|
Unet (LeakyRelu) |
0.9777 |
0.9401 |
0.9345 |
0.9270 |
|
|
Fan et al. [20] |
/ |
0.99432 |
0.98196 |
0.96 |
|
|
Banik et al. [22] |
0.9757 |
0.8763 |
0.94 |
/ |
|
|
Alharbi et al. [25] |
0.94 |
0.9590 |
/ |
0.962 |
|
|
Our method |
0.9805 |
0.9790 |
0.9653 |
0.9599 |
|
|
CellaVision |
Unet (Relu) |
0.9601 |
0.9344 |
0.9001 |
0.9144 |
|
Unet (LeakyRelu) |
0.9733 |
0.9409 |
0.9338 |
0.9190 |
|
|
Fan et al. [20] |
/ |
0.98947 |
0.98242 |
0.96671 |
|
|
Banik et al. [22] |
0.9886 |
0.9175 |
0.91 |
/ |
|
|
Alharbi et al. [25] |
0.94 |
96.52 |
/ |
0.9752 |
|
|
Our method |
0.9818 |
0.9706 |
0.9662 |
0.9609 |
Table 2. Accuracy, precision, Dice coefficient (Dice), and mean Intersect of Union (mIoU), from Unet with Relu, Unet with LeakyRelu, Fan et al. [20], and the proposed method respectively on BCISC data set
|
Data Set |
Method |
Accuracy |
Precision |
Dice |
mIoU |
|
BCISC |
Unet (Relu) |
0.9983 |
0.9501 |
0.9506 |
0.9319 |
|
Unet (LeakyRelu) |
0.9713 |
0.9655 |
0.9305 |
0.9170 |
|
|
Fan et al. [20] |
/ |
0.9844 |
0.9783 |
0.9647 |
|
|
Our method |
0.9923 |
0.9735 |
0.9658 |
0.9598 |
We evaluate the assessment measures' worth by contrasting our suggested segmentation approach with three current approaches [20, 22, 25] on databases 1 and 2 (Table 1), and on BCISC with only results (Table 2) [20]. We have added a comparison with the Unet architecture [24] with the Relu activation function and the LeakyRelu activation function on all three databases (Table 1 & Table 2).
As illustrated in Tables 1 and 2, the standard Unet model produced outstanding segmentation results, with precision and accuracy exceeding 95% for all three databases. In addition, it achieved an average Dice and IoU of over 90% for all three databases. The Unit improvement was achieved by replacing the ReLU function with LeakyReLU, resulting in a significant increase in scores. However, for practically all of the metrics computed on the three datasets, our technique performs better than any other method. We obtain outstanding accuracy, Dice and mIoU, clearly superior to the other methods (Unet with ReLU, Unet with LeakyReLU [22, 25], with values similar to the study by Fan et al. [20] for the tree data sets).
The UNet model using LeakyReLU required around 100 epochs to converge, while WCSegNet achieved convergence as early as the thirtieth epoch, as illustrated in the figure. In comparison, the model described in study [20] converged after around forty epochs. This highlights the speed of convergence of our model compared with the other methods tested.
The qualitative results confirm the effectiveness of our method. Examination of Figure 7 reveals a marked similarity between the ground truth and the predicted image, particularly in the delineation of the precise core boundaries in the BCISC database (lines 5, 6, 7). However, some images show blurred contours, notably in the Jiangxi and CellaVision databases, as illustrated in Figure 8 (yellow arrow), and some images in the BCISC database show the presence of a few misclassified pixels (false positives) circled in yellow. This results in relatively low Dice and accuracy scores compared with overall accuracy.
Blood cell classification was successfully carried out, as illustrated in the figure. Each cell type was correctly stained: basophils in green, neutrophils in red, and lymphocytes in blue. However, in a few images, we observed the appearance of red color at the outlines of basophils. This can be explained by basophil misrecognition, where some pixels in these images were incorrectly identified as neutrophils.
Our segmentation method offers several advantages over manual and semi-automated approaches, such as those described in the works [13, 14, 18].
Algorithms like Rough Sets [13] and K-means [14] require significant human intervention, making the segmentation process lengthy and vulnerable to errors due to observer variability. For instance, in the study [18], the method begins with an initial segmentation using color thresholding to distinguish potential cellular regions, followed by morphological operations to refine the segmentation. Furthermore, these works highlight that semi-automated methods can suffer from reproducibility limits, especially when different operators are involved. In contrast, our automatic segmentation technique reduces the need for human intervention and promotes result standardization, thus eliminating the inherent variability of manual methods. This is reflected in the lower Dice scores in the study [18] (approximately 0.70) compared to our results (0.96), even though the precision reaches around 0.98. This indicates that the method cited in the study [18] correctly predicts a large number of true positives, but also presents a significant number of false negatives, suggesting that it misses some important parts.
Our automatic nucleus segmentation method also enables the systematic and objective extraction of quantitative cell features, such as the size, shape, and texture of the nuclei. These features can then be used to inform classification models, facilitating differential diagnosis, which is much more challenging to achieve with manual approaches.
Figure 7. Results of visualizing the WCSegNet network's classification of the pixels in the various data sets: showing the original image (left), the ground truth (middle), the segmented image(right)
Figure 8. Results of visualizing the WCSegNet network's classification of the pixels
However, one of the main limitations of our method lies in its reliance on annotated training databases. Indeed, the quality of segmentation and classification heavily depends on the quality and quantity of the data used to train the model, particularly given that the number of basophils in the human body is limited, resulting in restricted annotated databases. To address this, we aim to expand our database by seeking varied datasets, including images of different qualities, such as those containing noise or presenting diverse backgrounds, in order to test the robustness of our method and enhance its functionalities.
In this work, we propose WcSegNet, an innovative technique for the classification and segmentation of white blood cells (WBC) in blood smear images. This method automatically segments WBCs, specifically focusing on neutrophils, basophils, and lymphocytes, assigning each cell a distinct color to facilitate their identification.
Our method is based on a multi-class convolutional neural network, built upon the U-Net architecture developed by Yildirim and Çinar [30]. This is essential for extracting more features and enhancing the learning process, given the diversity of the databases used, which come from different imaging conditions and staining techniques, captured through various medical microscopy methods.
To optimize deep learning and mitigate the issue of gradient vanishing, this network integrates residual "Conv-Block" blocks inspired by ResNet [36] in both the encoder and decoder paths. Additionally, the Leaky ReLU activation function was used instead of the standard ReLU function to ensure that all neurons contribute to the learning process, preserving complete information.
Our results, both quantitative and qualitative, demonstrate that our proposed approach represents a significant advancement over the state of the art, with accuracy exceeding 90% and rapid convergence. However, some images were misclassified and others poorly segmented, particularly due to overlapping colors in certain image types. These issues could be addressed by increasing the size of the database and refining the design of the convolutional neural network (CNN).
[1] Macawile, M.J., Quiñones, V.V., Ballado, A., Cruz, J.D., Caya, M.V. (2018). White blood cell classification and counting using convolutional neural network. In 2018 3rd International Conference on Control and Robotics Engineering (ICCRE), 259: 263. https://doi.org/10.1109/ICCRE.2018.8376476
[2] Mishra, S., Majhi, B., Sa, P.K. (2019). Texture feature based classification on microscopic blood smear for acute lymphoblastic leukemia detection. Biomedical Signal Processing and Control, 47: 303-311. https://doi.org/10.1016/j.bspc.2018.08.012
[3] Li, M., Lin, C., Ge, P., Li, L., Song, S., Zhang, H., Lu, L., Liu, X., Zheng, F., Zhang, S., Sun, X. (2023). A deep learning model for detection of leukocytes under various interference factors. Scientific Reports, 13: 2160. https://doi.org/10.1038/s41598-023-29331-3
[4] Liu, F., Zhang, Q., Huang, C., Shi, C., Wang, L., Shi, N., Fang, C., Shan, F., Mei, X., Shi, J., Song, F., Yang, Z., Ding, Z., Su, X., Lu, H., Zhu, T., Zhang, Z., Shi, L., Shi, Y. (2020). CT quantification of pneumonia lesions in early days predicts progression to severe illness in a cohort of COVID-19 patients. Theranostics, 10(12): 5613-5622. https://doi.org/10.7150/thno.45985
[5] Johnson, D., Goodman, R., Patrinely, J., Stone, C., Zimmerman, E., Donald, R., Chang, S., Berkowitz, S., Finn, A., Jahangir, E., Scoville, E., Reese, T., Friedman, D., Bastarache, J., van der Heijden, Y., Wright, J., Carter, N., Alexander, M., Choe, J., Chastain, C., Wheless, L. (2023). Assessing the accuracy and reliability of AI-generated medical responses: An evaluation of the Chat-GPT model. Research Square. https://doi.org/10.21203/rs.3.rs-2566942/v1
[6] Bera, K., Braman, N., Gupta, A., Velcheti, V., Madabhushi, A. (2022). Predicting cancer outcomes with radiomics and artificial intelligence in radiology. Nature Reviews. Clinical Oncology, 19(2): 132-146. https://doi.org/10.1038/s41571-021-00560-7
[7] Lee, R.Y., Wu, Y., Goh, D., Tan, V., Ng, C.W., Lim, J.C.T., Lau, M.C., Yeong, J.P.S. (2023). Application of artificial intelligence to in vitro tumor modeling and characterization of the tumor microenvironment. Advanced Healthcare Materials. https://doi.org/10.1002/adhm.202202457
[8] Narotamo, H., Sanches, J.M., Silveira, M. (2019). Segmentation of cell nuclei in fluorescence microscopy images using deep learning. In Iberian Conference on Pattern Recognition and Image Analysis, Cham: Springer International Publishing, pp. 53-64. https://doi.org/10.1109/RBME.2016.2515127
[9] Xing, F., Yang, L. (2016). Robust nucleus/cell detection and segmentation in digital pathology and microscopy images: A comprehensive review. IEEE Review in Biomedical Engineering, 9: 234-263. https://doi.org/10.1109/RBME.2016.2515127
[10] Wen, J., Xu, Y., Li, Z., Ma, Z., Xu, Y. (2018). Inter-class sparsity based discriminative least square regression. Neural Networks, 102:36-47. https://doi.org/10.1016/j.neunet.2018.02.002
[11] Zhang, C., Xiao, X., Li, X., Chen, Y.J., Zhen, W., Chang, J., Liu, Z. (2014). White blood cell segmentation by color-space-based k-means clustering. Sensors, 14(9): 16128-16147. https://doi.org/10.3390/s140916128
[12] Liu, Z., Liu, J., Xiao, X., Yuan, H., Li, X., Chang, J., Zheng, C. (2015). Segmentation of white blood cells through nucleus mark watershed operations and mean shift clustering. Sensors, 15(9): 22561-22586. https://doi.org/10.3390/s150922561
[13] Mohapatra, S., Patra, D., Kumar, K. (2011). Blood microscopic image segmentation using rough sets. In Proceedings of the International Conference on Image Information Processing, Shimla, India, pp. 53-58. https://doi.org/10.1109/ICIIP.2011.6108977
[14] Salem, N.M. (2014). Segmentation of white blood cells from microscopic images using K-means clustering. In Proceedings of the National Radio Science Conference, Cairo, Egypt, pp. 371-376. https://doi.org/10.1109/NRSC.2014.6835098
[15] Biswas, S., Ghoshal, D. (2016). Blood cell detection using thresholding estimation based watershed transformation with Sobel filter in frequency domain. Procedia Computer Science, 89: 651-657. https://doi.org/10.1016/j.procs.2016.06.029.
[16] Ghosh, M., Das, D., Chakraborty, C., Ray, A.K. (2010). Automated leukocyte recognition using fuzzy divergence. Micron, 41: 840-846. https://doi.org/10.1016/j.micron.2010.04.017
[17] Chaira, T. (2014). Accurate segmentation of leukocyte in blood cell images using Atanassov’s intuitionistic fuzzy and interval type-II fuzzy set theory. Micron, 61: 1-8. https://doi.org/10.1016/j.micron.2014.01.004
[18] Arslan, S., Ozyurek, E., Gunduz Demir, C. (2014). A color and shape-based algorithm for segmentation of white blood cells in peripheral blood and bone marrow images. Cytometry, 85: 480-490. https://doi.org/10.1002/cyto.a.22457
[19] Gautam, A., Bhadauria, H. (2014). Classification of white blood cells based on morphological features. In 2014 International Conference on Advances in Computing, Communications and Informatics (ICACCI), Delhi, India, pp. 2363-2368. https://doi.org/10.1109/ICACCI.2014.6968362
[20] Fan, H., Zhang, F., Xi, L., Li, Z., Liu, G., Xu, Y. (2019). LeukocyteMask: An automated localization and segmentation method for leukocyte in blood smear images using deep neural networks. Journal of Biophotonics, 12(7): e201800488. https://doi.org/10.1002/jbio.201800488
[21] Agrawal, R., Satapathy, S., Bagla, G., Rajakumar, K. (2019). Detection of white blood cell cancer using image processing. In International Conference on Vision Towards Emerging Trends in Communication and Networking (ViTECoN), Vellore, India, pp. 1-6. https://doi.org/10.1109/ViTECoN.2019.8899602
[22] Banik, P.P., Saha, R., Ki-Doo, K. (2020). An automatic nucleus segmentation and CNN model-based classification method of white blood cell. Expert Systems with Applications, 149: 113211. https://doi.org/10.1016/j.eswa.2020.113211
[23] Cheuque, C., Querales, M., León, R., Salas, R., Torres, R. (2022). An efficient multi-level convolutional neural network approach for white blood cells classification. Diagnostics, 12: 248. https://doi.org/10.3390/diagnostics12020248
[24] Metlek, S. (2024). CellSegUNet: An improved deep segmentation model for the cell segmentation based on UNet++ and residual UNet models. Neural Computing & Applications, 36: 5799-5825. https://doi.org/10.1007/s00521-023-09374-3
[25] Alharbi, A.H., Aravinda, C.V., Lin, M., Venugopala, P.S., Reddicherla, P., Shah, M.A. (2022). Segmentation and classification of white blood cells using the UNet. Contrast Media & Molecular Imaging, 2022: 5913905. https://doi.org/10.1155/2022/5913905
[26] Das, S.K., Islam, K.S., Neha, T.A., Khan, M.M., Bourouis, S. (2021). Towards the segmentation and classification of white blood cell cancer using hybrid mask-recurrent neural network and transfer learning. Contrast Media & Molecular Imaging, 2021: 4954854. https://doi.org/10.1155/2021/4954854
[27] Afshin, B., Reza, A., Eman, S., Alaa, S. (2021). Multi-scale regional attention Deeplab3+: Multiple myeloma plasma cells segmentation in microscopic images. In Proceedings of the MICCAI Workshop on Computational Pathology, Proceedings of Machine Learning Research, 156: 47-56. https://proceedings.mlr.press/v156/afshin21a.html.
[28] Xia, X., Xu, C., Nan, B. (2017). Inception-v3 for flower classification. In 2017 2nd International Conference on Image, Vision and Computing (ICIVC), Chengdu, China, pp. 783-787. https://doi.org/10.1109/ICIVC.2017.7984661
[29] Kundu, T.K., Anguraj, D.K., Bhattacharyya, D. (2024). Utilizing image analysis with machine learning and deep learning to identify malaria parasites in conventional microscopic blood smear images. Traitement du Signal, 41(1): 343-362. https://doi.org/10.18280/ts.410129
[30] Yildirim, M., Çinar, A. (2019). Classification of white blood cells by deep learning methods for diagnosing disease. Revue d'Intelligence Artificielle, 33(5): 335-340. https://doi.org/10.18280/ria.330502
[31] Çinar, A., Yildirim, M. (2020). Classification of malaria cell images with deep learning architectures. Ingénierie des Systèmes d’Information, 25(1): 35-39. https://doi.org/10.18280/isi.250105
[32] Malech, H.L., DeLeo, F.R., Quinn, M.T. (2014). The role of neutrophils in the immune system: an overview. Neutrophil Methods and Protocols, 1124: 3-10. https://doi.org/10.1007/978-1-62703-845-4_1
[33] Lam, X.H., Ng, K.W., Yoong, Y.J., Ng, S.B. (2021). WBC-based segmentation and classification on microscopic images: A minor improvement. F1000Res, 10: 1168. https://doi.org/10.12688/f1000research.73315.1
[34] Zheng, X., Wang, Y., Wang, G., Liu, J. (2018). Fast and robust segmentation of white blood cell images by self-supervised learning. Micron, 107: 55-71. https://doi.org/10.1016/j.micron.2018.01.010
[35] Ronneberger, O., Fischer, P., Brox, T. (2015). U-Net: Convolutional networks for biomedical image segmentation. MICCAI, LNCS, 9351: 234-241. https://doi.org/10.1007/978-3-319-24574-4_28
[36] He, X., Zhang, S., Ren, S., Sun, J. (2016). Deep residual learning for image recognition. In IEEE Conference on Computer Vision and Pattern Recognition (CVPR), 770: 778. https://doi.org/10.1109/CVPR.2016.90
[37] Huang, L., Miron, A., Hone, K., Li, Y. (2024). Medical images: From UNet to Res-UNet and nnUNet. arXiv. https://doi.org/10.48550/arXiv.2407.04353
[38] Karasu Benyes, Y., Welch, E.C., Singhal, A., Ou, J., Tripathi, A. (2022). A comparative analysis of deep learning models for automated cross-preparation diagnosis of multi-cell liquid Pap smear images. Diagnostics, 12(8): 1838. https://doi.org/10.3390/diagnostics12081838
[39] He, K., Zhang, X., Ren, S., Sun, J. (2015). Delving deep into rectifiers: Surpassing human-level performance on ImageNet classification. In IEEE International Conference on Computer Vision (ICCV), Santiago, Chile, pp. 1026-1034. https://doi.org/10.1109/ICCV.2015.123
[40] Maas, A.L., Hannun, A.Y., Ng, A.Y. (2013). Rectifier nonlinearities improve neural network acoustic models. In Proceedings of the 30th International Conference on Machine Learning, Atlanta, Georgia, USA.
[41] Lam, X.H., Ng, K.W., Yoong, Y.J., Ng, S.B. (2021). WBC-based segmentation and classification on microscopic images: A minor improvement. F1000Res, 10: 1168. https://doi.org/10.12688/f1000research.73315.1
[42] Nitish, S., Hinton, G.E., Krizhevsky, A., Srivastava, N., Salakhutdinov, R. (2014). Dropout: A simple way to prevent neural networks from overfitting. Journal of Machine Learning Research, 15: 1929-1958.