Ahmad Abdul Chamid*![]() | Widowati
| Widowati![]() | Retno Kusumaningrum
| Retno Kusumaningrum![]()
© 2024 The authors. This article is published by IIETA and is licensed under the CC BY 4.0 license (http://creativecommons.org/licenses/by/4.0/).
OPEN ACCESS
Classification is part of machine learning, and developing it requires labeled data. Most data is available in an unlabeled form. Data labeling is a step that researchers must take. Good labeled data will produce a good classification model. The data labeling process cannot be ignored and needs to be done carefully and consistently. Because the classification process requires well-labeled data that can be accounted for. In addition, good labeled data will produce a good classification model. The role of an expert (rater) is needed to label the data and ideally at least two experts. However, involving two raters will become a new problem because it is likely that the results of the inter-rater labeling will be different. We propose the Cohen Kappa method to overcome this problem. We used data from scraping user reviews of the Indonesian marketplace, there were 4.307. Based on the calculation results, Kappa=0.909 for aspect detection, Kappa=0.893 for sentiment classification, and Kappa=0.971 for class aspect. Based on the kappa value, the labeling results for aspect detection, sentiment classification and aspect class were declared "almost perfect agreement", so that the results of this research obtained labeled data that can be used for classification tasks, especially for developing aspect-based sentiment analysis models.
labeling multi-label data, aspect-based sentiment analysis, consistency test, Cohen Kappa, classification
Machine learning has developed very rapidly [1-4]. The process of developing machine learning can use several approaches. Each approach can be applied according to the research domain being worked on. The supervised learning approach is known as the machine learning development process, which requires labeled data [5-7], while unsupervised learning is without labeled data [8-10]. Supervised learning is applied to develop classification models and requires labeled data. In general, data that is easy to obtain is in unlabeled form, which challenges researchers to label data. Actually, to overcome the difficulty of getting labeled data, a semi-supervised learning approach can be applied using a little labeled data and a lot of unlabeled data [11-13]. Labeled data is still needed for semi-supervised learning even though the percentage is less, so researchers cannot ignore the data labeling process.
There are three classification categories: single-label, multi-class, and multi-label classifications [14, 15]. Each category has uses according to the research domain being carried out. The difficulty level of multi-class and multi-label requires extra effort in the labeling process. An example of using multi-labels is aspect-based sentiment analysis (ABSA), generally used to obtain in-depth information from reviews. The detailed information extracted is in the form of aspect detection and sentiment classification. Meanwhile, a single label is used for sentiment analysis at the sentence or document level [16, 17]. ABSA uses multi-labels to identify aspect and sentiment classifications. So that in the multi-label labeling process, accuracy, consistency, and more time allocation are needed.
The multi-label data labeling process is very important because, with a good process, it is hoped that a good classification model will be obtained [14, 18, 19]. Therefore, a competent expert is required to perform data labeling. Data labeling ideally involves a minimum of two experts (raters) so that a comparison can be obtained from the results that have been carried out. Involving two or more experts will be a problem because it is likely that the labeling results from each expert will be different. The Cohen Kappa method can be used to overcome this problem by conducting an inter-rater consistency test [20, 21].
The Cohen kappa method has been used to measure ordinal multi-class classification performance [22]. Measuring classification performance on ordinal classifiers with unbalanced data composition is a challenge for researchers. Therefore it is necessary to apply the confusion matrix, Cohen Kappa, and Matthews correlation coefficient (MCC). A total of 40 datasets with multiple ordinal from various fields, including social sciences (16), life sciences (13), engineering (4), and other fields (7). Based on the results of classification performance measurements, it is known that MCC is able to outperform the confusion matrix and Cohen kappa [23]. Cohen Kappa was also considered suitable for measuring consistency between raters [22]. Cohen kappa is a descriptive statistic used to measure agreement between two raters [24]. According to [25], under certain conditions, the k-statistic is affected by two paradoxes, resulting in a biased estimate of the statistic itself. However, many researchers do not consider this paradox when they interpret the coefficients. Cohen kappa can be used to reduce bias and the amount of time required in the process of selecting studies. The feasibility of this iterative process was demonstrated in tertiary studies in software engineering. Cohen kappa can be utilized by researchers and students in the process of selecting studies when conducting SLRs and can reduce the bias and time required. In addition, research with few resources can be used [25]. Labeled data is used for classification tasks. Data labeling processes and consistency tests must be carried out before the classification task. The data labeling process needs to involve experts, because expert knowledge will ensure that data labeling can be done correctly. If the data labeling process is carried out haphazardly, it will definitely result in poor classification results. Some classification tasks whose results are not good can be influenced by the data labeling process and other possibilities [26]. However, based on a good data labeling process, it has been proven to produce good classification [27, 28]. So in this research, a data labeling process and consistency test were carried out using the Cohen Kappa method, to obtain good labeled data that can be used for classification tasks, especially aspect-based sentiment analysis. The related research is explained in detail in Section 2, the research stages are presented in Section 3, the results and discussion of the research are presented in Section 4, the conclusions and further research are explained in Section 5.
Previous research by Rau and Shih [29] applied the Cohen kappa method for the genre and nominal data analysis. The Cohen-kappa method is used to measure agreement or reliability inter-rater. Besides that, it is stated that Kappa can be used for macro or corpus structure analysis, and Kappa is not suitable for movement or component analysis. Cohen kappa is used for summative and normative analysis, first determining the inter-rater reliability (IRR) or inter-rater agreement (IRA) for genre analysis. Furthermore, trials of various methods of genre analysis on the nature of the rater, units, and categories to determine the possibility of a valid test. The statistical measures (units and agreements) to be used must be clearly stated in order to get a clear picture and correct results.
Marlas et al. [30] used Cohen Kappa in the health sector diagnosing diseases suffered by neurological patients. A retrospective approach was used to evaluate the oligoclonal immunoglobulin bands (OCB) and K-index in 274 patients. The strategies used by categorizing the K-index include negative/low (<3.3), moderate (3.3-9.1), high (9.1-55), and very high (>55). Based on the trial results, it was stated that the K-index could be used for the diagnosis of multiple sclerosis (MS) as well as in clinically isolated syndrome (CIS) patients, besides that it could help evaluate the possibility of a patient being diagnosed with MS before starting therapy. The categories on the K-index can be adjusted according to needs and must be based on consensus recommendations from experts [30]. Cohen kappa was also used to assess the predictive coefficient of soil fertility class categories. Cohen Kappa proposed evaluating intra-rater reliability (IRRs) between two raters and using weighted Kappa to calculate the IRR. It was stated that the Cohen Kappa method could be used to evaluate IRR [31].
The Cohen kappa method has been used for Inter Annotator Agreement based on Twitter data analysis [32]. Until now, the Cohen Kappa method is still relevant for testing inter-rater consistency, especially for the domain of text data annotation which requires understanding from an expert (rater). Previous research annotated/labeled data from Twitter with therapeutic keywords, the data obtained was reviewed manually, and created an annotation guide to categorize the posts as positive, neutral or negative. The Cohen Kappa method was used for inter-annotation agreement. The results were in the form of a labeled dataset that could used for classification tasks and aspect-level sentiment analysis [33].
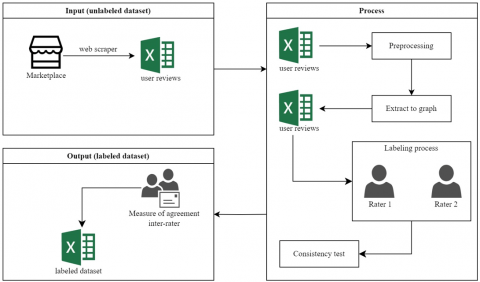
In this study, we used Python programming and SPSS 26 tools. The proposed research stages are shown in Figure 1. More details are explained.
3.1 Input
This research uses a dataset obtained from the Indonesian marketplace in the form of product reviews. Data were obtained by scraper using Chrome Extensions Web Scraper. The data is in the form of a file with the .csv extension and is dirty.
3.2 Process
Preprocessing is used to clean the dataset. The preprocessing process uses stages (case folding, stop-word removal, stemming, tokenization, padding, and vectorization) [34]. Next, we extract the data to the graph using the stanza library dependency graph (http://stanza.run/(accessed on 9 March 2023). After going through the extraction stage, 4.307 data were obtained. The next stage was data labeling involving two linguists (raters). Each rater is given the same dataset to carry out labeling independently and can be accounted for.
The Cohen kappa method is used to test consistency between assessors as in Eq. (1) [25, 35], and Table 1 is the interpretation of k values [36].
$k=\frac{\operatorname{Pr}(a)-\operatorname{Pr}(e)}{1-\operatorname{Pr}(e)}$ (1)
Pr(a)=percentage of the number of measurements that are consistent between raters.
Pr(e)=percentage of the number of measurement changes between raters.
3.3 Output
The results of the consistency test between raters serve as a guideline for stating that labeled data can be agreed to be used for further research. An example of a labeled dataset is shown in Table 2.
Figure 1. Proposed research methods
Table 1. Interpretation of k values
|
Kappa Statistic |
Strength of Agreement |
|
<0.00 |
Poor |
|
0.00–0.20 |
Slight |
|
0.21–0.40 |
Fair |
|
0.41–0.60 |
Moderate |
|
0.61–0.80 |
Substantial |
|
0.81–1.00 |
Almost Perfect |
Table 2. An example of a labeled dataset
|
Reviews |
Aspect |
Opinion |
True Tuple |
Sentiment |
Class Aspect |
|
Penjual responsif warna kusam pengiriman lambat (Responsive seller, dull color, slow delivery) |
Penjual (seller) |
Responsif (Responsive) |
1 |
1 |
Pelayanan (Service) |
|
Penjual responsif warna kusam pengiriman lambat |
Warna (color) |
Kusam (dull) |
1 |
– 1 |
Warna (Color) |
|
Penjual responsif warna kusam pengiriman lambat |
Pengiriman (delivery) |
Lambat (slow) |
1 |
– 1 |
Pengiriman (Courier) |
Table 2 explains that the review, aspect, and opinion columns are generated from the code we developed using Python programming. The task of the raters is to fill in the true tuple, sentiment, and class aspects columns. Raters can fill the true tuple column with 1=aspect and 0=not aspect. The sentiment column is filled with 1=positive sentiment, – 1=negative sentiment, and 0=non sentiment. Aspect class fields can be populated with material (bahan), size (ukuran), color (warna), sewing (jahitan), quality (kualitas), price (harga), delivery (pengiriman), and service (pelayanan).
The consistency test using the Cohen Kappa method was carried out according to the assessment results in the raters had carried out. The three columns of true tuple (aspect detection), sentiment (sentiment classification), and class aspect that each rater has filled in will be tested for consistency.
4.1 Aspect detection
We do a consistency test for the true tuple column in aspect detection. The results are shown in Table 3.
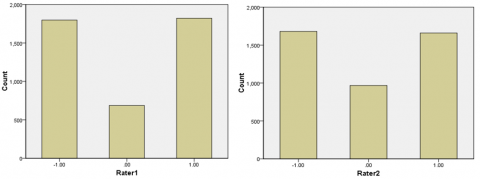
Based on Table 3, it can be seen that there were 654 data labeled as non-aspect by Rater1 and Rater2. A total of 106 data were labeled as aspect by Rater1 and labeled as non-aspect by Rater2. A total of 3.556 data is labeled aspect by Rater1 and Rater2. The total data labeled as non-aspect by Rater1 is 645, and 3.662 are labeled as aspect. The total data labeled as non-aspect by Rater2 is 751, and 3.556 are labeled as aspect. So that the total data that the raters have labeled is 4.307. The results are shown in Figure 2.
Figure 2. The results of labeling inter-raters for aspect detection
Table 3. Aspect detection crosstabulation
|
Count |
||||
|
|
Rater2 |
Total |
||
|
.00 |
1.00 |
|||
|
Rater1 |
.00 |
645 |
0 |
645 |
|
1.00 |
106 |
3556 |
3662 |
|
|
Total |
751 |
3556 |
4307 |
|
Table 4. The result of the measure of agreement from aspect detection
|
|
Value |
Asymptotic Standard Error |
Approximate T |
Approximate Significance |
|
|
Measure of Agreement |
Kappa |
0.909 |
0.009 |
59.933 |
.000 |
|
N of Valid Cases |
4307 |
|
|
|
|
Table 4 is the result of the calculation of the Cohen-kappa method, the value of Kappa=0.909. Based on the guidelines in Table 1, the aspect detection labeling carried out by the raters resulted in an almost perfect agreement. The kappa value is obtained from the Measure of Kappa Agreement value. The Kappa of 0.909 indicates almost perfect agreement between the raters for aspect detection.
4.2 Sentiment classification
We carry out a consistency test for the sentiment column in the sentiment classification, as shown in Table 5.
Table 5. Sentiment classification crosstabulation
|
Count |
|||||
|
|
Rater2 |
Total |
|||
|
-1.00 |
.00 |
1.00 |
|||
|
Rater1 |
-1.00 |
1669 |
129 |
0 |
1798 |
|
.00 |
2 |
685 |
0 |
687 |
|
|
1.00 |
9 |
153 |
1660 |
1822 |
|
|
Total |
1680 |
967 |
1660 |
4307 |
|
Based on Table 5, it can be seen that Rater1 and Rater2 labeled negative for 1.669 data, labeled positive for 1.660 data, and 685 labeled non-sentiment. There are 2 data labeled as non-sentiment by Rater1 and negatively labeled by Rater2. 9 data labeled positive by Rater1 and labeled negative by Rater2. 129 data labeled as non-sentiment by Rater2 and negatively labeled by Rater1. There are 153 data labeled as non-sentiment by Rater2 and positive by Rater1. A total of 1.798 data are labeled negative, 1.822 data are labeled positive, and 687 are labeled non-sentiment by Rater1. A total of 1.680 data are labeled negative, 1.660 data are labeled positive, and 967 data are labeled non-sentiment by Rater2. So that the total data that the raters have labeled is 4.307. The results are shown in Figure 3.
Table 6 is the result of the calculation of the Cohen-kappa method, the value of Kappa=0.893. Based on the guidelines in Table 1, the raters sentiment classification labeling resulted in an almost perfect agreement. The kappa value is obtained from the Measure of Kappa Agreement value. The Kappa of 0.893 indicates almost perfect agreement between the raters for sentiment classification.
4.3 Class aspect
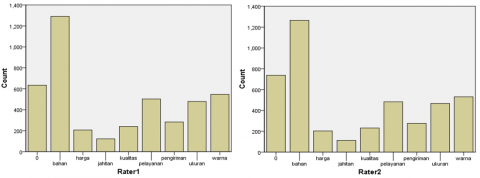
We did a consistency test for the class aspect column. The results are shown in Table 7. Based on Table 7, it can be seen that Rater1 and Rater2 labeled materials for 1.265 data, labeled prices for 203 data, labeled sewing for 113 data, labeled quality for 232 data, labeled service for 483 data, labeled delivery for 276 data, labeled size for 467 data, labeled color for 531 data, and 634 labeled non-aspect. There are 26 data labeled as material by Rater1 and non-aspect labeled by Rater2. There are 4 data labeled as price by Rater1 and non-aspect by Rater2. There are 10 data labeled as sewing by Rater1 and non-aspect by Rater2. There are 8 data labeled as quality by Rater1 and non-aspect by Rater2. There are 20 data labeled as service by Rater1 and non-aspect by Rater2. There are 7 data labeled as delivery by Rater1 and non-aspect by Rater2. There are 12 data labeled as size by Rater1 and non-aspect by Rater2. There are 16 data labeled in color by Rater1 and non-aspect labeled by Rater2. So the total data labeled by raters is 4.307, as shown in Figure 4.
Table 8 is the result of the calculation of the Cohen-kappa method, the value of Kappa=0.971. Based on the guidelines in Table 1, the class aspect labeling carried out by the raters resulted in an almost perfect agreement. The kappa value is obtained from the Measure of Kappa Agreement value. The Kappa of 0.971 indicates almost perfect agreement between the raters for class aspect.
Table 6. The result of the measure of agreement from sentiment classification
|
|
Value |
Asymptotic Standard Errora |
Approximate Tb |
Approximate Significance |
|
|
Measure of Agreement |
Kappa |
0.893 |
0.006 |
80.630 |
.000 |
|
N of Valid Cases |
4307 |
|
|
|
|
Table 7. Class aspect crosstabulation
|
Count |
|||||||||||
|
|
Rater2 |
Total |
|||||||||
|
0 |
Bahan |
Harga |
Jahitan |
Kualitas |
Pelayanan |
Pengiriman |
Ukuran |
Warna |
|
||
|
Rater1 |
0 |
634 |
0 |
0 |
0 |
0 |
0 |
0 |
0 |
0 |
634 |
|
bahan |
26 |
1265 |
0 |
0 |
0 |
0 |
0 |
0 |
0 |
1291 |
|
|
harga |
4 |
0 |
203 |
0 |
0 |
0 |
0 |
0 |
0 |
207 |
|
|
jahitan |
10 |
0 |
0 |
113 |
0 |
0 |
0 |
0 |
0 |
123 |
|
|
kualitas |
8 |
0 |
0 |
0 |
232 |
0 |
0 |
0 |
0 |
240 |
|
|
pelayanan |
20 |
0 |
0 |
0 |
0 |
483 |
0 |
0 |
0 |
503 |
|
|
pengiriman |
7 |
0 |
0 |
0 |
0 |
0 |
276 |
0 |
0 |
283 |
|
|
ukuran |
12 |
0 |
0 |
0 |
0 |
0 |
0 |
467 |
0 |
479 |
|
|
warna |
16 |
0 |
0 |
0 |
0 |
0 |
0 |
0 |
531 |
547 |
|
|
Total |
737 |
1265 |
203 |
113 |
232 |
483 |
276 |
467 |
531 |
4307 |
|
Table 8. The result of the measure of agreement from a class aspect
|
|
Value |
Asymptotic Standard Errora |
Approximate Tb |
Approximate Significance |
|
|
Measure of Agreement |
Kappa |
0.971 |
0.003 |
153.616 |
0.000 |
|
N of Valid Cases |
4307 |
|
|
|
|
Figure 3. The results of labeling inter-raters for sentiment classification
Figure 4. The results of labeling inter-raters for class aspect
Table 9. The overall results of the kappa value
|
Tasks |
Kappa Value |
|
Aspect detection |
0.909 |
|
Sentiment classification |
0.893 |
|
Class aspect |
0.971 |
The kappa value for the class aspect is the highest compared to aspect detection and sentiment classification as shown in Table 9. There are several possibilities that influence the kappa value, for example the data presented to the rater is difficult to read or understand (not yet through preprocessing), the labeling guidelines are unclear, the labeling categories are not yet understood by the rater, and it is possible that the scientific fields between the raters are different. The existence of differences between raters is normal, but if the kappa value is too small, it indicates that the possibilities mentioned above have been experienced. Therefore, the data presentation process, labeling guidelines and discussions between raters and researchers need to be carried out before labeling the data.
Especially for the class aspect, it produces the highest kappa value because there are no significant differences in labels from the raters. The raters are firm and consistent in labeling the class aspect column. In addition, the data presented by researchers has gone through preprocessing and sentence extraction, making it quite easy for raters to read and understand.
Looking at the overall kappa value, it is known that this study obtained better kappa results than previous studies [32], In addition, the kappa value obtained from this study is superior to that [33]. So the labeling results in the form of a dataset can be used for classification tasks, especially to develop the ABSA model, and we have used these results to develop the Indonesian ABSA model with good performance results [27].
This study has applied the Cohen Kappa method for inter-rater consistency tests. A total of 4.307 data were obtained from scraper results from reviews of the Indonesian online marketplace. Data preprocessing is used to clean, and graph extraction is used to simplify the labeling process. We involve two linguists to do the labeling. Inter-rater labeling was tested for consistency, and the calculation results obtained Kappa=0.909 for aspect detection, kappa=0.893 for sentiment classification, and kappa=0.971 for class aspect. Based on the measure of agreement theory, the labeling results are stated to be almost perfect agreement. It is important to get perfect consistency test results, because labeled data will be used for classification tasks, with a good dataset it is likely that you will get classification results with good performance. The challenges experienced in this research include the process of determining raters who must be experts in their field, discussing data with the raters, creating guidelines and agreements between raters. Researchers experienced limitations with the amount of data obtained and it only came from one marketplace. However, the results of this research can be used for classification tasks and in particular developing aspect-based sentiment analysis models. Future research can develop review data annotation with a larger amount of data sourced from various marketplaces and can apply the results of this research to various classification tasks.
This work is supported by Post Graduate Research Grant with contract number 345-25/UN7.D2/PP/IV/2023. This research was supported by the Laboratory of Computer Modelling, Faculty of Science and Mathematics, Diponegoro University, Semarang, Indonesia.
[1] Jamaleddyn, I., Biniz, M. (2023). An improved approach to Arabic news classification based on hyperparameter tuning of machine learning algorithms. Journal of Engineering Research, 11(2): 100061. https://doi.org/10.1016/j.jer.2023.100061
[2] Balakrishnan, V., Kehrabi, Y., Ramanathan, G., Paul, S.A., Tiong, C.K. (2023). Machine learning approaches in diagnosing tuberculosis through biomarkers-A systematic review. Progress in Biophysics and Molecular Biology, 179: 16-25. https://doi.org/10.1016/j.pbiomolbio.2023.03.001
[3] Tan, C., Ardanese, R., Huemiller, E., Cai, W., Yang, H., Bracey, J., Pozzato, G. (2023). Data-driven battery electrode production process modeling enabled by machine learning. Journal of Materials Processing Technology, 316: 117967. https://doi.org/10.1016/j.jmatprotec.2023.117967
[4] Soori, M., Arezoo, B., Dastres, R. (2023). Machine learning and artificial intelligence in CNC machine tools, A review. Sustainable Manufacturing and Service Economics, 2: 100009. https://doi.org/10.1016/j.smse.2023.100009
[5] Xie, S., Hou, C., Yu, H., Zhang, Z., Luo, X., Zhu, N. (2022). Multi-label disaster text classification via supervised contrastive learning for social media data. Computers and Electrical Engineering, 104: 108401. https://doi.org/10.1016/j.compeleceng.2022.108401
[6] Kim, M.S., Lim, B.Y., Shin, H.S., Kwon, H.Y. (2023). Historical credibility for movie reviews and its application to weakly supervised classification. Information Sciences, 630: 325-340. https://doi.org/10.1016/j.ins.2023.01.138
[7] Hao, S., Wang, Z., Alexander, A.D., Yuan, J., Zhang, W. (2023). MICOS: Mixed supervised contrastive learning for multivariate time series classification. Knowledge-Based Systems, 260: 110158. https://doi.org/10.1016/j.knosys.2022.110158
[8] Chullamonthon, P., Tangamchit, P. (2023). Ensemble of supervised and unsupervised deep neural networks for stock price manipulation detection. Expert Systems with Applications, 220: 119698. https://doi.org/10.1016/j.eswa.2023.119698
[9] He, L., Du, H., Fu, Y., Ye, Y. (2023). Multiple camera styles learning for unsupervised person re-identification. Optik, 277: 170718. https://doi.org/10.1016/j.ijleo.2023.170718
[10] Zipfel, J., Verworner, F., Fischer, M., Wieland, U., Kraus, M., Zschech, P. (2023). Anomaly detection for industrial quality assurance: A comparative evaluation of unsupervised deep learning models. Computers & Industrial Engineering, 177: 109045. https://doi.org/10.1016/j.cie.2023.109045
[11] Yan, M., Hui, S.C., Li, N. (2023). DML-PL: Deep metric learning based pseudo-labeling framework for class imbalanced semi-supervised learning. Information Sciences, 626: 641-657. https://doi.org/10.1016/j.ins.2023.01.074
[12] Alwindawi, A.F., Uçan, O.N., Ibrahim, A.A., Abbas, S.A. (2022). Semi-Supervised learning with ensemble deep learning networks for descriptor generation. Optik, 170450. https://doi.org/10.1016/j.ijleo.2022.170450
[13] Ma, J., Yu, G., Xiong, W., Zhu, X. (2023). Safe semi-supervised learning for pattern classification. Engineering Applications of Artificial Intelligence, 121: 106021. https://doi.org/10.1016/j.engappai.2023.106021
[14] Abdullahi, A., Samsudin, N.A., Rahim, M.H.A., Khalid, S.K.A., Efendi, R. (2021). Multi-label classification approach for Quranic verses labelling. Indonesian Journal of Electrical Engineering and Computer Science, 24(1): 484-490. https://doi.org/10.11591/ijeecs.v24.i1.pp484-490
[15] Shimpi, J.K., Shanmugam, P. (2023). Multiclass adaptive boosting approach for diabetic retinopathy prediction using diabetic retinal images. Traitement du Signal, 40(3): 1065-1073, https://doi.org/10.18280/ts.400322
[16] Tripathi, J., Tiwari, S., Saini, A., Kumari, S. (2023). Prediction of movie success based on machine learning and twitter sentiment analysis using internet movie database data. Indonesian Journal of Electrical Engineering and Computer Science, 29(3): 1750-1757. https://doi.org/10.11591/ijeecs.v29.i3.pp1750-1757
[17] Bhamare, B.R., Prabhu, J. (2021). A multilabel classifier for text classification and enhanced bert system. Revue d'Intelligence Artificielle, 35(2): 167-176, https://doi.org/10.18280/ria.350209
[18] Haw, S.C., Amin, A., Subramaniam, S. (2020). ORD-GAP: A hybrid-based labeling schemes to support XML dynamic updates. Indonesian Journal of Electrical Engineering and Computer Science, 18(3): 1596-1606.
[19] Ahmed, M.Z., Mahesh, C. (2021). A weight based labeled classifier using machine learning technique for classification of medical data. Revue d'Intelligence Artificielle, 35(1): 39-46, https://doi.org/10.18280/ria.350104
[20] Warrens, M.J. (2012). Equivalences of weighted kappas for multiple raters. Statistical Methodology, 9(3): 407-422. https://doi.org/10.1016/j.stamet.2011.11.001
[21] Harbouche, K., Khentout, C., Djoudi, M., Alti, A. (2023). Measuring similarity of educational items using data on learners’ performance and behavioral parameters: application of new models scnn-cosine and fuzzy-kappa. Ingenierie des Systemes d'Information, 28(1): 1-11, https://doi.org/10.18280/isi.280101
[22] Yilmaz, A.E., Demirhan, H. (2023). Weighted kappa measures for ordinal multi-class classification performance. Applied Soft Computing, 134: 110020. https://doi.org/10.1016/j.asoc.2023.110020
[23] Chicco, D., Jurman, G. (2020). The advantages of the Matthews correlation coefficient (MCC) over F1 score and accuracy in binary classification evaluation. BMC Genomics, 21(1): 1-13. https://doi.org/10.1186/s12864-019-6413-7
[24] Warrens, M.J. (2012). A family of multi-rater kappas that can always be increased and decreased by combining categories. Statistical Methodology, 9(3): 330-340. https://doi.org/10.1016/j.stamet.2011.08.008
[25] Pérez, J., Díaz, J., Garcia-Martin, J., Tabuenca, B. (2020). Systematic literature reviews in software engineering-Enhancement of the study selection process using Cohen’s kappa statistic. Journal of Systems and Software, 168: 110657. https://doi.org/10.1016/j.jss.2020.110657
[26] Thirumoorthy, K., Muneeswaran, K. (2021). Feature selection using hybrid poor and rich optimization algorithm for text classification. Pattern Recognition Letters, 147: 63-70. https://doi.org/10.1016/j.patrec.2021.03.034
[27] Chamid, A.A., Widowati, Kusumaningrum, R. (2022). Graph-Based semi-supervised deep learning for indonesian aspect-based sentiment analysis. Big Data and Cognitive Computing, 7(1): 5. https://doi.org/10.3390/bdcc7010005
[28] Chamid, A.A., Widowati, D., Kusumaningrum, R. (2023). Multi-Label text classification on Indonesian user reviews using semi-supervised graph neural networks. ICIC Express Letters, 17(10): 1075-1084. https://doi.org/10.24507/icicel.17.10.1075
[29] Rau, G., Shih, Y.S. (2021). Evaluation of Cohen's kappa and other measures of inter-rater agreement for genre analysis and other nominal data. Journal of English for Academic Purposes, 53: 101026. https://doi.org/10.1016/j.jeap.2021.101026
[30] Marlas, M., Bost, C., Dorcet, G., Delourme, A., Biotti, D., Ciron, J., Renaudineau, Y., Puissant-Lubrano, B. (2022). Kappa-index: Real-life evaluation of a new tool for multiple sclerosis diagnosis. Clinical Immunology, 241: 109066. https://doi.org/10.1016/j.clim.2022.109066
[31] Li, M., Li, Z., Yu, T. (2023). Statistical issues. Comment on “proximal sensor data fusion for tropical soil property prediction: Soil fertility properties”. Journal of South American Earth Sciences, 124: 104282. https://doi.org/10.1016/j.jsames.2023.104282
[32] Guzmán-Monteza, Y. (2023). Assessment of an annotation method for the detection of spanish argumentative, non-argumentative, and their components. Telematics and Informatics Reports, 11: 100068. https://doi.org/10.1016/j.teler.2023.100068
[33] Guo, Y., Das, S., Lakamana, S., Sarker, A. (2023). An aspect-level sentiment analysis dataset for therapies on Twitter. Data in Brief, 50: 109618. https://doi.org/10.1016/j.dib.2023.109618
[34] Jayanto, R., Kusumaningrum, R., Wibowo, A. (2022). Aspect-based sentiment analysis for hotel reviews using an improved model of long short-term memory. International Journal of Advances in Intelligent Informatics, 8(3): 391-403. https://doi.org/10.26555/ijain.v8i3.691
[35] Bujang, M.A., Baharum, N. (2017). Guidelines of the minimum sample size requirements for Kappa agreement test. Epidemiology, Biostatistics, and Public Health, 14(2): 1-10. https://doi.org/10.2427/12267
[36] Landis, J.R., Koch, G.G. (1977). The measurement of observer agreement for categorical data. Biometrics, 33(1): 159-174. https://doi.org/10.2307/2529310