Fauzan Masykur*![]() | Kusworo Adi
| Kusworo Adi![]() | Oky Dwi Nurhayati
| Oky Dwi Nurhayati![]()
© 2024 The authors. This article is published by IIETA and is licensed under the CC BY 4.0 license (http://creativecommons.org/licenses/by/4.0/).
OPEN ACCESS
This paper discusses the use of drones in image acquisition of agricultural land to detect the presence of disease and calculate the area of infected agriculture. Calculation of the area of infected and healthy areas will be calculated by combining the You Only Look Once (Yolo) object detection algorithm version 4 with the ArUco Marker reference image. The image resulting from the detection from the Yolo v4 algorithm will be used as a reference to be referenced using a reference image in the form of an AruCo Marker to convert it to area units to determine the area of the infected area and calculate the ratio between the area of the infected area and the area of the healthy area. The coordinate points at each corner are used as the first stage in converting pixels into area units. Measuring the infected area is necessary to localize the infection so that it does not spread to healthy plant areas. Apart from that, to anticipate the spread of infection which could result in crop failure. Evaluation of the calculation of the area of the detection area with the actual area resulted in an accuracy of 97.05%.
Yolo v4, ArUco marker, reference image, object detection, drone image
Drones, also known as unmanned vehicles [1], can be used in various sectors of life. Drone design depends on needs which include form, function, and supporting features [2]. One of the benefits of drones is taking photos of agricultural land to analyze crop conditions, including whether there are pest and disease attacks, area size, plant growth, remote sensing, mapping [3], and fertilizing or spraying [4-7]. The various advantages of using drones in agriculture make drones the newest tool for monitoring plant growth. Drone cameras produce high-resolution images better than aerial photography taken from airplanes. Drones are capable of cutting low so that the image results are not affected by clouds and the image resolution is obtained from a high-definition camera with a distance of only centimeters [6].
The benefits derived from the use of drones in the agricultural sector are the results of drone camera images used in analyzing crop development. Especially in this research, the plant as an object of research is the rice plant because rice is a source of raw material for rice, which is a staple food for 75% of the world's population [8]. The large dependence of the world's population on rice consumption requires breakthroughs in monitoring the sustainability of rice production. Conventionally, monitoring of rice plants is carried out periodically by farmers so that if there is an attack of pests and diseases, it can be detected earlier [9, 10]. Agricultural technology is felt to replace farmers’ role in monitoring plant growth with Artificial Intelligence (AI). The existence of AI can change the paradigm of agriculture to become more modern with a touch of the latest technology [11].
The resulting image from the drone camera is used as a dataset as input in detecting the presence of diseases in rice plants. The You Only Look Once (Yolo) object detection algorithm version 4 was developed by inserting an additional algorithm to convert image pixel values into units of length (meters). Yolo works by detecting objects into a single regression problem which makes computational complexity lighter [12].
The presence of disease in rice plants can interfere with growth which can result in losses and even cause crop failure. therefore, speed and accuracy in disease detection in rice plants are necessary to avoid further losses. AI makes it possible to replace the role of farmers or agricultural extension workers in terms of monitoring but direct monitoring is still needed as a comparison [9, 10, 13, 14].
The proposed in this paper consists of 2 interrelated parts, namely:
Yolo has capabilities in fast detection [6, 15] but has shortcomings in precision. Object detection algorithms have been widely applied in various fields including vehicle detection [16, 17], objects [6, 18], plant diseases [13, 19, 20], health [21, 22], housing [23], road damage [24], natural disasters [25, 26] to weapons detection [27]. Currently, Yolo is the most popular object detection method due to its accuracy and speed, but one of its shortcomings is the dataset used. The MS COCO dataset is used as input because the MS COCO dataset is not too complex.
In research conducted by Tan et al. [6], the images as a dataset used images from UAV (Unmanned Aerial Vehicle) cameras which had problems with complex backgrounds, small targets, and mutual occlusion detection, causing the Yolo v4 to be unable to detect accurately, resulting in detection errors and missed detection. Thus, the utilization of hollow convolution serves the purpose of sampling image data, aiming to enhance both feature extraction and target detection performance.
The ultra-lightweight subspace attention mechanism (ULSAM) is used to obtain multi-scale representation feature maps. Then the third stage of Li Tan, et al research is the soft-NMS (Soft Non-Maximum Suppression) process to minimize the occurrence of target errors due to occlusion. The results obtained were an increase in detection of 5% from Yolo v4. Thus, the yolov4_drone detection model proposed by Li Tan, et al shows an increase in the effectiveness of target detection.
The remote sensing method using UAV was also carried out by Bao et al. [20] with the object of disease in tea plants, namely Tea Leaf Blight (TLB). Proper and accurate monitoring and handling can help control disease which affects the yield and quality of tea. This research proposes a remote sensing method using a UAV based on DDMA-Yolo to monitor and detect the presence of TLB which results in a lighter workload and more efficient time. The image of the tea plant was reconstructed using RCAN to overcome the resolution of the UAV image. The retinex method was chosen to increase image contrast and reduce uneven illumination. DDMA-Yolo mode was developed to improve TLB monitoring accuracy and the base model of DDMA-Yolo is Yolo v5. The results of the experiments show improvements over traditional detection models (Fast R-CNN, SSD, RetinaNet, Yolov3, Yolov4, and Yolov5). Average Precision (AP) increased by 3.8% and recall increased by 6.5%.
Research on object detection was also carried out by Qiu and Lau [23] with the research object of quality detection on sidewalk tiles. Monitoring sidewalk tiles is very tiring if done manually because tile cracks are too difficult to identify and take longer. Yolo integration of UAV camera images is proposed to achieve crack detection in tiled sidewalks. The architecture of several object detection algorithms was rearranged to compare the accuracy and detection speed results. The architectures in question are Yolov2‐tiny, Yolov2 based on Darknet19, Yolov2 based on ResNet50, Yolov3, and Yolov4‐tiny. The research results show that Resnet-based Yolov2 and Yolov4-tiny obtained the best accuracy results, namely 94.54% and 91.74% and detection speeds of 71.71 fps and 108.93 fps and could detect small cracks in sidewalk tiles. The ability to adapt to external factors is also a separate note from Qiwen and Lau's research, namely adaptation to rain, shadows, and camera condition factors during acquisition. From this research, the height factor in image acquisition with a UAV should be adjusted and the area conditions are free or there are no provisions so it is recommended to adjust to the conditions.
Road damage requires detailed and thorough monitoring to determine the selection of further maintenance procedures. Currently, object detection has low accuracy so failing to detect some road damage causes testing to be deemed inefficient. Armed with this initial knowledge, Zhang et al. [24] conducted research related to monitoring road damage with camera images from UAVs and using the Multi-level Attention Block (MLAB) mechanism to strengthen Yolo v3 features. The addition of MLAB on the inter-backbone side and the fusion feature was able to increase the mAP value to 68.75% from only 61.09%. The results of the method proposed by Yingchao Zhang, show its ability to detect various types of road damage, including longitudinal, and transverse cracks, repairs and the presence of potholes. The resulting findings accelerate non-destructive road damage detection.
The distance between the camera and the object will affect the resulting image pixels, including the lighting conditions when the image is taken. The existence of several factors that affect the results of the image will result in differences when calculating the area of infected areas and healthy areas, therefore in determining the area of the area a reference point will be determined as a reference for calculating image pixels. The reference point will ignore the distance between the camera and the object so that the area of the object will not change. The input image from the drone camera is first carried out by an edge detection process to find out the object boundaries with the background image so that the part of the image whose area will be calculated is known. From this edge detection, the coordinates of each corner of the object can be identified and then the center point of the object is determined as the starting point for determining the pixel width and pixel height. The number of image pixels on the width and height sides is converted to units of length (centimeters or inches) by first referring to a reference point as a starting point. In Figure 1, object detection is shown along with the coordinates of each corner as object boundaries. The coordinates of each corner are used to determine the boundaries of the object so that a clear shape of the object will be formed.
Figure 1. Coordinates of the object
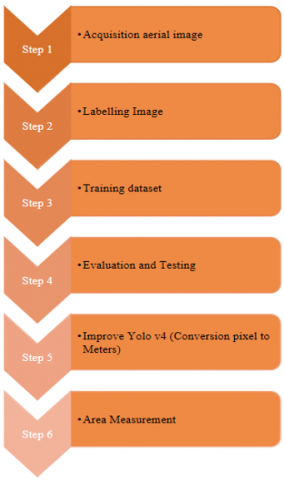
Acquisition of aerial imagery using drones is the first step in this research. Drones fly over rice fields to collect data in the form of images of rice plant leaves at different distances (5 meters, 10 meters, and 20 meters). Acquisition distance with 3 different distances due to the effective distance from the drone camera which produces the best image brightness level, especially for object detection [14]. The image acquisition time was determined from 08.00 AM to 09.00 AM because at that time the light intensity was not too strong and the weather conditions, especially the wind speed, were not too fast so operating the drone would be easier. Figure 2 presents a chart of research stages from image acquisition to determining area size.
Figure 2. Overview of the research stages
3.1 Acquisition of aerial image
The drone used for image acquisition is the Fimi x8 mini drone 8KM 4K 3-Axis Camera 2021 Pro Version. Images of rice paddy fields were taken from different heights with the aim of finding the effectiveness of the Yolo detector in detecting disease. The distance variations consist of 5 meters, 10 meters, and 20 meters. The locations of rice fields as image acquisition object locations are in the districts of Magetan, Madiun, and Trenggalek, East Java, Indonesia. More details about the location and time of image acquisition are presented in Table 1. Image acquisition includes healthy rice fields and infected rice fields with plants aged 1 month to 3 months. The specifications of the Fimi x8 mini drone can be seen in Table 2. The camera specifications on the drone are sufficiently capable of capturing the color of leaf images to be used as input datasets.
It is clear that the image at a distance of 5 meters does not cover the entire rice plant, whereas, at a distance of 10 meters and 20 meters, the image clearly shows healthy and infected plants.
Table 1. Location and time of image acquisition
|
Location |
Coordinate |
Equipment |
Period |
|
Magetan |
-7.529398, 111.461718 |
Fimi x8 mini drone 8KM 4K 3-Axis Camera 2021 Pro Version |
1/9/2022 s.d 28/11/2023 |
|
Madiun |
-7.755686, 111.508533 |
25/1/2023 s.d 10/2/2023 |
|
|
Trenggalek |
-8.095395, 111.758618 |
25/2/2023 s.d 5/32023 |
Table 2. FIMI X8 mini drone specifications
|
Product Model |
FMWRI04A7 |
|
Operating Freq |
5725 – 5.825 |
|
Lens |
FOV 800 |
|
Camera Aperture |
f2.0 |
|
Camera focal distance |
3.54mm |
|
Sensor |
1/2.6''SONY CMOS |
|
Efective Pixel |
12M Pixels |
|
Image Format |
JPG, JPG+DNG |
|
Image Resolution |
3840 x 2160 |
|
ISO Range |
100 – 3200 |
|
Max video resolution |
3840 x 2160 30 fps | 25 fps | 24 fps |
3.2 Labelling image
The next stage is the dataset labeling process which includes healthy labels and infected labels. Tools as labeling tools use LabelImg and Yolo Mark software. The dataset is divided into 2 classes, namely the healthy and infected classes, each labeled comprehensively, where the label covers the area of healthy and infected areas, not labeled per plant. The number of datasets resulting from the acquisition was 4,550 divided into 2 classes (Table 3).
Table 3. Labeling dataset
|
Number |
Class |
Number of Images |
|
0 |
Infected |
4.550 |
|
1 |
healthy |
Figure 3 shows the dataset image in the labeling process using the labelImg tool. Image labeling will show the coordinates of the boundary points of each corner so as to form a boundary between the healthy label and the infected label. Dataset labeling is needed to convert images into .xml format which can be read in the Python programming language.
3.3 ArUco Marker
The reference point as a reference in the form of an ArUco Marker is a square-shaped object whose area size is known so that when taking images at different distances it will not affect the area size of the object. ArUco Marker is used as a reference for measuring instruments and image pixels as well as calibrating the camera used. ArUco Marker which contains a binary grid of black and white cells surrounded by black as a border. ArUco Marker will produce a clearer image by placing the image acquisition in an area with a white background because the color will be more contrasting. Figure 4 shows an example of the ArUco Marker used in this research with a size of 5x5 id 5.
Figure 3. Labeling image
Figure 4. ArUco Marker 5x5 id 5
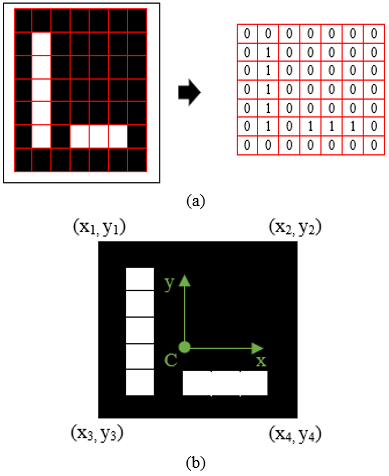
ArUco Marker identification requires several computational steps [28]. First, adaptive threshold contour segmentation is a process, of applying contour extraction and a polygonal approach with the aim of maintaining rectangular boundaries and, thirdly removing unnecessary information. Each pixel in the ArUco Marker is binarized and divided into a regular grid with elements in the form of binary numbers 0 or 1 [29]. Figure 5 shows the ArUco Marker in the form of a system of 4 angles and their coordinates.
3.4 Proposed method
The next most important part of the substance is measuring the area of infected and healthy plants by inserting into the Yolo v4 object detection algorithm in the form of an ArUco Marker reference image. As a reference, the ArUco Marker is used as an initial reference in searching for coordinate points for each corner of the image. The image from the detection results will be input in measuring the area of infected and healthy areas. Insertion of the ArUco Marker in the Yolo v4 algorithm is carried out when object detection is complete. Figure 6 shows the image boundaries of the detection results by calculating the coordinates of each corner to be referenced with the ArUco Marker. Before being used as a reference, the ArUco Marker has been calibrated for distance and length, width and area. After the ArUco Marker is calibrated, it will not be affected by the image acquisition distance or length, width will not change.
Figure 5. (a). Binarization of ArUco Marker in grid form, (b). ArUco Marker in 4 corner coordinate system
Figure 6. Proposed method
In this section, a discussion of the research results will be presented at the beginning of the research until conclusions emerge. In accordance with the research stages in chapter three, the initial stages are in the form of data acquisition using drone equipment that flies over rice paddy fields. Data acquisition takes the form of taking images of rice fields at varying distances, namely 2 meters, 5 meters, 10 meters and 20 meters. The purpose of taking images with various distances is to find the best distance in terms of image detection of infected paddy fields and healthy fields. Table 4 shows the time of data acquisition along with the data acquisition distance from the drone camera to the object. The acquisition distance between the drone and the object in Figure 7 shows the image acquisition results. The image acquisition process is carried out perpendicular to 90° it easier to calculate the area based on the detection results of the bounding box.
Conduct training with the aim of training and finding the best model in determining patterns and characteristics of each dataset class or better known as image feature extraction. The existence of a training process is a basis for determining the best decision in predicting each case of healthy and infected images. The training dataset at the start of training uses Yolo v4 pre-trained weights from the darknet until we get the best weights according to the dataset that has been prepared. A technique like this is an implementation of the transfer learning technique, which means that the parameters used have been trained by another party so there is no need to train from scratch. Meanwhile, dataset training is carried out on the Google Collaboratory platform due to its free nature, but for large amounts of data requiring high computing, you need to upgrade to Google Colab Pro or Google Colab Pro+. In Table 4 are the parameters used during dataset training.
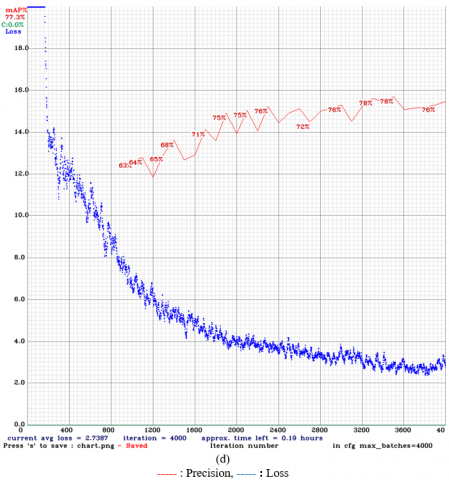
Figure 8 depicts the outcomes of a training model encompassing two classes (infected and healthy). The model achieves the best mean Average Precision (mAP) of 77.3% on a 20-meter acquisition image, while the lowest mAP value, 46.8%, is observed at a 2-meter distance. Notably, the largest loss value is recorded in the 2-meter acquisition image, whereas the smallest loss occurs in the 5-meter acquisition image. This experimental data indicates that image acquisition from a 2-meter distance yields the least favorable result among the varied acquisition distances in the dataset.
The performance of the training model across diverse image dataset variations underscores the impact of various factors on image acquisition. These factors include acquisition distance, light intensity during image acquisition, camera specifications, acquisition time, weather conditions, and labeling. The comprehensive results of the training model across different image acquisition distances are detailed in Table 5. Additionally, the swiftest detection time is achieved in 1 second for the labeling of the two specified classes.
Object detection results provide a percentage level indicating the confidence of the detection. Figure 9 illustrates these values for both healthy and infected labels. The detection value influences the prediction outcome, as the training process relies on the feature extraction value for each object. Some detection instances yield a 100% value, signifying a true accuracy rate, while others may show values like 0.97. Variances in detection values among objects highlight distinctions in their unique characteristics. Figure 10 presents results from detection at a 10-meter acquisition distance, indicating that one land is identified as infected, while two lands are identified as healthy.
The next step in this research is to find the pixel area of the reference image, namely the ArUco Marker, at varying shooting distances. The measurement of the image pixel area is carried out to be used as a reference in units of length (cm) per 1 square meter area. So this time we will look for the area of pixels in 1 square meter. Figure 5 shows a reference image that will calculate the pixel area per 1 square meter. Reference images will be acquired using drone cameras at varying distances. The reference image acquisition distance starts from 1 meter to 20 meters with a range of 1 meter. This is because it makes it easier to find mathematical equations as a model for determining the area of an image area based on images obtained by drones.
Figure 5 is a reference image in the form of an ArUco Marker with a real size of 100cm x 100cm. From the image, the length and width of the pixels are searched starting from one corner point to another corner point. Using Euclidean equations (equation 1) and the Matlab tool, you can find the coordinates of each corner, namely {(xmax,ymin), (xmax,ymax), (xmin,ymin), (xmin,ymax)} with coordinate values {(234,106), (1248, 121), (229,1124), (1241,1112)}. The results of the coordinate values are illustrated according to Figure 1 so that the values of the length, width and area of the reference image area will be known.
$\begin{gathered}d=\sqrt{\left(x_{\max }-x_{\max }\right)^2+\left(y_{\max }-y_{\min }\right)^2} \\ \text { Width }=1.014 \text { pixel }\end{gathered}$ (1)
Meanwhile, for calculating length distances in coordinates (234,106), (229,1124)
Length $=\sqrt{\left(x_{\max }-x_{\min }\right)^2+\left(y_{\min }-y_{\min }\right)^2}$
Length $=1.018$ pixel
Table 4. Parameter model Yolo V4
|
Parameters |
Explanation |
|
Width |
416 |
|
Height |
416 |
|
Load Model |
Darknet |
|
Batch |
64 |
|
Max Batch |
4.000 |
|
Subdivision |
16 |
|
GPU |
Yes |
|
Steps |
3.200, 3.600 |
Figure 7. Results of drone image acquisition
Figure 8. Result of model training: (a) 2 meter (b) 5 meter (c) 10 meter (d) 20 meter
Figure 9. Image of detection results
Figure 10. Image detected infection
Figure 11. Coordinate values for each corner
Thus, the pixel area of the reference image is:
Square area $=1.032 .377$ pixel
The pixel area results in the reference image show the image pixel area per 1 square meter at a certain acquisition distance. Thus, when calculating the area of infected and healthy plants, we only compare the image of the rice area with the reference image but must be adjusted to the same acquisition distance. Table 6 shows the results of measuring the pixel area of the reference image acquired from various distances.
After looking for size calculations on reference images at various acquisition distances, we now start calculating the area of infected and healthy rice plants based on the detection results using the Yolo v4 algorithm. Using the detection data in Figure 10, we will look for the area of infected and healthy rice plants by referring to the ArUco Marker reference image. The image obtained from the acquisition in Figure 10 was acquired from a distance of 11 meters so that in calculating the area area it will be referenced with the reference image acquired from a distance of 11 meters. To make calculations easier, the image of the rice plant was converted from a color image to a gray image according to Figure 11. After that, from the gray image, the pixel area was searched by first calculating the length and width of the pixels in the image where the infection was detected using the Euclidean equation. Figure 10 shows the results of the Yolo detection results, which are only in the infected area.
Using the Euclidean equation, the length and width of the image pixels for the infection detected in Figure 10 are calculated. The coordinate point values of the detected image are in the coordinate point format {(xmax,ymin), (xmax,ymax), (xmin,ymin), (xmin,ymax)} the value is known {(1141,15), (2572,15), (1141,2134), (2572,2134)}. To clarify the location of the coordinate points at each corner of the detected image, it can be seen in Figure 10.
Table 5. Overall results of Yolo V4 model training
|
Acquisition (Meter) |
TP |
FP |
FN |
F1-Score |
Recall |
Av IOU (%) |
Time (Seconds) |
|
2 |
200 |
161 |
110 |
0,60 |
0,65 |
37,05 |
1 |
|
5 |
12 |
7 |
3 |
0,71 |
0,80 |
52,61 |
1 |
|
10 |
26 |
11 |
9 |
0,72 |
0,74 |
59,67 |
1 |
|
20 |
57 |
26 |
13 |
0,75 |
0,81 |
54,35 |
1 |
Table 6. Result of measuring the pixel area
|
Acquisition Distance (Meter) |
Size (Pixel) |
Square Area (Pixel) |
|
2 |
Length = 1.081 Width = 1.081 |
1.168.561 |
|
3 |
Length = 808 Width = 808 |
652.864 |
|
4 |
Length = 651 Width = 651 |
423.801 |
|
5 |
Length = 541 Width = 541 |
292.681 |
|
6 |
Length = 454 Width = 454 |
206.116 |
|
7 |
Length = 403 Width = 403 |
162.409 |
|
8 |
Length = 358 Width = 358 |
128.164 |
|
9 |
Length = 318 Width = 318 |
101.124 |
|
10 |
Length = 291 Width = 291 |
84.681 |
|
11 |
Length = 264 Width = 264 |
69.696 |
|
12 |
Length = 240 Width = 240 |
57.600 |
|
13 |
Length = 227 Width = 227 |
51.529 |
|
14 |
Length = 210 Width = 210 |
44.100 |
|
15 |
Length = 196 Width = 196 |
38.416 |
|
16 |
Length = 185 Width = 185 |
34.225 |
|
17 |
Length = 175 Width = 175 |
30.625 |
|
18 |
Length = 164 Width = 164 |
26.896 |
|
19 |
Length = 155 Width = 155 |
24.025 |
|
20 |
Length = 148 Width = 148 |
21.904 |
Table 7. Calculation results of reference and detected image
|
Reference Image (Pixel) |
Detected Image (Pixel) |
||||
|
Length |
Width |
Square Area |
Length |
Width |
Square Area |
|
264 |
264 |
69.696 |
2.119 |
1.431 |
3.032.289 |
Table 8. Calculation results of the pixel area of the reference image and the detected image
|
Reference Image (Pixel) |
Detected Image (Pixel) |
||||
|
Length |
Width |
Square Area |
Length |
Width |
Square Area |
|
291 |
291 |
84.681 |
3.334 |
1.438 |
4.794.292 |
Table 9. Comparison of the results of calculating the area of rice plantations
|
Calculation Techniques |
Length (Meter) |
Width (Meter) |
Square Area (Meter2) |
|
ArUco Marker reference image |
11,45 |
4,94 |
56,57 |
|
Real condition |
11 |
5 |
55 |
Using the illustration in Figure 10, the pixel length and width values can be calculated with equation 1 as follows:
Length $=2.119$ pixel
Meanwhile, the pixel width value using the same method can be calculated with equation 1 as follows:
Width $=1.431$ pixel
Thus, for the image pixel area, the detection results are:
Square area $=3.032 .289$ pixel
After the length, width and pixel area of the detected image are known, the next step is to reference the reference image at the same acquisition distance, namely 11 meters. Reference pixel areas are presented in Table 6 to determine the real area of the detected image. A summary of the calculation of the length, width and area of the reference image and the detected image is presented in Table 7. To calculate the real area of the detected image, you need to compare the area of the detected image with the area of the reference image because the reference image is the real area per 1 meter2.
After knowing the results of the area of the detected image in pixels, it will then be converted into an area in meters. The calculation of the real area of the detected image is as follows:
$\begin{gathered}\text { Length }=\frac{\text { Length detected image }(\text { in pixel })}{\text { Length reference image }\left(\text { in } \frac{\text { pixel }}{m}\right)} \\ \text { Length }=\frac{2119}{264}\end{gathered}$
Length $=8,03$ meter
$\begin{gathered}\text { Width }=\frac{\text { Width detected image }(\text { in pixel })}{\text { Width reference image }\left(\text { in } \frac{\text { Pixel }}{m}\right)} \\ \text { Width }=\frac{1431}{264} \\ \text { Width }=5,42 \text { meter }\end{gathered}$
Square area $=$ Length $x$ Width
Square area $=8,03 \times 5,42$
Square area $=43,51$ meter $^2$
Thus the results of the calculation of the area of the image detected an infection of 43.51 meters2.
As an evaluation material for the results of calculating the area of plants resulting from Yolo detection images, calculations will be carried out using different resulting images. Figure 12 shows the image of the detection results which will be used as evaluation material by comparing the calculation results with the actual area of rice plants. The image used in this evaluation measures 11 meters long and 5 meters wide and was acquired from a distance of 10 meters.
Using the Euclidean equation, the length and width of the image pixels detected as healthy in Figure 10 are calculated. The coordinate point values of the detected image using the coordinate point format {(xmax,ymin), (xmax,ymax), (xmin,ymin), (xmin,ymax)} are known the values are {(19,25),(3353,25),(19,1463),(3353,1463)}. To clarify the location of the coordinate points at each corner of the detected image, it can be seen in Figure 13.
Figure 12. Image of the results of the Yolo detection as an evaluation
Figure 13. The corner coordinates of the detected image
Using the illustration in Figure 13, the pixel length and width values can be calculated with Eq. (1) as follows
Length $=3.334$ piksel
Meanwhile, the pixel width value using the same method can be calculated with equation 1 as follows:
Width $=1.438$ pixel
Thus, for the image pixel area, the detection results are :
Square area=Length $x$ Width
Square area $=4.794 .292$ pixel
After the length, width and area of the detected image pixels are known, the next step is referenced with a reference image at the same acquisition distance of 10 meters. The pixel area reference is presented in Table 6 to find out the real area of the detected image. A summary of the calculation of the length, width and area of the reference image and detected image is presented in Table 8. To calculate the real area of the detected image is to compare the area of the detected image with the area of the reference image because the reference image is the real area per 1 meter2.
The calculation of the real area of the detected image is as follows:
$\begin{gathered}\text { Length }=\frac{\text { Length detected image }(\text { in pixel })}{\text { Length reference image }\left(\text { in } \frac{\text { pixel }}{m}\right)} \\ \text { Length }=\frac{3.334}{291} \\ \text { Length }=11,45 \text { meter }\end{gathered}$
$\begin{gathered}\text { Width }=\frac{\text { Width detected image }(\text { in pixel })}{\text { Width reference image }\left(\text { in } \frac{\text { pixel }}{m}\right)} \\ \text { Width }=\frac{1.438}{291} \\ \text { Width }=4,94 \text { meter }\end{gathered}$
Square area $=$ Length $x$ Width
Square area $=56,57$ meter $^2$
Thus, the real area of the image detected as healthy in Figure 13 using manual calculations has a length of 11.45 meters and a width of 4.94 meters and the real area of the image detected is 56.57 meters2. The results of manual calculations using the ArUco Marker reference image on the Yolo v4 algorithm and measuring the real area of the plant area produce almost the same values. Table 9 shows a recapitulation of the results of area calculations using the ArUco Marker and the actual area of rice plants detected.
Table 9 shows the results of calculations using the ArUco Marker reference image with the actual area of infected rice land producing almost the same values. Calculations using the ArUco Marker reference image produce a value of 56.67 m2 and a real area of 55 m2. If you look at the calculation results, the accuracy of the calculation using the ArUco Marker reference image is 97.05%. Thus, the use of the ArUco Marker reference image can be used as material for measuring area size based on the image obtained by the drone camera.
The final result of this research is that the ArUco Marker reference image can be used to calculate the area of infected and healthy areas resulting from Yolo v4 object detection. In this way, the Yolo object detection algorithm and ArUco Marker can be combined to complete the detection while calculating the area of the plant area. The research stages starting from dataset image acquisition to calculating the area of rice plants show the results of model training consisting of 2 classes (infected and healthy) with the best mAP results on 20-meter acquisition images of 77.3% and the worst value of 46.8%. at an image acquisition distance of 2 meters. Meanwhile, the largest loss value occurred in the 2-meter acquisition image and the smallest loss occurred in the 5-meter acquisition image. The results of this experiment show that image acquisition from a distance of 2 meters is the lowest result of the variation in image acquisition distance in the dataset.
Simultaneously, the calculation of rice plant areas using the ArUco Marker reference image demonstrates an accuracy level of 97.05%. Consequently, the ArUco Marker reference image proves to be a viable technique for accurately determining the area of an object solely based on drone acquisition images.
[1] Puri, V., Nayyar, A., Raja, L. (2017). Agriculture drones: A modern breakthrough in precision agriculture. Journal of Statistics and Management Systems, 20(4): 507-518. https://doi.org/10.1080/09720510.2017.1395171
[2] van der Merwe, D., Burchfield, D.R., Witt, T.D., Price, K.P., Sharda, A. (2020). Drones in agriculture. In Advances in Agronomy, 162: 1-30. https://doi.org/10.1016/bs.agron.2020.03.001
[3] Xia, L., Zhao, F., Chen, J., Yu, L., Lu, M., Yu, Q., Liang, S., Fan, L., Sun, X., Wu, S., Wu, W., Yang, P. (2022). A full resolution deep learning network for paddy rice mapping using Landsat data. ISPRS Journal of Photogrammetry and Remote Sensing, 194: 91-107. https://doi.org/10.1016/j.isprsjprs.2022.10.005
[4] Wahab, I., Hall, O., Jirström, M. (2018). Remote sensing of yields: Application of uav imagery-derived ndvi for estimating maize vigor and yields in complex farming systems in sub-saharan africa. Drones, 2(3): 28. https://doi.org/10.3390/drones2030028
[5] Yang, Q., Shi, L., Han, J., Zha, Y., Zhu, P. (2019). Deep convolutional neural networks for rice grain yield estimation at the ripening stage using UAV-based remotely sensed images. Field Crops Research, 235: 142-153. https://doi.org/10.1016/j.fcr.2019.02.022
[6] Tan, L., Lv, X., Lian, X., Wang, G. (2021). YOLOv4_Drone: UAV image target detection based on an improved YOLOv4 algorithm. Computers & Electrical Engineering, 93: 107261. https://doi.org/10.1016/j.compeleceng.2021.107261
[7] Laghari, A.A., Jumani, A.K., Laghari, R.A., Nawaz, H. (2023). Unmanned aerial vehicles: A review. Cognitive Robotics, 3: 8-22. https://doi.org/10.1016/j.cogr.2022.12.004
[8] Radhakrishnan, S. (2020). An improved machine learning algorithm for predicting blast disease in paddy crop. Materials Today: Proceedings, 33: 682-686. https://doi.org/10.1016/j.matpr.2020.05.802
[9] Chen, W.L., Lin, Y.B., Ng, F.L., Liu, C.Y., Lin, Y.W. (2019). RiceTalk: Rice blast detection using Internet of Things and artificial intelligence technologies. IEEE Internet of Things Journal, 7(2): 1001-1010. https://doi.org/10.1109/JIOT.2019.2947624
[10] Jiang, P., Chen, Y., Liu, B., He, D., Liang, C. (2019). Real-time detection of apple leaf diseases using deep learning approach based on improved convolutional neural networks. IEEE Access, 7: 59069-59080. https://doi.org/10.1109/ACCESS.2019.2914929
[11] Sudhesh, K.M., Sowmya, V., Kurian, S., Sikha, O.K. (2023). AI based rice leaf disease identification enhanced by Dynamic Mode Decomposition. Engineering Applications of Artificial Intelligence, 120: 105836. https://doi.org/10.1016/j.engappai.2023.105836
[12] Yin, Y., Li, H., Fu, W. (2020). Faster-YOLO: An accurate and faster object detection method. Digital Signal Processing, 102: 102756. https://doi.org/10.1016/j.dsp.2020.102756
[13] Morbekar, A., Parihar, A., Jadhav, R. (2020). Crop disease detection using YOLO. In 2020 international conference for emerging technology (INCET), Belgaum, India, pp. 1-5. https://doi.org/10.1109/INCET49848.2020.9153986
[14] Masykur, F., Adi, K., Nurhayati, O.D. (2023). Approach and analysis of Yolov4 algorithm for rice diseases detection at different drone image acquisition distances. TEM Journal, 12(2): 928-935.
[15] Roy, A.M., Bose, R., Bhaduri, J. (2022). A fast accurate fine-grain object detection model based on YOLOv4 deep neural network. Neural Computing and Applications, 34(5): 3895-3921. https://doi.org/10.1007/s00521-021-06651-x
[16] Jegatheesan, D., Arumugam, C. (2021). Intelligent traffic management support system unfolding the machine vision technology deployed using YOLO D-NET. International Journal of Intelligent Engineering & Systems, 14(5): 25-34. https://doi.org/10.22266/ijies2021.1031.03
[17] Rafi, M.M., Chakma, S., Mahmud, A., Rozario, R.X., Munna, R.U., Wohra, M.A.A., Joy, R.H., Mahmud, K.R., Bijan, P. (2022). Performance analysis of deep learning YOLO models for south asian regional vehicle recognition. International Journal of Advanced Computer Science and Applications, 13(9): 864-873.
[18] Adi, K.U.S.W.O.R.O., Widodo, C.E., Widodo, A.P., Margiati, U.S.R.I. (2022). Detection of foreign object debris (Fod) using convolutional neural network (CNN). Journal of Theoretical and Applied Information Technology, 100(1): 184-191.
[19] Pan, J., Wang, T., Wu, Q. (2023). RiceNet: A two stage machine learning method for rice disease identification. Biosystems Engineering, 225: 25-40. https://doi.org/10.1016/j.biosystemseng.2022.11.007
[20] Bao, W., Zhu, Z., Hu, G., Zhou, X., Zhang, D., Yang, X. (2023). UAV remote sensing detection of tea leaf blight based on DDMA-YOLO. Computers and Electronics in Agriculture, 205: 107637. https://doi.org/10.1016/j.compag.2023.107637
[21] Sethy, P.K., Barpanda, N.K., Rath, A.K., Behera, S.K. (2020). Image processing techniques for diagnosing rice plant disease: a survey. Procedia Computer Science, 167: 516-530. https://doi.org/10.1016/j.procs.2020.03.308
[22] Huang, Y., Kruyer, A., Syed, S., Kayasandik, C.B., Papadakis, M., Labate, D. (2022). Automated detection of GFAP-labeled astrocytes in micrographs using YOLOv5. Scientific Reports, 12(1): 22263. https://doi.org/10.1038/s41598-022-26698-7
[23] Qiu, Q., Lau, D. (2023). Real-time detection of cracks in tiled sidewalks using YOLO-based method applied to unmanned aerial vehicle (UAV) images. Automation in Construction, 147: 104745. https://doi.org/10.1016/j.autcon.2023.104745
[24] Zhang, Y., Zuo, Z., Xu, X., Wu, J., Zhu, J., Zhang, H., Wang, J., Tian, Y. (2022). Road damage detection using UAV images based on multi-level attention mechanism. Automation in Construction, 144: 104613. https://doi.org/10.1016/j.autcon.2022.104613
[25] Salem, M.S.H., Zaman, F.H.K., Tahir, N.M. (2021). Effectiveness of human detection from aerial images taken from different heights. TEM Journal, 10(2): 522-530.
[26] Wu, J.D., Sun, H.Y. (2022). Driver identification system using finger vein and YOLO object detection. Traitement du Signal, 39(5): 1639-1646. https://doi.org/10.18280/ts.390521
[27] Wang, G., Ding, H., Duan, M., Pu, Y., Yang, Z., Li, H. (2023). Fighting against terrorism: A real-time CCTV autonomous weapons detection based on improved YOLO v4. Digital Signal Processing, 132: 103790. https://doi.org/10.1016/j.dsp.2022.103790
[28] Romero-Ramirez, F.J., Muñoz-Salinas, R., Medina-Carnicer, R. (2018). Speeded up detection of squared fiducial markers. Image and vision Computing, 76: 38-47. https://doi.org/10.1016/j.imavis.2018.05.004
[29] Tocci, T., Capponi, L., Rossi, G. (2021). ArUco marker-based displacement measurement technique: Uncertainty analysis. Engineering Research Express, 3(3): 035032. https://doi.org/10.1088/2631-8695/ac1fc7