Wibowo Harry Sugiharto*![]() | Heru Susanto
| Heru Susanto![]() | Agung Budi Prasetijo
| Agung Budi Prasetijo![]()
© 2023 IIETA. This article is published by IIETA and is licensed under the CC BY 4.0 license (http://creativecommons.org/licenses/by/4.0/).
OPEN ACCESS
Water quality monitoring is crucial for detecting changes in aquatic resources. Traditional methods, which typically involve in-situ sample retrieval followed by laboratory assessments, have been perceived as laborious and time-consuming. Herein, a state-of-the-art, open-source framework is introduced, leveraging the potent synergy of the Internet of Things (IoT) and cloud computing for real-time water quality evaluations. Commercially accessible sensors were utilized for the instantaneous acquisition and interpretation of essential water quality parameters: pH, temperature, total dissolved solids (TDS), and turbidity. Accuracies of 98.54%, 96.85%, and 98.10% were obtained for temperature, pH, and TDS measurements, respectively, based on chosen accuracy metrics. The resilience of the proposed system was ascertained through a comprehensive study at the Troso River, Indonesia. During this evaluation, 4,833 data entries were amassed within a two-hour period. Outcomes from this research, elucidated in the subsequent sections, underscore the proficiency of the system in real-time water quality surveillance. This investigation augments the extant literature, underscoring the transformative role of cloud computing in facilitating instantaneous raw data collection for water quality assessment endeavors.
water quality assessment, Internet of Things (IoT), wireless sensor networks, integrated sensor systems
The alteration in surface and groundwater quality has been observed as a consequence of industrialization and urbanization. Despite its paramount importance, water remains an elusive primary drinking source for an estimated 844 million individuals worldwide [1]. Defined by its degradation from various human activities, such as agriculture and industry, 'wastewater' often presents significant challenges [2]. Even though surface water is invaluable globally, its quality and composition are significantly influenced by diverse wastewater sources. Toxic substances, heavy metals, and both organic and inorganic particles are commonly found, accompanied by physical, chemical, and biological contaminants like bacteria and viruses [3]. Disturbingly, such pollutants are believed to account for nearly 1.5 million annual deaths in children below five, primarily from ailments such as diarrhea [4]. This revelation is further exacerbated when considering that a mere 3% of Earth's water resources are freshwater, and these resources are being contaminated at an accelerating pace [5].
Traditional methodologies, like atomic absorption spectrophotometry, gas chromatography, and flame photometry, have been employed for water quality assessment. Nevertheless, these techniques are often marked by substantial costs and extended analysis times [6, 7]. Moreover, the need to transport samples to laboratories for in-depth evaluation has been identified as a major limitation, resulting in concerns like heightened expenses and inefficiencies [8].
The Water Quality Index (WQI) is recognized as an essential benchmark for water quality evaluation and has been utilized in diverse environments and nations, ranging from lakes [9] and rivers [10] to groundwater sources [11] and agricultural drainages [12]. Notably, the NSF-WQI framework has gained traction in countries like Indonesia [13], Egypt [9], Switzerland [11], Iraq [14], India [15], Brazil [16], Algeria [17], among others.
With technological progression, integration of WQI into novel assessment techniques has been observed. Such advancements have led to the creation of user-centric portable kits for on-the-spot analysis. However, occasional discrepancies between user needs and kit capabilities have been reported [18]. Modern water quality probes introduced to the market have been associated with integrated data collection and internet transmission, making them increasingly accurate and straightforward [19]. Furthermore, the fusion of Cloud Computing with the IoT has been noted, offering transformative monitoring capabilities [20-23]. IoT, described by its network of interlinked devices boasting sensing and communication features [24], provides a continuous influx of data. Wireless Sensor Networks (WSNs), pivotal to IoT, function both at data and edge levels. Raw data is aggregated at a local level and subsequently dispatched to the Cloud for further refinement [25], streamlining and enhancing the overall monitoring process [26].
However, obstacles remain. Certain parameters, such as the Biological Oxygen Demand (BOD), which demands a five-day assessment period, have rendered real-time monitoring of the WQI unfeasible [27, 28]. Additionally, sensor scarcity has been identified as a hindrance for real-time WQI assessment for select parameters [29-33].
A notable gap in real-time water quality evaluation is acknowledged, stemming primarily from sensor limitations. By capitalizing on open-source software and commercial hardware, the present study seeks to deliver real-time monitoring capabilities, despite sensor constraints, with an initial focus on parameters like pH, TDS, turbidity, and temperature. This method aims to bridge the discrepancy between sensor availability and effective water quality evaluation.
2.1 Developmental stages of the online monitoring system
The methodology underlying the creation of a real-time water quality monitoring system was segmented into three pivotal stages:
a) Hardware and Software Design: In this foundational stage, the hardware and software components of the system were meticulously designed. Node stations were developed and sensors were integrated. During this phase, software tools suitable for data acquisition, storage, and transmission were chosen.
b) Calibration and Validation: Subsequent to the design phase, calibration of the integrated sensors was undertaken to ascertain their accuracy and reliability. Validation was concurrently conducted, where sensor outputs were juxtaposed with established standards to determine their precision across diverse environmental conditions.
c) Software Design and Data Transmission Protocols: Upon validating the hardware and sensors, emphasis was placed on formulating software designs and data transmission strategies. This entailed the identification or development of appropriate data analysis algorithms, as well as the establishment of protocols to facilitate real-time data transmission from node stations to the central processing mechanism.
Together, these stages laid the groundwork for the eventual deployment of the real-time water quality monitoring system. The synergetic alignment of hardware, software, and data transmission strategies was deemed essential for ensuring the consistency and trustworthiness of the resultant water quality data.
2.2 WSN
A WSN is defined as a communication system that wirelessly interconnects a vast array of sensors, forging a robust framework for monitoring environmental parameters crucial to water quality assessment. At the heart of WSN functionality lie the Node Stations, which, being strategically positioned within the monitoring region, serve as vital conduits for data collection and transmission [34, 35]. By virtue of this integrated network, remote access to the systems and their accumulated data is made feasible.
Spanning a spectrum of applications, the relevance of WSNs is acknowledged in realms such as smart homes [36], healthcare [36], industrial sectors [36], energy management [37], transportation [38], agriculture [39], and prominently, environmental surveillance [40]. Specifically in water quality monitoring, WSNs are employed to harness data from an assortment of sensors tasked with gauging parameters such as pH, TDS, turbidity, and temperature. These sensors are dispersed with precision across the monitoring expanse, ensuring data acquisition is exhaustive. The amassed data is then channeled to a centralized processing system via Node Stations, where it undergoes subsequent analysis and interpretation.
Elucidated in Figure 1 is the bifurcation of WSN architecture into two predominant models: centralized and distributed. Delving deeper, the taxonomical classification of WSNs encompasses variations rooted in sensor management during monitoring, culminating in configurations like single node-single sensor, single node-multi-sensor, multi-node-single sensor, and multi-node-multi-sensor assemblies [41-44].
Subject to the design and overarching objectives of the system, data visualization can be instantiated either in real-time [43] or archived for deferred offline scrutiny [44]. It is imperative to acknowledge that the need for database facilities in some WSN implementations is obviated [45]; there exist systems where instantaneous data portrayal can be effectuated sans the mandate for expansive database reservoirs [46].
Figure 1. Synchronization data flowchart
2.3 Integration of IoT and cloud computing in uninterrupted data acquisition and preservation
Defined as a network of uniquely identifiable entities encompassing sensors, actuators, data storage mechanisms, and Central Processing Units (CPUs) [47], the IoT has been identified for its proficiency in autonomous data interchange. Through this capability, CPUs are enabled to process sensor data, subsequently leading to informed decisions, with the subsequent actions being executed by actuators.
Within the purview of the present study, a pivotal role is played by IoT technology in facilitating real-time water quality surveillance. Through the integration of sensors into the IoT architecture, continuous data acquisition is ensured. Parameters such as pH, TDS, turbidity, and temperature are securely channeled to cloud-based repositories [48], underscoring the preservation of the all-encompassing raw data. The amalgamation of IoT and cloud computing has been recognized as a potent solution for safeguarding raw data. By capitalizing on cloud capabilities, the sanctity of the amassed data remains uncompromised, while still being immediately accessible for ensuing assessment.
Illustrating its adaptability, the utility of IoT spans varied domains like agribusiness, healthcare, environmental stewardship, and disaster mitigation [17, 49-51]. The inherent flexibility of its architecture permits limitless global object connectivity to the internet. Data collected is processed in cloud-based servers, culminating in insights congruent with the specific IoT service deployed [52]. Given the intrinsic sensitivity of the information, it is noted that an exhaustive multi-tier security structure encapsulating data, edge, fog, and cloud security strata has been integrated, bestowing comprehensive fortification upon the entire apparatus [53].
3.1 Hardware and software design
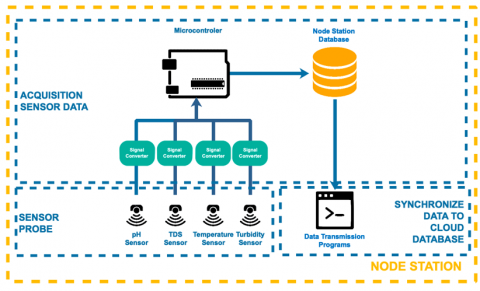
During the phase of hardware and software design, meticulous configuration of individual node stations for the water monitoring system was undertaken. For each node station, a specialized role was envisioned: the aggregation and transmission of water-related data. The node stations were equipped with sensor probes designed to measure key water parameters, such as pH, TDS, temperature, and turbidity.
Data generated by these sensors underwent processing through dedicated signal converters. In this crucial conversion process, initial sensor readings were transformed into precise parameter values, a step commonly termed as data acquisition. Subsequent to this acquisition, data from various sensors were received by the microcontroller, and subsequently stored within the local database of the node station. This repository thus becomes an integral foundation for later stages of the study.
3.2 Calibration and validation
During the calibration tests, a verification procedure was employed to ascertain the level of error. The percentage error was formulated using Eq. (1), while the accuracy of sensor acquisition was determined by Eq. (2), wherein X represents the observed variable, and Xi denotes the predicted variable.
$\overline{\% \text { error }}=\left|\frac{(x-x i)}{x} 100 \%\right|$ (1)
$Sensor Accuracy$ $=100 \%-\%$ error (2)
Calibration for the temperature sensors utilized in this study was deemed unnecessary due to the inherent calibration of the controlling library, Dallas Temperature. The validity of this parameter was further corroborated by comparing readings from the DS18B20 probe sensor and a conventional mercury thermometer. As illustrated in Table 1, a comparative analysis between the temperature sensor and the probe sensor using mercury as a reference yielded an error rate of 1.46% over ten iterations. Utilizing Eq. (2), an accuracy of 98.54% was deduced for the temperature sensor.
Table 1. Results of temperature parameter verification
|
No |
Sensor (°C) |
Mercury (°C) |
% Error |
|
1 |
29.25 |
29 |
0.86% |
|
2 |
30.63 |
30 |
2.10% |
|
3 |
31.75 |
31 |
2.41% |
|
4 |
32.05 |
32 |
0.15% |
|
5 |
33.57 |
33 |
1.72% |
|
6 |
34.8 |
34 |
2.35% |
|
7 |
35.46 |
35 |
1.31% |
|
8 |
36.46 |
36 |
1.27% |
|
9 |
37.86 |
37 |
2.32% |
|
10 |
38.06 |
38 |
0.15% |
|
$\overline{\% \text { error }}$ |
1.46% |
||
The pH sensor underwent calibration with three distinct buffer solutions, having pH values of 4.02, 6.84, and 9.10. Post operation over the Arduino Leonardo housed within the Lattepanda board, the potentiometer on the accompanying circuit board was adjusted to align the serial monitor reading with the pH value of the buffer solution. A tri-phase calibration procedure was executed to fine-tune the settings. Furthermore, the efficacy of the pH sensor was validated across three pH categories: normal, alkaline, and acidic. The outcomes of this comprehensive validation are tabulated in Table 2. Throughout 15 test iterations, the pH sensor was evaluated under varying temperatures (ranging from 15 to 35°C) and distinct water pH levels. The derived average error rate was 3.15%, resulting in a pH sensor accuracy of 96.85%.
Table 2. Results of pH parameter verification
|
No |
Temp (°C) |
PH Sensor |
pH Buffer Solution |
% Error |
|
e |
15 |
4.08 |
4.00 |
2.00% |
|
2 |
20 |
4.24 |
4.00 |
6.00% |
|
3 |
25 |
4.12 |
4.01 |
2.74% |
|
4 |
30 |
4.26 |
4.01 |
6.23% |
|
5 |
35 |
4.12 |
4.02 |
2.49% |
|
6 |
15 |
7.16 |
6.90 |
3.77% |
|
7 |
20 |
7.12 |
6.88 |
3.49% |
|
8 |
25 |
7.05 |
6.86 |
2.77% |
|
9 |
30 |
6.93 |
6.85 |
1.17% |
|
10 |
35 |
7.03 |
6.84 |
2.78% |
|
11 |
15 |
9.12 |
9.28 |
1.72% |
|
12 |
20 |
8.88 |
9.23 |
3.79% |
|
13 |
25 |
8.89 |
9.18 |
3.16% |
|
14 |
30 |
8.76 |
9.14 |
4.16% |
|
15 |
35 |
9.01 |
9.10 |
0.99% |
|
$\overline{\% \text { error }}$ |
3.15% |
|||
Components of the turbidity sensor encompassed near-infrared LEDs and photodiodes. An inverse relationship was observed wherein an increase in solution turbidity led to a decrease in the amount of light perceived by the photodiode, correspondingly reducing the photodiode voltage relative to unimpeded light transmission. Employing pure water as the 0 NTU reference, calibration of the turbidity sensor was conducted between 0 NTU and 100 NTU standards. The potentiometer was adjusted based on the resultant solution water value to derive the calibration equation from a linear fit of NTU values against voltage readings.
For the validation of TDS, a reference buffered TDS solution from a probe sensor was employed. The results of this comprehensive validation are presented in Table 3. Over ten iterations, the TDS sensor was assessed across a temperature range of 0-30°C. An error rate of 1.90% was identified, leading to a derived accuracy of 95.0% for the TDS sensor.
Table 3. Results of TDS parameter verification
|
No |
Temp (°C) |
Sensor TDS (ppm) |
TDS Solution |
%Error |
|
1 |
0 |
746 |
758 |
1.58% |
|
2 |
5 |
901 |
876 |
2.85% |
|
3 |
10 |
983 |
999 |
1.60% |
|
4 |
15 |
1169 |
1122 |
4.19% |
|
5 |
20 |
1288 |
1251 |
2.96% |
|
6 |
23 |
1320 |
1329 |
0.68% |
|
7 |
24 |
1345 |
1358 |
0.96% |
|
8 |
25 |
1366 |
1382 |
1.16% |
|
9 |
26 |
1395 |
1408 |
0.92% |
|
10 |
30 |
1483 |
1515 |
2.11% |
|
$\overline{\% \text { error }}$ |
1.90% |
|||
3.3 Software and data transmission design
Data procured from the sensor probes at each station node is stored and subsequently analyzed to assess water quality acceptability. Figures 2 and 3 delineate the data transmission design and the synchronization of data phases, respectively.
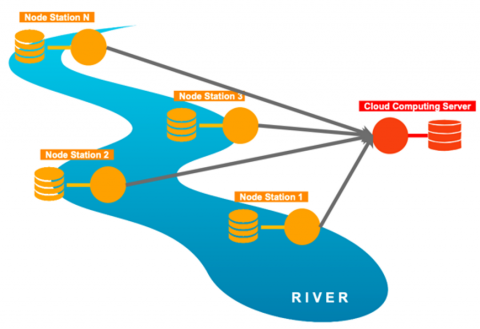
Such a design has been observed to provide advantages in the face of network challenges. In the event of a network disruption, data is preserved within the node station and dispatched to the cloud computing server once network continuity is re-established. This mechanism guarantees the integrity of the data, irrespective of network anomalies. Moreover, a filtration system is implemented, circumventing the transmission of duplicated or previously dispatched data. Figure 3 offers a visualization of the data transmission pathway from individual node stations to the cloud computing server, facilitating global accessibility.
Figure 2. Design of node station data acquisition
Figure 3. Data Transmission from node station to cloud computing server
3.4 Component details
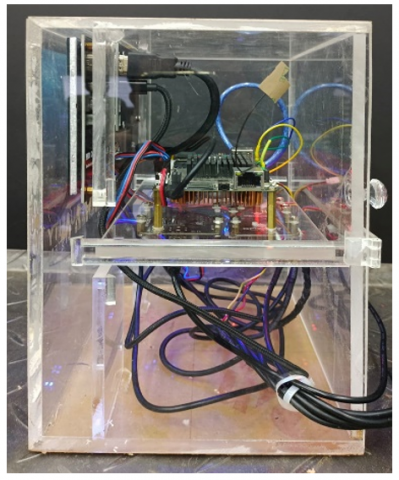
For the development of a node-station design, an amalgamation of components spanning hardware, software, and communication networks is necessitated. Within the hardware construct, all components were integrated onto a Lattepanda v1 board, a singular computer board with an embedded Arduino Leonardo (SKU: DFR0419, sourced from Dfrobot.com).
Figure 4. Front view of node station hardware implementation
Figure 5. Side view of node station hardware implementation
The turbidity sensor (SKU: SEN0189 from Dfrobot.com) functions as both a light transmitter and receiver, complemented by an amplifier. Its signal pins were attached to the analog inputs of the Arduino boards. A distinct 64-bit ID was possessed by one of the DS18B20 temperature sensors (SKU: DFR0198 from dfrobot.com), allowing for the connection of multiple temperature sensors to a single pin, specifically designed for one-wire applications.
Constructed from a sensitive glass membrane with diminished impedance, the pH sensor (SKU: SEN0169-V2 from Dfrobot.com) ensures precise pH readings. This electrode is characterized by remarkable thermal stability, rapid responsiveness, and suitability for a diverse range of pH measurements. It displays consistent reproducibility, resistance to hydrolysis, and alkali error elimination. Notably, the output voltage of the electrode remains linear across the pH range of 0 to 14. Augmented by the Ag/AgCl gel electrolyte salt bridge, the reference system demonstrates resilience against contamination and a stable half-cell potential. The ring PTFE membrane, resistant to easy clogging, is optimal for prolonged online detection. A BNC (Bayonet Neill-Concelman) cable served as the linkage between the pH sensor and a circuit board, subsequently connected to the Arduino board's analog input A1.
Among the sensors, the TDS sensor (SKU: SEN0244 from dfrobot.com) is noteworthy, connected to an analog input and featuring a waterproof probe for prolonged immersion in water. The analog turbidity sensor (SKU: SEN0189 from dfrobot.com) was also interfaced with the analog pin on the Lattepanda board, catering to water turbidity measurements. Figures 4 and 5 encapsulate the components utilized in the device, additionally showcasing the device in its elemental form.
4.1 Real-time data transmission
Referring to Figure 2, synchronization of raw data was achieved utilizing the HTTP response and HTTP request methods between each node station and the cloud server. Such methods ensure that newly stored data in a node station's database is subsequently dispatched to the cloud server. Four parameters were under investigation: pH, temperature, turbidity, and TDS. Data transmission was executed every 3 seconds, resulting in the delivery of 28,800 raw data points from each node station during a single day of observation.
Figure 6. Data transmission from node station to cloud server
Figure 7. Individual node station data transmission to cloud server
Figures 6 and 7 delineate the HTTP request and HTTP response processes, respectively, for the data transmission. Notably, a swift data exchange was observed, with an average latency of less than 1 second, which was derived from the interval between data procurement at the node station and data reception at the cloud computing server, as registered in the database.
4.2 Raw data of the water monitoring system
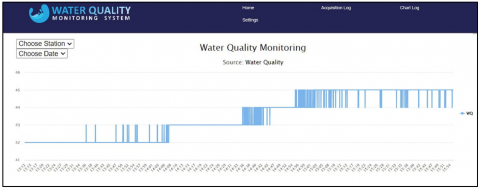
To corroborate the study's findings, data collection was undertaken from authentic scenarios. A node station was established in Troso Village, Jepara, Indonesia. As illustrated in Figure 8, the pollution levels in this area appeared elevated. Predominantly, the pollution emanated from residential sewage intermingled with waste from the home textile industry. Given that the river irrigates neighboring paddy fields, non-compliance with water quality standards may engender cascading pollution. Data procurement was conducted from 01:00 pm to 03:00 pm on November 22, 2022. Within this two-hour span, 4833 data points were amassed, with the average monitoring value presented in Table 4. Figures 9-11 showcase the real-time online display of the acquired data.
Figure 8. Condition of the river in Troso village during a pollution event
Table 4. Data procured from Troso village river (November 22, 2022, 13:00 - 15:00)
|
Temp |
pH |
TDS |
Turbidity |
|
|
Max Value |
29.6 |
4.7 |
81.7 |
41.4 |
|
Min Value |
29.1 |
3.9 |
51.6 |
36.5 |
|
Avg Value |
29.4 |
4.3 |
65.8 |
39.0 |
4.3 Discussion
Within the scope of this research, methodologies for enhancing water quality monitoring via a wireless sensor node network were scrutinized. The findings revealed the system's proficiency in real-time data acquisition, transmission, and subsequent storage in cloud-based repositories. Emphasis is laid on the pertinence of these findings to extant knowledge in this domain and potential real-world applications.
Efficiency in real-time data transmission was noted upon synchronizing raw data via HTTP response and request protocols between node stations and the cloud server. Such a mechanism enabled fluid data interchange, incurring a negligible average delay of under 1 second. These results underscore the system's capacity to provide accurate and timely insights into water quality, even amidst network perturbations. This synchronization approach was discerned to be imperative for maintaining data integrity amidst potential network disruptions.
The empirical deployment in Troso Village, Jepara, Indonesia, served as testament to the system's practical applicability. The continuous monitoring and transmission capabilities over a two-hour duration, culminating in the collection of 4833 data points, accentuate the system's robustness and reliability in dynamic environments.
Figure 9. Online interface displaying real-time data acquisition
Figure 10. Log of raw data collected from Troso village river (November 22, 2022, 13:00-15:00)
Figure 11. Graphical representation of raw data from Troso village river (November 22, 2022, 13:00-15:00)
In this investigation, an integration of cloud computing and the IoT was effectively achieved, paving the way for a continuous real-time water quality monitoring system. Through this integration, seamless transmission of data streams, generated by sensors, to cloud platforms was facilitated. Notable accuracy rates were observed: 98.54% for temperature, 96.85% for pH, and 98.10% for TDS sensors.
The cardinal outcome of this research lies in the evidenced accuracy and reliability of the introduced real-time data acquisition methodology. Such results attest to the system's potential utility as an efficacious real-time monitoring solution. A solid foundation has thus been laid for subsequent research endeavors, especially focusing on the optimization of cloud-based computing to further enhance data acquisition speed and efficiency.
It is acknowledged that the present study is not devoid of limitations. Prospective studies might delve into enhancing the system's resilience to connectivity disruptions and gauging its adaptability under an array of environmental circumstances. Additionally, the potential integration of machine learning algorithms, aimed at refining data analysis and predictive capacities, merits exploration, as this could bolster the system's analytical prowess.
To encapsulate, the findings underscore the paramount importance of optimized data transmission techniques in the realm of real-time water quality monitoring. By addressing the intrinsic limitations of conventional systems and ushering in a rapid and dependable data conduit, the proposed methodology holds promise for elevating environmental monitoring protocols. It is envisaged that subsequent investigations will seek to refine this approach further and probe its synergistic integration with avant-garde technologies to furnish a holistic water quality assessment and management framework.
[1] UNICEF (2017). Progress on Drinking Water, Sanitation and Hygiene: 2017 Update and SDG Baselines. https://policycommons.net/artifacts/421754/progress-on-drinking-water-sanitation-and-hygiene/1392737/.
[2] Tilley, E., Ulrich, L., Lüthi, C., Reymond, P., Zurbrügg, C. (2014). Compendium of sanitation systems and technologies. http://environmentportal.in/files/Compendium_of_Sanitation_Sys_and_Tech_2008.pdf
[3] Andersson, K. (2016). Sanitation, wastewater management and sustainability: from waste disposal to resource recovery. UN Environmental Programme Global Programme of Action for the protection of the Marine Environment from Land Based activities and Stockholm Environment Institute (SEI).
[4] Eskin, M.G., Torabfam, M., Psillakis, E., Cincinelli, A., Kurt, H., Yüce, M. (2019). Real-time water quality monitoring of an artificial lake using a portable, affordable, simple, arduino-based open source sensor. Environmental Engineering-Inženjerstvo Okoliša, 6(1): 7-14. https://doi.org/10.37023/ee.6.1.2
[5] Kumari, R. Kumari, N., Kumari, J. (2018). Summing up water characteristics with software-analysed trophic interrelations in a pond. International Journal of Advanced Research, 6(12): 952-955. https://doi.org/10.21474/ijar01/8221
[6] Kirchner, J.W., Feng, X., Neal, C., Robson, A.J. (2004). The fine structure of water-quality dynamics: The (high-frequency) wave of the future. Hydrological processes, 18(7): 1353-1359. https://doi.org/10.1002/hyp.5537
[7] Oelen, A., van Aart, C.J., De Boer, V. (2018). Measuring Surface Water Quality Using a Low-Cost Sensor Kit within the Context of Rural Africa. In P-ICT4D@ WebSci. https://w4ra.org/wp-content/uploads/2018/09/Measuring-water-quality-Allard-Oelen-Final.pdf
[8] Das, B., Jain, P.C. (2017). Real-time water quality monitoring system using Internet of Things. In 2017 International conference on computer, communications and electronics (Comptelix), Jaipur, India, pp. 78-82. https://doi.org/10.1109/COMPTELIX.2017.8003942
[9] M Radwan, A.A., A Abdelmoneim, M., I Basiony, A., A El-Alfy, M. (2019). Water pollution monitoring in Idku Lake (Egypt) using phytoplankton and NSF-WQI. Egyptian Journal of Aquatic Biology and Fisheries, 23(4): 465-481. https://doi.org/10.21608/ejabf.2019.57161
[10] Karaouia, I., Ariouaa, A., Boudhara, A., Elhamdounia, D., Ouhamchicha, K.A., Idrissic, A.E.A., Hssaisouned, M. (2020). New simplification into NSF-WQI index to assess El Abid River water quality–Morocco. Desalination and Water Treatment, 204: 59-68. https://doi.org/10.5004/dwt.2020.26277
[11] Alexakis, D.E. (2020). Meta-evaluation of water quality indices. application into groundwater resources. Water, 12(7): 1890. https://doi.org/10.3390/w12071890
[12] Ashour, E., Zeidan, B., Elshemy, M. (2021). Assessment of agricultural drainage water reuse for irrigation in El-Behira Governorate, Egypt. Water Science, 35(1): 135-153. https://doi.org/10.1080/23570008.2021.1982336
[13] Ristanto, D., Ambariyanto, A., Yulianto, B. (2021). Water quality assessment based on national sanitations foundation water quality index during rainy season in Sibelis and kemiri estuaries Tegal city. IOP Conference Series: Earth and Environmental Science, 750: 012013. https://doi.org/10.1088/1755-1315/750/1/012013.
[14] Al-Mayah, W.T., Al-Mayyahi, S.O.M., Al-Shammary, S.H. (2021). Water quality assessment in terms of water quality index (WQI): A case study of the Tigris River, Baghdad, Iraq. IOP Conference Series: Earth and Environmental Science, 779(1): 012078. https://doi.org/10.1088/1755-1315/779/1/012078
[15] Murali, K., Meenakshi, M., Uma, R. N. (2020). Surface water (wetlands) quality assessment in Coimbatore (India) based on national sanitation foundation water quality index (NSF WQI). IOP Conference Series: Materials Science and Engineering, 932(1): 012049. IOP Publishing. https://doi.org/10.1088/1757-899X/932/1/012049
[16] Lopes, O.F., de Jesus, R.M., de Sousa, L.F., et al. (2021). Comparison between water quality indices in watersheds of the Southern Bahia (Brazil) with different land use. Environmental Science and Pollution Research, 28: 12944-12959. https://doi.org/10.1007/s11356-020-10941-7
[17] Benouara, N., Laraba, A., Hachemi Rachedi, L. (2016). Assessment of groundwater quality in the Seraidi region (north-east of Algeria) using NSF-WQI. Water Science and Technology: Water Supply, 16(4): 1132-1137. https://doi.org/10.2166/ws.2016.030
[18] Caraveo-Cacep, M.A., Vázquez-Medina, R., Zavala, A.H. (2023). A survey on low-cost development boards for applying cryptography in IoT systems. Internet of Things, 22: 100743. https://doi.org/10.1016/j.iot.2023.100743
[19] Garrido-Momparler, V., Peris, M. (2022). Smart sensors in environmental/water quality monitoring using IoT and cloud services. Trends in Environmental Analytical Chemistry, 35: e00173. https://doi.org/10.1016/j.teac.2022.e00173
[20] Shilpashree, S., Patil, R.R., Parvathi, C. (2018). Cloud computing an overview. International Journal of Engineering & Technology, 7(4): 2743-2746. https://doi.org/10.14419/ijet.v7i4.10904
[21] Li, Y., Orgerie, A.C., Rodero, I., Amersho, B.L., Parashar, M., Menaud, J.M. (2018). End-to-end energy models for Edge Cloud-based IoT platforms: Application to data stream analysis in IoT. Future Generation Computer Systems, 87: 667-678. https://doi.org/10.1016/j.future.2017.12.048
[22] Li, X., Wang, Q., Lan, X., Chen, X., Zhang, N., Chen, D. (2019). Enhancing cloud-based IoT security through trustworthy cloud service: An integration of security and reputation approach. IEEE Access, 7: 9368-9383. https://doi.org/10.1109/ACCESS.2018.2890432
[23] Al-Kadhim, H.M., Al-Raweshidy, H.S. (2019). Energy efficient and reliable transport of data in cloud-based IoT. IEEE Access, 7: 64641-64650. https://doi.org/10.1109/ACCESS.2019.2917387
[24] Zaslavsky, A., Perera, C., Georgakopoulos, D. (2013). Sensing as a service and big data. arXiv preprint arXiv:1301.0159. http://arxiv.org/abs/1301.0159
[25] Flammini, A., Sisinni, E. (2014). Wireless sensor networking in the internet of things and cloud computing era. Procedia Engineering, 87: 672–679. https://doi.org/10.1016/j.proeng.2014.11.577
[26] Suryono, S., Surarso, B., Saputra, R., Sudalma, S. (2019). Real-time decision support system for carbon monoxide threat warning using online expert system. Journal of Applied Engineering Science, 17(1): 18-25. https://doi.org/10.5937/jaes17-17429
[27] Ooi, K.S., Chen, Z., Poh, P.E., Cui, J. (2022). BOD5 prediction using machine learning methods. Water Supply, 22(1): 1168-1183. https://doi.org/10.2166/ws.2021.202
[28] Jouanneau, S., Recoules, L., Durand, M.J., et al. (2014). Methods for assessing biochemical oxygen demand (BOD): A review. Water Research, 49: 62-82. https://doi.org/10.1016/j.watres.2013.10.066
[29] Syeed, M.M., Hossain, M.S., Karim, M.R., Uddin, M.F., Hasan, M., Khan, R.H. (2023). Surface water quality profiling using the water quality index, pollution index and statistical methods: A critical review. Environmental and Sustainability Indicators, 18: 100247. https://doi.org/10.1016/j.indic.2023.100247
[30] Rana, M., Rahman, A., Dabrowski, J., Arnold, S., McCulloch, J., Pais, B. (2021). Machine learning approach to investigate the influence of water quality on aquatic livestock in freshwater ponds. Biosystems Engineering, 208: 164-175. https://doi.org/10.1016/j.biosystemseng.2021.05.017
[31] Dilmi, S., Ladjal, M. (2021). A novel approach for water quality classification based on the integration of deep learning and feature extraction techniques. Chemometrics and Intelligent Laboratory Systems, 214: 104329. https://doi.org/10.1016/j.chemolab.2021.104329
[32] Zhu, L., Husny, Z.J.B.M., Samsudin, N.A., Xu, H., Han, C. (2023). Deep learning method for minimizing water pollution and air pollution in urban environment. Urban Climate, 49: 101486. https://doi.org/10.1016/j.uclim.2023.101486
[33] Zamani, M.G., Nikoo, M.R., Niknazar, F., Al-Rawas, G., Al-Wardy, M., Gandomi, A.H. (2023). A multi-model data fusion methodology for reservoir water quality based on machine learning algorithms and bayesian maximum entropy. Journal of Cleaner Production, 416: 137885. https://doi.org/10.1016/j.jclepro.2023.137885
[34] Suglharto, W.H., Riadi, A.A., Ghozali, M.I. (2018). Web Based information system of carbon monoxide pollution. In The 3rd International Conference on Energy, Environmental and Information System (ICENIS 2018), Semarang, Indonesia, pp. 05026. https://doi.org/10.1051/e3sconf/20187305026
[35] Liouane, O., Femmam, S., Bakir, T., Abdelali, A.B. (2022). Cascade machines learning process for node localization in large-scale wireless sensor networks. Ingénierie des Systèmes d’Information, 27(4): 531-537. https://doi.org/10.18280/isi.270402
[36] Chung, W.Y., Oh, S.J. (2006). Remote monitoring system with wireless sensors module for room environment. Sensors and Actuators B: Chemical, 113(1): 64-70. https://doi.org/10.1016/j.snb.2005.02.023
[37] AlFaris, F., Juaidi, A., Manzano-Agugliaro, F. (2017). Intelligent homes’ technologies to optimize the energy performance for the net zero energy home. Energy and Buildings, 153: 262-274. https://doi.org/10.1016/j.enbuild.2017.07.089
[38] Lee, J., Choi, B. (2014). Development of a piezoelectric energy harvesting system for implementing wireless sensors on the tires. Energy Conversion and Management, 78: 32-38. https://doi.org/10.1016/j.enconman.2013.09.054
[39] Posnicek, T., Kellner, K., Brandl, M. (2014). Wireless sensor network for environmental monitoring with 3G connectivity. Procedia Engineering, 87: 524-527. https://doi.org/10.1016/j.proeng.2014.11.539
[40] Sugiharto, W.H., Ghozali, M.I., Susanto, H., Budihardjo, M.A., Suryono, S. (2020). Database replication method for real-time measurement pH parameter of fishery using a wireless sensor system. Journal of Physics: Conference Series, 1524(1): 012021. https://doi.org/10.1088/1742-6596/1524/1/012021
[41] Chang, Y.C., Lin, C.C., Lin, P.H., Chen, C.C., Lee, R.G., Huang, J.S., Tsai, T.H. (2013). eFurniture for home-based frailty detection using artificial neural networks and wireless sensors. Medical Engineering & Physics, 35(2): 263-268. https://doi.org/10.1016/j.medengphy.2011.09.010
[42] SAV, S.M., Raj, B., Sivalingam, K.M., Ebenezer, J., Chandran, T., Shanmugavel, M., Rajan, K.K. (2012). Wireless sensor network for sodium leak detection. Nuclear Engineering and Design, 249: 432-437. https://doi.org/10.1016/j.nucengdes.2012.04.027
[43] Jafer, E., Ibala, C.S. (2013). Design and development of multi-node based wireless system for efficient measuring of resistive and capacitive sensors. Sensors and Actuators A: Physical, 189: 276-287. https://doi.org/10.1016/j.sna.2012.09.023
[44] Green, O., Nadimi, E.S., Blanes-Vidal, V., Jørgensen, R. N., Storm, I.M.D., Sørensen, C. G. (2009). Monitoring and modeling temperature variations inside silage stacks using novel wireless sensor networks. Computers and Electronics in Agriculture, 69(2): 149-157. https://doi.org/10.1016/j.compag.2009.07.021
[45] Selvabala, V.S.N., Ganesh, A.B. (2012). Implementation of wireless sensor network based human fall detection system. Procedia Engineering, 30: 767-773. https://doi.org/10.1016/j.proeng.2012.01.926
[46] Liu, H., Yin, S., Liu, L., Wei, S. (2011). A new wireless sensor platform with camera. Procedia Environmental Sciences, 11: 552-557. https://doi.org/10.1016/j.proenv.2011.12.087
[47] Haseeb, K., Lee, S., Jeon, G. (2020). EBDS: An energy-efficient big data-based secure framework using Internet of Things for green environment. Environmental Technology & Innovation, 20: 101129. https://doi.org/10.1016/j.eti.2020.101129
[48] Neicu, A.I., Radu, A.C., Zaman, G., Stoica, I., Răpan, F. (2020). Cloud computing usage in SMEs. An empirical study based on SMEs employees perceptions. Sustainability, 12(12): 4960. https://doi.org/10.3390/su12124960
[49] Miles, B., Bourennane, E.B., Boucherkha, S., Chikhi, S. (2020). A study of LoRaWAN protocol performance for IoT applications in smart agriculture. Computer Communications, 164: 148-157. https://doi.org/10.1016/j.comcom.2020.10.009
[50] Arfi, W.B., Nasr, I.B., Khvatova, T., Zaied, Y.B. (2021). Understanding acceptance of eHealthcare by IoT natives and IoT immigrants: An integrated model of UTAUT, perceived risk, and financial cost. Technological Forecasting and Social Change, 163: 120437. https://doi.org/10.1016/j.techfore.2020.120437
[51] Sood, S.K., Sandhu, R., Singla, K., Chang, V. (2018). IoT, big data and HPC based smart flood management framework. Sustainable Computing: Informatics and Systems, 20: 102-117. https://doi.org/10.1016/j.suscom.2017.12.001
[52] Wilianto, W., Kurniawan, A. (2018). Sejarah, cara kerja dan manfaat internet of things. Matrix: Jurnal Manajemen Teknologi Dan Informatika, 8(2): 36-41. https://doi.org/10.31940/matrix.v8i2.818
[53] Gunathilake, N.A., Buchanan, W.J., Asif, R. (2019). Next generation lightweight cryptography for smart IoT devices: Implementation, challenges and applications. In 2019 IEEE 5th World Forum on Internet of Things (WF-IoT), Limerick, Ireland, pp. 707-710. https://doi.org/10.1109/WF-IoT.2019.8767250